global stocks
Deleveraging Tested on 13 Markets: Only 2 Beat SPY
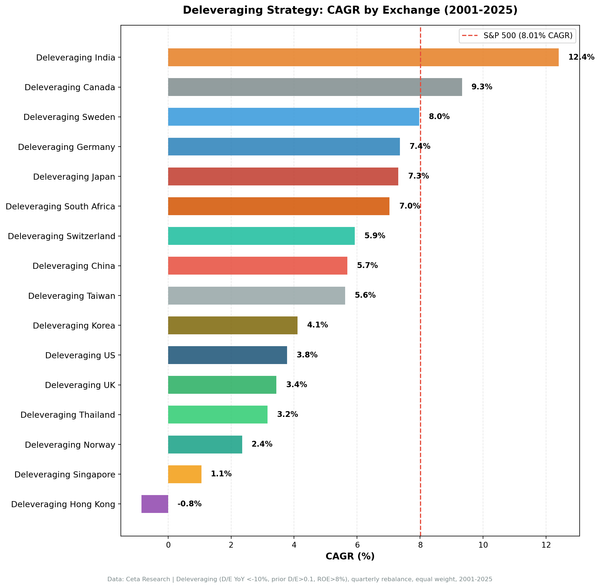
D/E reduction + ROE > 8% tested on 13 exchanges from 2001-2025. Only India (+4.39%) and Canada (+1.32%) beat SPY. US -4.23%, HK -8.85%. The signal is regime-dependent, not universal.

global stocks
D/E reduction + ROE > 8% tested on 13 exchanges from 2001-2025. Only India (+4.39%) and Canada (+1.32%) beat SPY. US -4.23%, HK -8.85%. The signal is regime-dependent, not universal.
debt reduction
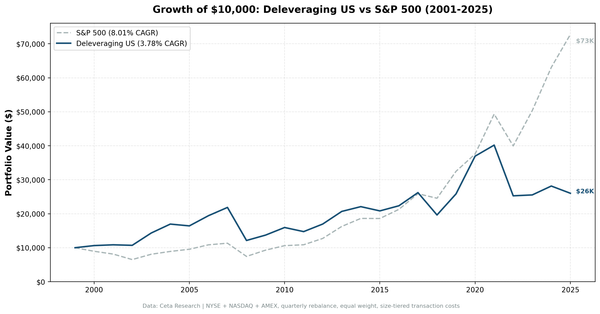
We backtested D/E reduction with ROE > 8% on US stocks from 2001-2025. 3.78% CAGR vs 8.01% for SPY. Pre-2013 it averaged +2.7% excess per year. Post-2013 it averaged -9.8%. The signal didn't fail — it became regime-dependent when ZIRP made leverage cheap.
india stocks
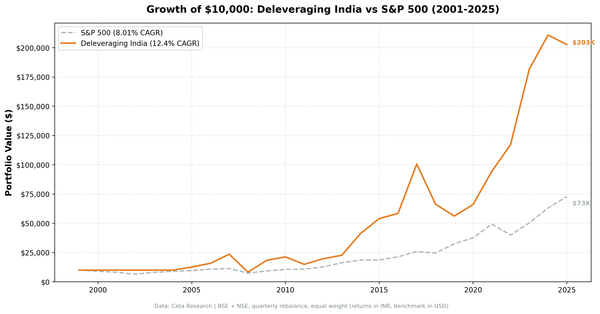
The same D/E reduction + ROE > 8% screen that fails in the US adds 4.39% annually in India. CAGR 12.40%, down capture 40.66%, total return 1,927%. The signal works here because balance sheet discipline is genuinely scarce in India's growth economy.
backtests
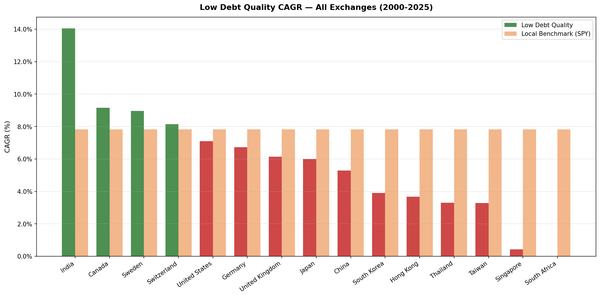
We ran a low-debt + Piotroski F-Score screen on 13 exchanges over 25 years. India leads at 14.05% CAGR with -2.02% down capture. Canada is the biggest surprise. Switzerland has the best Sharpe. Here''s the full global breakdown.
value investing
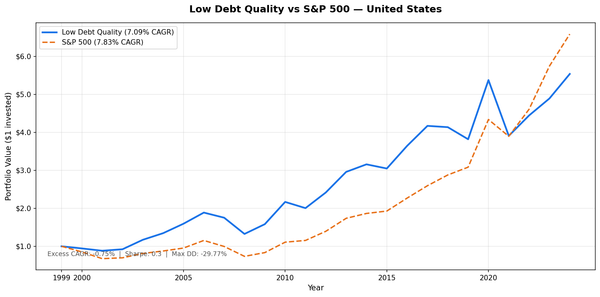
We screened all US stocks (NYSE, NASDAQ, AMEX) for low leverage and high financial quality using D/E < 0.5 and a Piotroski F-Score of 7 or higher, then held the portfolio annually for 25 years. The result: 7.09% CAGR vs 7.83% for SPY. The strategy trailed
quality investing
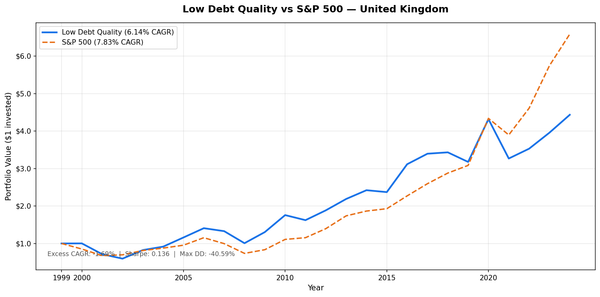
We ran the low-leverage quality screen on LSE-listed UK stocks across 25 years. D/E < 0.5 and Piotroski F-Score >= 7 as the entry conditions. Annual July rebalance, equal weight, all qualifying stocks held. The result: 6.14% CAGR vs 7.83% for SPY. A deficit of -1.
quality investing
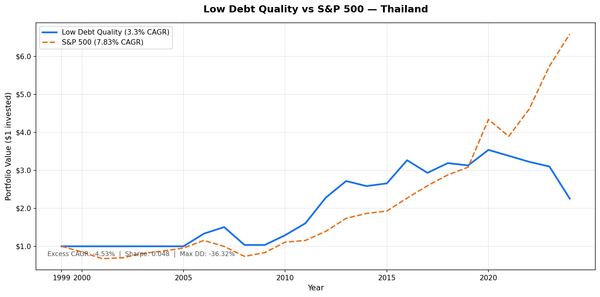
We screened all SET-listed stocks for D/E < 0.5 and Piotroski F-Score of 7 or higher, then held the portfolio annually from 2000 to 2025. The result: 3.30% CAGR vs 7.83% for SPY. The strategy trailed by 4.53% per year. Total return was 125.34%
quality investing
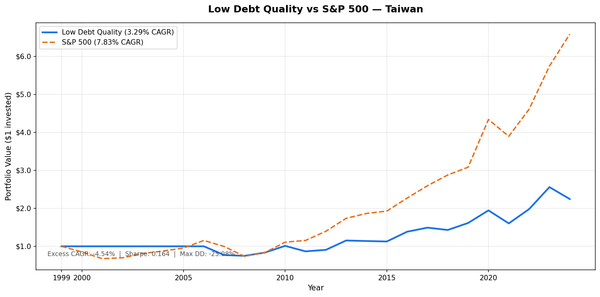
We screened all TAI and TWO-listed stocks for D/E < 0.5 and Piotroski F-Score of 7 or higher, then held the portfolio annually from 2000 to 2025. The result: 3.29% CAGR vs 7.83% for SPY. The strategy trailed by 4.54% per year. Total return was
quality investing
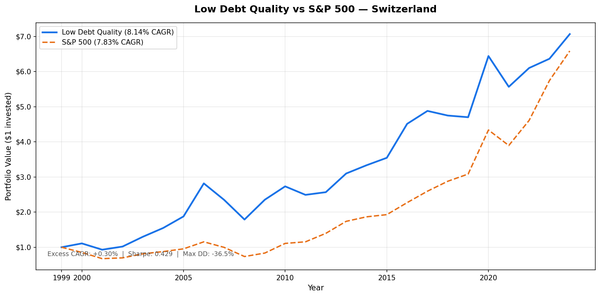
D/E < 0.5 + Piotroski F-Score >= 7 on the SIX Swiss Exchange produced the highest Sharpe ratio of any market tested (0.429), 8.14% CAGR, 69.27% down capture, and zero cash periods across 25 years.
quality investing
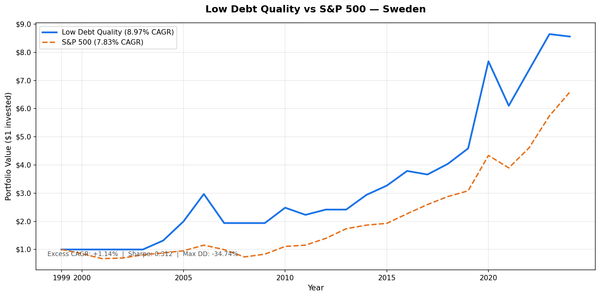
D/E < 0.5 + Piotroski F-Score >= 7 on the Stockholm exchange returned 8.97% CAGR vs 7.83% for SPY, with 106.29% up capture and 7 protective cash periods. A thin but effective universe of 22 stocks.
quality investing
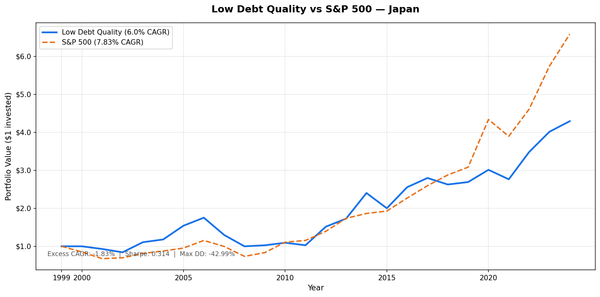
D/E < 0.5 and Piotroski F-Score >= 7 on JPX stocks across 25 years. 6.00% CAGR vs 7.83% SPY. 112 avg qualifying stocks, 75.1% down capture. Abenomics drove +47.4% in 2012 and +38.9% in 2014. Japan's deflation era cost the strategy its 25-year edge.
value investing
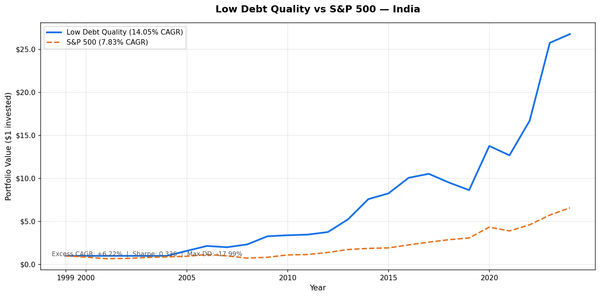
D/E < 0.5 + Piotroski F-Score >= 7 on BSE and NSE, backtested 2000-2025. 14.05% CAGR in INR, +6.22% excess vs SPY, -2.02% down capture. When SPY fell -26.1% in 2008, this portfolio returned +16.4%.