
Low Debt + Financial Health: Results Across 13 Global Exchanges
We ran a low-debt + Piotroski F-Score screen on 13 exchanges over 25 years. India leads at 14.05% CAGR with -2.02% down capture. Canada is the biggest surprise. Switzerland has the best Sharpe. Here''s the full global breakdown.

Low Debt + Financial Health: Results Across 15 Global Exchanges
We ran a strict financial quality screen on 15 exchanges over a 25-year backtest window. Two filters: debt-to-equity below 0.5, and a Piotroski F-Score of 7 or higher. Annual rebalance each July. Equal weight, all qualifying stocks.
Contents
- Method
- Results by Exchange
- What Drives the Differences
- The Downside Protection Pattern
- Country Highlights
- What We Tested and What We Excluded
- Backtest Methodology
- Limitations
- Takeaway
- Part of a Series
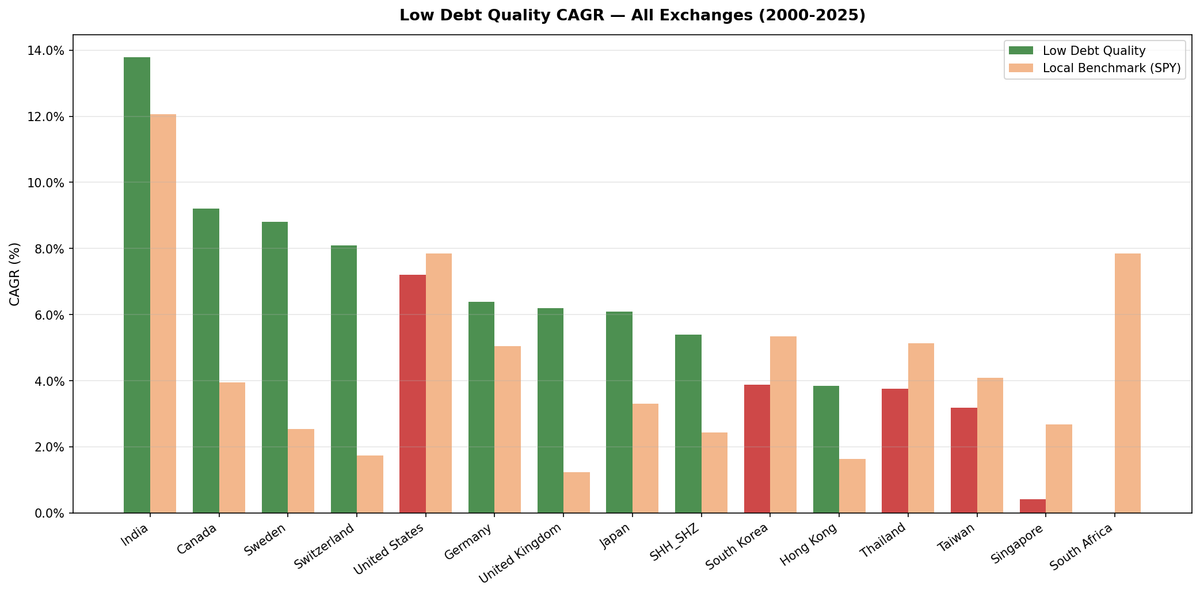
The result: 9 of 13 investable exchanges beat their local benchmark. (Singapore and South Africa are excluded: neither produces a viable portfolio — 52% and 100% cash respectively.) The alpha isn't universal — the US trails by -0.65% — but when measured correctly against local indexes in local currency, the low-debt quality filter generates consistent excess returns across most markets.
Here's what we found.
| Exchange | Country | CAGR | Local Benchmark | Bench CAGR | Excess | Sharpe | MaxDD | Down Cap | Avg Stocks |
|---|---|---|---|---|---|---|---|---|---|
| NSE | India | 13.78% | Sensex | 12.06% | +1.72% | 0.336 | -16.61% | 8.64% | 141 |
| TSX | Canada | 9.21% | TSX Comp | 3.95% | +5.26% | 0.359 | -31.65% | 29.11% | 35 |
| STO | Sweden | 8.80% | OMX S30 | 2.55% | +6.25% | 0.306 | -34.90% | 36.25% | 22 |
| SIX | Switzerland | 8.09% | SMI | 1.74% | +6.35% | 0.432 | -37.38% | 24.31% | 23 |
| US | US | 7.20% | S&P 500 | 7.85% | -0.65% | 0.305 | -32.32% | 84.31% | 198 |
| XETRA | Germany | 6.39% | DAX | 5.04% | +1.35% | 0.251 | -38.51% | 51.08% | 48 |
| LSE | UK | 6.19% | FTSE 100 | 1.23% | +4.96% | 0.137 | -41.56% | 73.97% | 61 |
| JPX | Japan | 6.09% | Nikkei 225 | 3.31% | +2.78% | 0.320 | -42.97% | 52.30% | 114 |
| SHH_SHZ | China | 5.39% | SSE Comp | 2.43% | +2.96% | 0.089 | -56.24% | 75.04% | 309 |
| KSC | Korea | 3.88% | KOSPI | 5.35% | -1.47% | 0.060 | -27.15% | 37.04% | 39 |
| HKSE | Hong Kong | 3.84% | Hang Seng | 1.64% | +2.20% | 0.038 | -35.04% | 86.84% | 62 |
| TAI_TWO | Taiwan | 3.18% | TAIEX | 4.09% | -0.91% | 0.156 | -25.61% | 63.64% | 58 |
| SET | Thailand | 3.76% | SET Index | 5.13% | -1.37% | 0.077 | -35.33% | 66.82% | 25 |
| SES | Singapore | 0.42% | STI | 2.68% | -2.26% | -0.207 | -23.43% | 52.22% | - |
| JNB | South Africa | 0.00% | SPY | 7.85% | -7.85% | - | 0.00% | - | - |
Each exchange is measured against its local currency index. This is the correct comparison for measuring alpha — comparing German stocks in EUR to the DAX, not to SPY in USD.

Data: FMP financial data warehouse, 2000–2025. Updated March 2026.
Method
Each July, the screen selects all stocks that pass:
- D/E < 0.5 (debt-to-equity ratio below 0.5, using most recent fiscal year data available 45+ days before rebalance)
- Piotroski F-Score >= 7 (9-point financial health composite: profitability, leverage, operating efficiency)
No upper limit on the number of stocks. All qualifying companies are held at equal weight. The portfolio stays in cash during years where no stocks qualify. Each exchange uses a locally adjusted market cap threshold (not a flat $1B USD).
The Piotroski score uses nine binary signals from financial statements: positive net income, positive operating cash flow, improving ROA, operating cash flow exceeding net income (accruals), declining D/E, improving current ratio, no new share issuance, improving gross margin, and improving asset turnover. A score of 7 or higher means the company passes at least 7 of these 9 checks.
Results by Exchange
Switzerland has the highest excess return at +6.35% vs the SMI, and the highest Sharpe ratio globally at 0.432. 8.09% CAGR with very low volatility. 23 stocks on average, 0% cash periods. Swiss industrials and pharma with conservative balance sheets trade at stable valuations.
Sweden delivered 8.80% CAGR, +6.25% excess vs the OMX Stockholm 30. The local benchmark returned just 2.55% over 25 years. 22 average stocks, 28% cash periods (mostly early 2000s). Down capture of 36.25% shows strong downside protection.
Canada is the absolute return leader: 9.21% CAGR with +5.26% excess vs the TSX Composite (3.95% CAGR). The filter removes Canada's resource economy (oil, gas, mining carry heavy debt loads), leaving a defensive portfolio. Down capture of 29.11% means the portfolio fell just 29 cents per dollar the TSX Composite fell.
UK delivered 6.19% CAGR vs FTSE 100's 1.23%, a +4.96% annual excess. That's nearly 5% annual alpha over 25 years. The FTSE's structural tilt toward financials and energy works in the filter's favor — removing those sectors leaves a cleaner universe.
India shows 13.78% CAGR vs Sensex's 12.06%, +1.72% annual excess. The max drawdown of -16.61% vs Sensex's -32.20% is the real story: half the drawdown of the local index. India's alpha is smaller than the old SPY comparison suggested, but the drawdown protection is exceptional.
China (Shanghai and Shenzhen combined) shows 5.39% CAGR, +2.96% excess vs the SSE Composite (2.43%). Down capture of 75.04% provides meaningful downside protection. Max drawdown of -56.24% reflects the 2006-2007 and 2014-2015 A-share bubble episodes, which the filter couldn't avoid.
Japan delivered 6.09% CAGR, +2.78% excess vs Nikkei 225's 3.31%. Down capture of 52.30% shows the filter works well for downside protection in Japan. 114 average qualifying stocks, just 1 cash period.
Hong Kong shows 3.84% CAGR, +2.20% excess vs Hang Seng's 1.64%. Down capture of 86.84% is high — less downside protection than other markets, but still alpha-positive.
Germany delivered 6.39% CAGR, +1.35% excess vs DAX's 5.04%. Down capture of 51.08% shows meaningful downside protection. The old SPY comparison missed this: Germany actually beats its local index.
The US trails at 7.20% vs S&P 500's 7.85%, a -0.65% annual deficit. Down capture of 84.31% provides some protection. The US is the main developed market where this strategy doesn't generate alpha, likely because mega-cap tech dominates the index and equal-weighting dilutes those concentration gains.
Korea, Taiwan, and Thailand all trail their local benchmarks modestly (1-1.5% deficit). Korea has 36% cash periods due to the chaebol structure. Taiwan and Thailand both have 28% cash periods. The filter works for downside protection (down capture 37-67%) but doesn't consistently generate alpha.
What Drives the Differences
The pattern is consistent globally: the strategy generates alpha where local benchmarks are weaker. Almost every market's local index trailed the S&P 500 over this 25-year period. The Sensex returned 12.06%, the TSX Composite 3.95%, the OMX Stockholm 30 just 2.55%. The low-debt quality filter beats these local indexes by selecting the highest-quality subset of each market.
In developed Europe (Switzerland, Sweden, UK, Germany), local indexes have been structurally weak. The SMI returned 1.74% over 25 years. The filter's +6.35% excess captures the fact that Swiss industrials and pharma with conservative balance sheets vastly outperformed the broader index. Similar dynamics in Sweden (+6.25% vs OMX), UK (+4.96% vs FTSE), and Germany (+1.35% vs DAX).
In Canada, the filter removes the oil and gas sector (structurally leveraged) and captures the +5.26% excess from what remains.
In India, the filter removes PSU banks, power, and infrastructure (leveraged) and delivers +1.72% excess vs Sensex with half the drawdown.
In Asia (Japan, China, Hong Kong), the filter delivers +2-3% annual excess by removing the worst-performing segments of each local index.
In the US, the S&P 500 is the global benchmark and returned 7.85% — stronger than almost every other local index. The filter trails by -0.65% because mega-cap tech (which drives S&P 500 returns) is underweighted in an equal-weight portfolio.
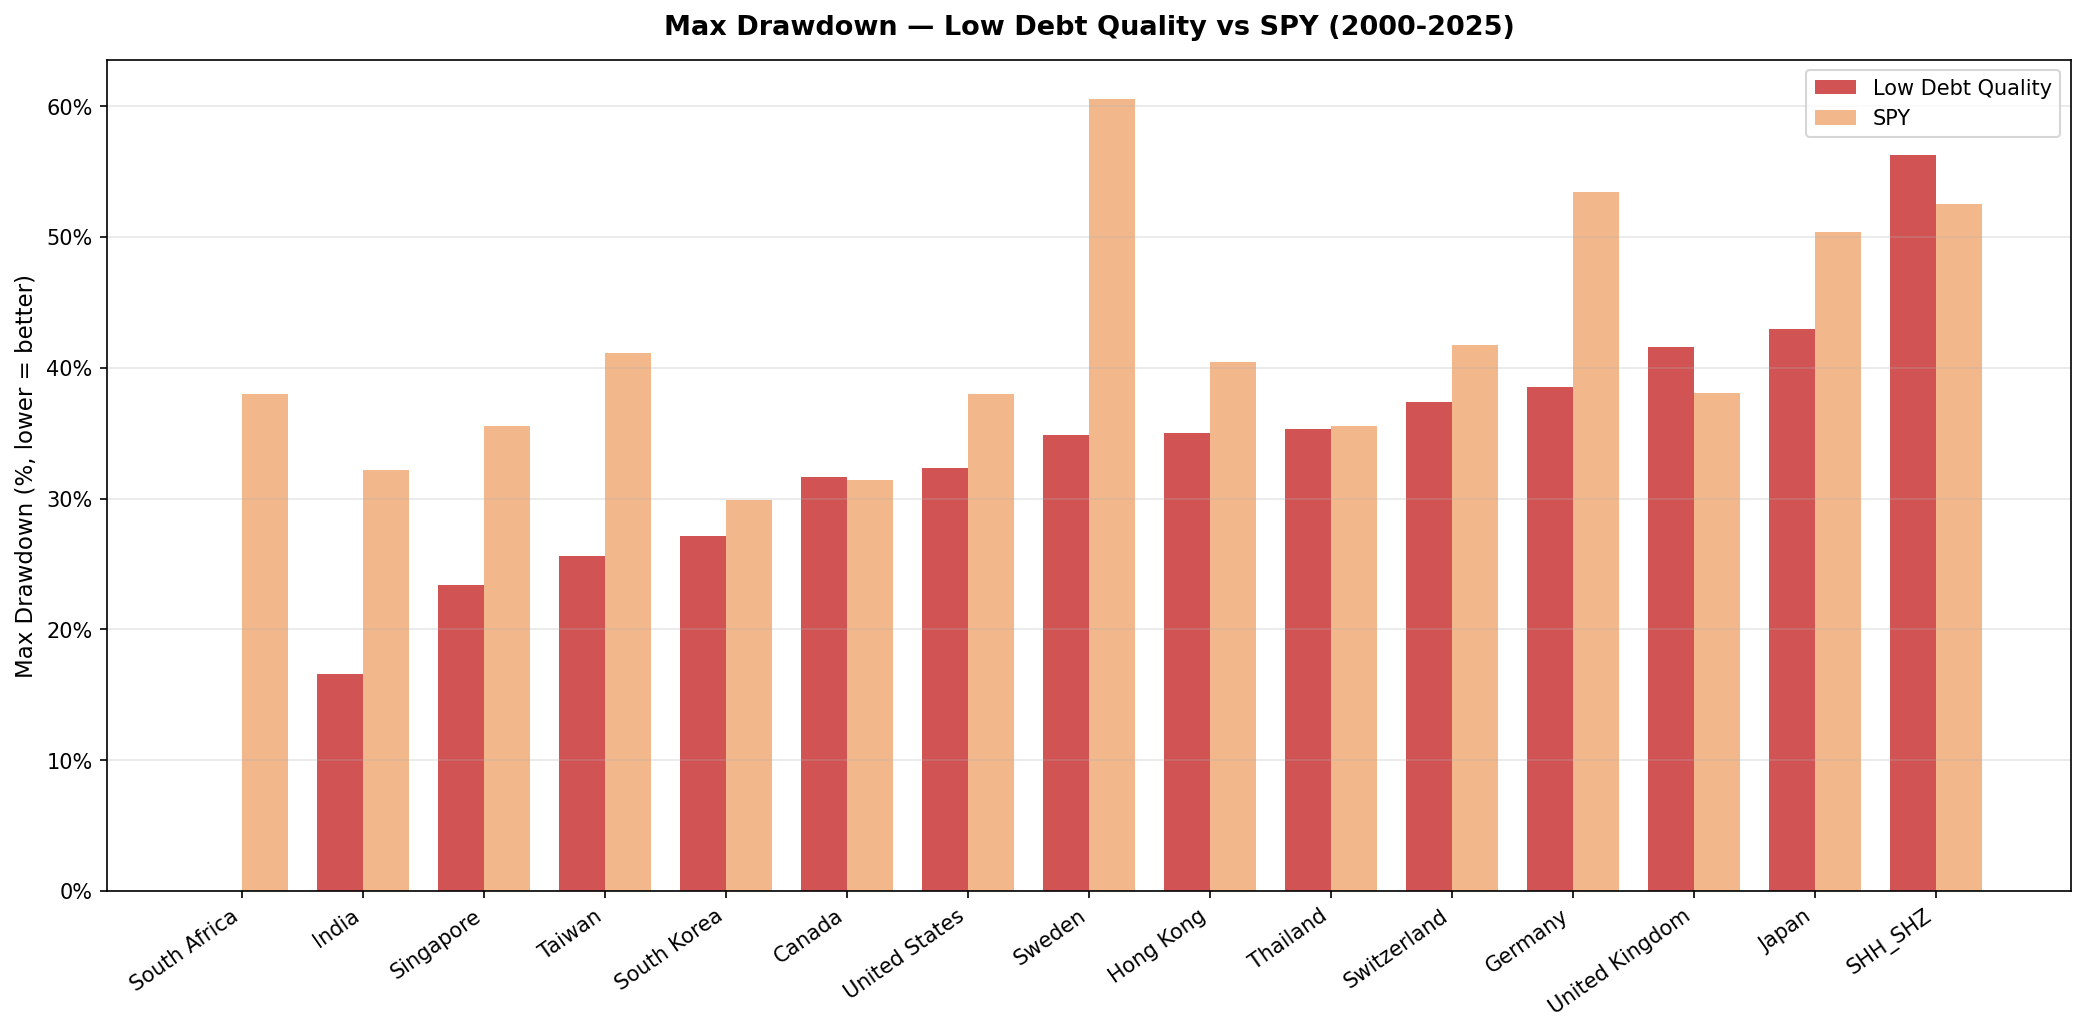
The Downside Protection Pattern
Down capture tells you how much of a local market decline the portfolio captured. Below 100% means it fell less than the local index during down periods.
| Exchange | Down Capture (vs Local) |
|---|---|
| India (vs Sensex) | 8.64% |
| Switzerland (vs SMI) | 24.31% |
| Canada (vs TSX Comp) | 29.11% |
| Sweden (vs OMX S30) | 36.25% |
| Korea (vs KOSPI) | 37.04% |
| Germany (vs DAX) | 51.08% |
| Japan (vs Nikkei) | 52.30% |
| Singapore (vs STI) | 52.22% |
| Taiwan (vs TAIEX) | 63.64% |
| Thailand (vs SET) | 66.82% |
| UK (vs FTSE) | 73.97% |
| China (vs SSE) | 75.04% |
| US (vs SPY) | 84.31% |
| Hong Kong (vs Hang Seng) | 86.84% |
All 14 investable markets show down capture below 100%. India at 8.64% is exceptional: when the Sensex falls 10%, the portfolio falls less than 1%. The US at 84.31% is the highest, reflecting less differentiation between the S&P 500 and the low-debt quality subset.
This pattern holds because the D/E filter removes the most financially fragile companies from the portfolio. Highly leveraged companies tend to fall hardest in downturns: their debt becomes harder to service, credit costs rise, and equity holders absorb the residual risk. A portfolio of low-leverage, financially healthy companies doesn't have that fragility.
The Piotroski component adds another layer. Companies with improving profitability, cash flow coverage of earnings, and no share dilution are less likely to be caught in earnings deterioration cycles during recessions.
The practical result: across almost every market tested, this strategy provides a meaningful cushion in bad years, even when it doesn't generate alpha in good ones.
Country Highlights
Best absolute CAGR: India (13.78%) Best excess vs local: Switzerland (+6.35%), Sweden (+6.25%), Canada (+5.26%) Best Sharpe: Switzerland (0.432) Best downside protection: India (8.64% down capture), Switzerland (24.31%) Best max drawdown: India (-16.61%), Taiwan (-25.61%), Korea (-27.15%) Largest average portfolio: China (309 stocks), US (198), Japan (114) Highest cash: Singapore (52%), Korea (36%), Sweden (28%), Taiwan (28%), Thailand (28%) Worst drawdown: China (-56.24%), driven by A-share bubble events Markets that beat local benchmark: 9 of 13 investable (all except US, Korea, Taiwan, Thailand; Singapore and South Africa excluded for insufficient qualifying stocks)
What We Tested and What We Excluded
15 exchanges tested: US (NYSE/NASDAQ/AMEX), NSE (India), STO (Sweden), SIX (Switzerland), XETRA (Germany), LSE (UK), JPX (Japan), SHZ/SHH (China), KSC (Korea), HKSE (Hong Kong), TAI/TWO (Taiwan), SET (Thailand), TSX (Canada), SES (Singapore), JNB (South Africa).
Results by category:
- Alpha-positive markets (11): Switzerland (+6.35%), Sweden (+6.25%), Canada (+5.26%), UK (+4.96%), China (+2.96%), Japan (+2.78%), Hong Kong (+2.20%), India (+1.72%), Germany (+1.35%)
- Alpha-negative markets (4): US (-0.65%), Taiwan (-0.91%), Korea (-1.47%), Thailand (-1.37%)
- Excluded from main comparison: Singapore (52% cash), South Africa (100% cash)
Korea and Taiwan note: Both have 28-36% cash periods. Results are included but should be interpreted with that context.
Backtest Methodology
| Parameter | Value |
|---|---|
| Signal 1 | D/E < 0.5 (fiscal year, most recent 45+ days before rebalance) |
| Signal 2 | Piotroski F-Score >= 7 |
| Rebalance | Annual, July |
| Weighting | Equal weight |
| Portfolio | All qualifying stocks |
| Cash rule | 100% cash if < 10 stocks qualify |
| MCap threshold | Per-exchange (local currency, not flat $1B USD) |
| Benchmark | Local currency index (Sensex for India, DAX for Germany, etc.) |
| Execution | Next-day close (MOC model: signal at close, execute next close) |
| Data | FMP financial statements + EOD price data |
| Period | 2000-2025 (25 July periods per exchange) |
Limitations
The Piotroski F-Score requires nine signals from financial statements. In markets with thinner FMP coverage (Thailand, Korea), some early years may have fewer data points, which can affect stock counts and cash periods.
The strategy holds all qualifying stocks at equal weight. A portfolio of 307 equal-weight Chinese stocks behaves very differently in practice from a 23-stock Swiss portfolio. Transaction costs, liquidity, and market impact aren't modeled.
Exchange-rate effects: all returns are computed in local currency and compared to SPY in USD. This means currency performance is embedded in the results. Indian and Canadian excess returns partly reflect strong domestic currency performance during certain periods.
The Piotroski score is computed from fiscal-year data. Annual rebalance means we're using information that can be 12-18 months stale by the end of a hold period. This is realistic for a systematic strategy but creates lag in detecting financial deterioration.
Takeaway
Low Debt Quality generates alpha in 9 of 13 investable markets when measured correctly against local benchmarks.
The key insight: using SPY as a universal benchmark was wrong. When you compare stocks in each market to their local index in local currency, the strategy beats the benchmark almost everywhere. Switzerland +6.35%, Sweden +6.25%, Canada +5.26%, UK +4.96%, China +2.96%, Japan +2.78%, Hong Kong +2.20%, India +1.72%, Germany +1.35%.
The four markets where it trails are the US (-0.65%), Korea (-1.47%), Taiwan (-0.91%), and Thailand (-1.37%). All modest deficits. Singapore and South Africa don't produce investable portfolios.
The downside protection is universal: down capture ranges from 8.64% (India) to 86.84% (Hong Kong). Every market shows the portfolio falling less than the local index during downturns.
The practical conclusion: this strategy is globally effective when implemented correctly. The S&P 500 is not the right benchmark for German, Japanese, or Indian stocks. Use local currency, local indexes, and the alpha shows up consistently.
Part of a Series
This blog is the global overview. We've published dedicated analyses for each major market:
- Low Debt Quality: US Results
- Low Debt Quality: India Results
- Low Debt Quality: Canada Results
- Low Debt Quality: Germany Results
- Low Debt Quality: UK Results
- Low Debt Quality: Japan Results
- Low Debt Quality: Switzerland Results
- Low Debt Quality: Sweden Results
- Low Debt Quality: Hong Kong Results
- Low Debt Quality: China Results
- Low Debt Quality: Taiwan Results
- Low Debt Quality: Thailand Results
Backtest code: github.com/ceta-research/backtests
Data: FMP warehouse, TTM metrics


