
Pairs Trading Screening: What 884,000 Correlation Tests Reveal

Finding Pairs Trading Candidates: What 884,000 Correlation Tests Reveal
There are roughly 3,700 US stocks with market cap above $1 billion. That's about 6.8 million possible pairs. Most have no useful relationship.
Contents
- The Screening Pipeline
- Step 1: Define the Universe
- Step 2: Pre-filter by Sector
- Step 3: Compute Pairwise Return Correlations
- Step 4: Fundamental Similarity Filters
- Results
- Why Financial Services Dominates
- The Share-Class Problem
- Run It Yourself
- What Comes Next
- Limitations
The challenge in pairs trading isn't execution or statistics. It's filtering. You need a systematic way to go from millions of possible pairs to the 200-500 worth actually testing for cointegration.
We ran the full screening pipeline on the Ceta Research FMP warehouse: 3,701 US large-cap stocks, pairwise correlations within sectors, fundamental similarity checks. Here's what the data shows.
The Screening Pipeline
Step 1: Define the Universe
Start with US stocks with market cap above $1 billion. This filters out ~97% of listed companies and leaves around 3,700 with reliable price data and sufficient liquidity for actual pairs trading.
WITH mktcap AS (
 SELECT symbol, marketCap,
 ROW_NUMBER() OVER (PARTITION BY symbol ORDER BY date DESC) AS rn
 FROM key_metrics
 WHERE period = 'FY'
 AND marketCap IS NOT NULL
 AND marketCap > 1000000000
)
SELECT p.sector, COUNT(*) AS stocks
FROM profile p
JOIN mktcap m ON p.symbol = m.symbol AND m.rn = 1
WHERE p.country = 'US'
 AND p.sector IS NOT NULL
 AND p.symbol NOT LIKE '%.%'
 AND p.symbol NOT LIKE '%-%'
 AND LENGTH(p.symbol) <= 5
GROUP BY p.sector
ORDER BY stocks DESC
Run this screen on Ceta Research
Current universe by sector:
| Sector | Stocks |
|---|---|
| Financial Services | 752 |
| Healthcare | 699 |
| Technology | 539 |
| Industrials | 436 |
| Consumer Cyclical | 383 |
| Real Estate | 227 |
| Energy | 207 |
| Communication Services | 166 |
| Consumer Defensive | 135 |
| Basic Materials | 115 |
| Utilities | 108 |
| Total | 3,767 |
The market cap filter serves two purposes: data quality (larger companies have reliable multi-year financials) and practical tradability (enough daily volume to enter and exit without moving the price).
Step 2: Pre-filter by Sector
Computing pairwise correlations for all 3,700 stocks costs ~6.8 million pair calculations. Running within sectors first cuts this to roughly 884,000.
More importantly, same-sector pairs have an economic justification for co-movement. XOM and CVX move together because they share commodity exposure. JPM and BAC share interest rate sensitivity. Cross-sector pairs with high correlation usually lack this economic anchor, and the relationship tends to be coincidental rather than structural.
Step 3: Compute Pairwise Return Correlations
For each same-sector pair, compute the Pearson correlation of daily returns over the most recent 252 trading days.
WITH daily_ret AS (
 SELECT symbol, CAST(date AS DATE) AS trade_date,
 (adjClose - LAG(adjClose) OVER (PARTITION BY symbol ORDER BY date))
 / NULLIF(LAG(adjClose) OVER (PARTITION BY symbol ORDER BY date), 0) AS ret
 FROM stock_eod
 WHERE symbol IN (SELECT symbol FROM sector_stocks)
 AND date >= '2024-01-01'
)
SELECT
 a.symbol AS symbol_a,
 b.symbol AS symbol_b,
 ROUND(CORR(a.ret, b.ret), 4) AS correlation,
 COUNT(*) AS common_days
FROM daily_ret a
JOIN daily_ret b
 ON a.trade_date = b.trade_date
 AND a.symbol < b.symbol
WHERE a.ret IS NOT NULL AND b.ret IS NOT NULL
GROUP BY a.symbol, b.symbol
HAVING COUNT(*) >= 252
 AND CORR(a.ret, b.ret) >= 0.80
ORDER BY correlation DESC
The a.symbol < b.symbol constraint avoids duplicate pairs. HAVING COUNT(*) >= 252 ensures a full year of overlapping data.
Step 4: Fundamental Similarity Filters
High correlation is necessary but not sufficient. Two stocks can be highly correlated by coincidence. Adding fundamental similarity filters increases the probability that the relationship is structural.
Market cap ratio: Both stocks should have comparable market caps. A $200B stock paired with a $2B stock creates asymmetric risk and very different liquidity profiles. We filter for ratios below 5x.
Same industry: Within a sector, sub-industry matching strengthens the economic link. Energy has integrated majors, E&P companies, refiners, and pipeline operators. Integrated-to-integrated pairs are more reliable than integrated-to-refiner.
Price history overlap: Both stocks need at least 252 overlapping trading days. IPO-stage companies or recently delisted stocks don't have enough history to estimate a stable correlation.
Results
Running the full pipeline on all US stocks above $1B market cap:
| Metric | Value |
|---|---|
| Universe | 3,701 stocks |
| Same-sector pairs tested | ~884,000 |
| Pairs with corr ≥ 0.80 (before mktcap filter) | 2,945 |
| Candidate pairs (after mktcap ratio < 5x) | 2,579 |
| Same-industry pairs | 2,359 (91.5%) |
| Cross-industry pairs | 220 (8.5%) |
| Average correlation | 0.833 |
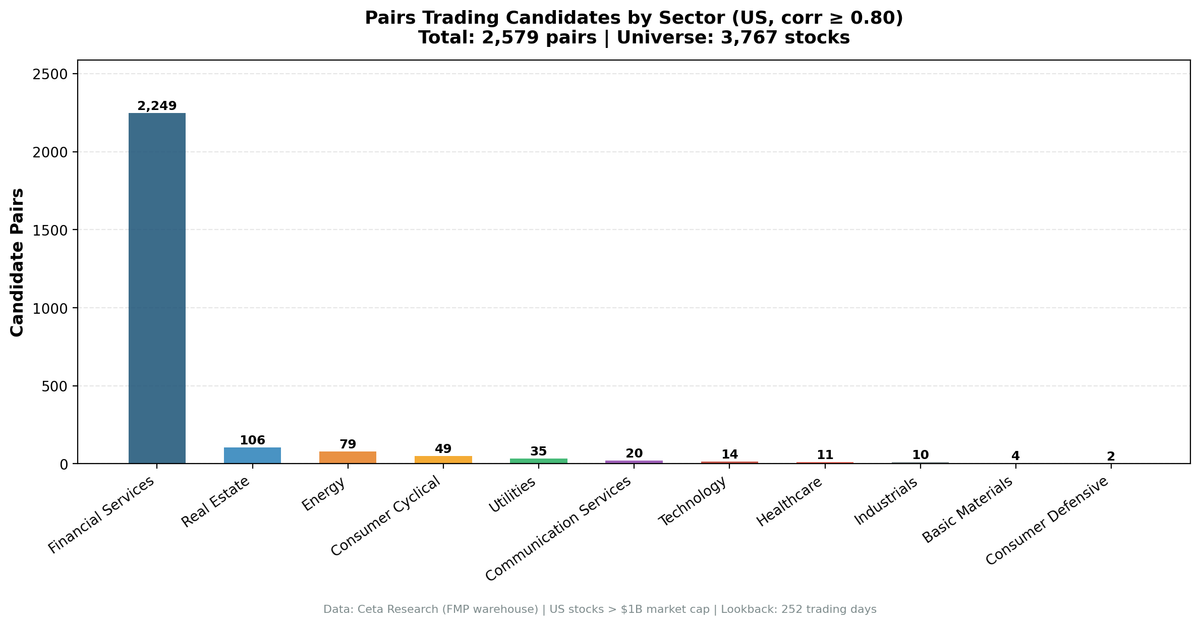
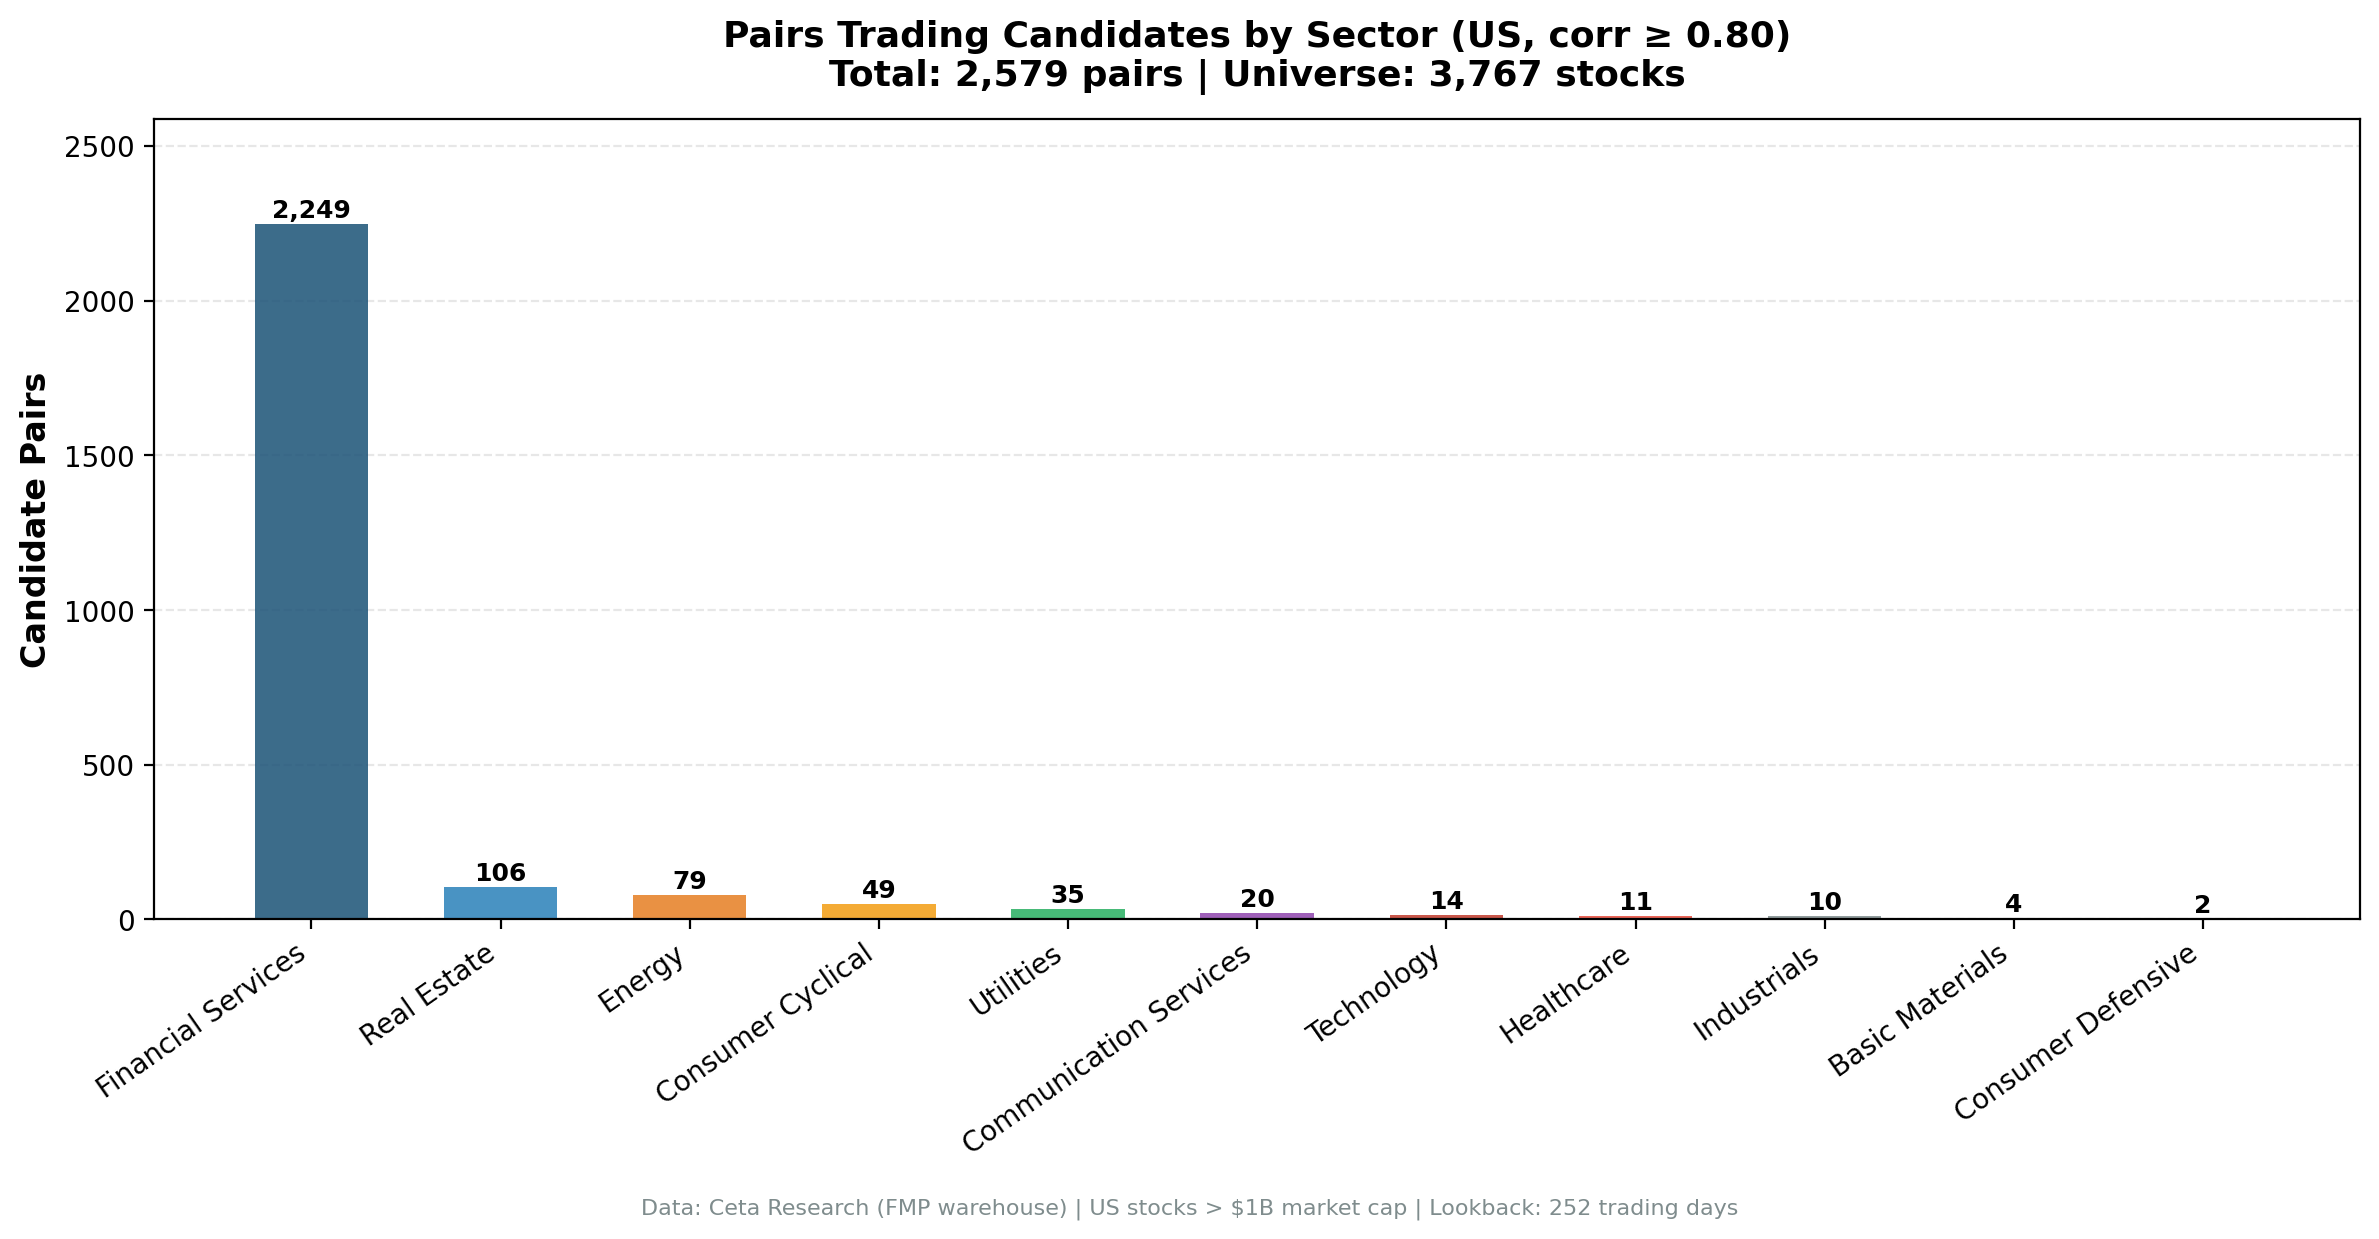
Sector breakdown:
| Sector | Pairs | Share | Avg Corr |
|---|---|---|---|
| Financial Services | 2,249 | 87.2% | 0.829 |
| Real Estate | 106 | 4.1% | 0.842 |
| Energy | 79 | 3.1% | 0.835 |
| Consumer Cyclical | 49 | 1.9% | 0.865 |
| Utilities | 35 | 1.4% | 0.835 |
| Communication Services | 20 | 0.8% | 0.924 |
| Technology | 14 | 0.5% | 0.944 |
| Healthcare | 11 | 0.4% | 0.965 |
| Industrials | 10 | 0.4% | 0.895 |
| Basic Materials | 4 | 0.2% | 0.911 |
| Consumer Defensive | 2 | 0.1% | 1.000 |
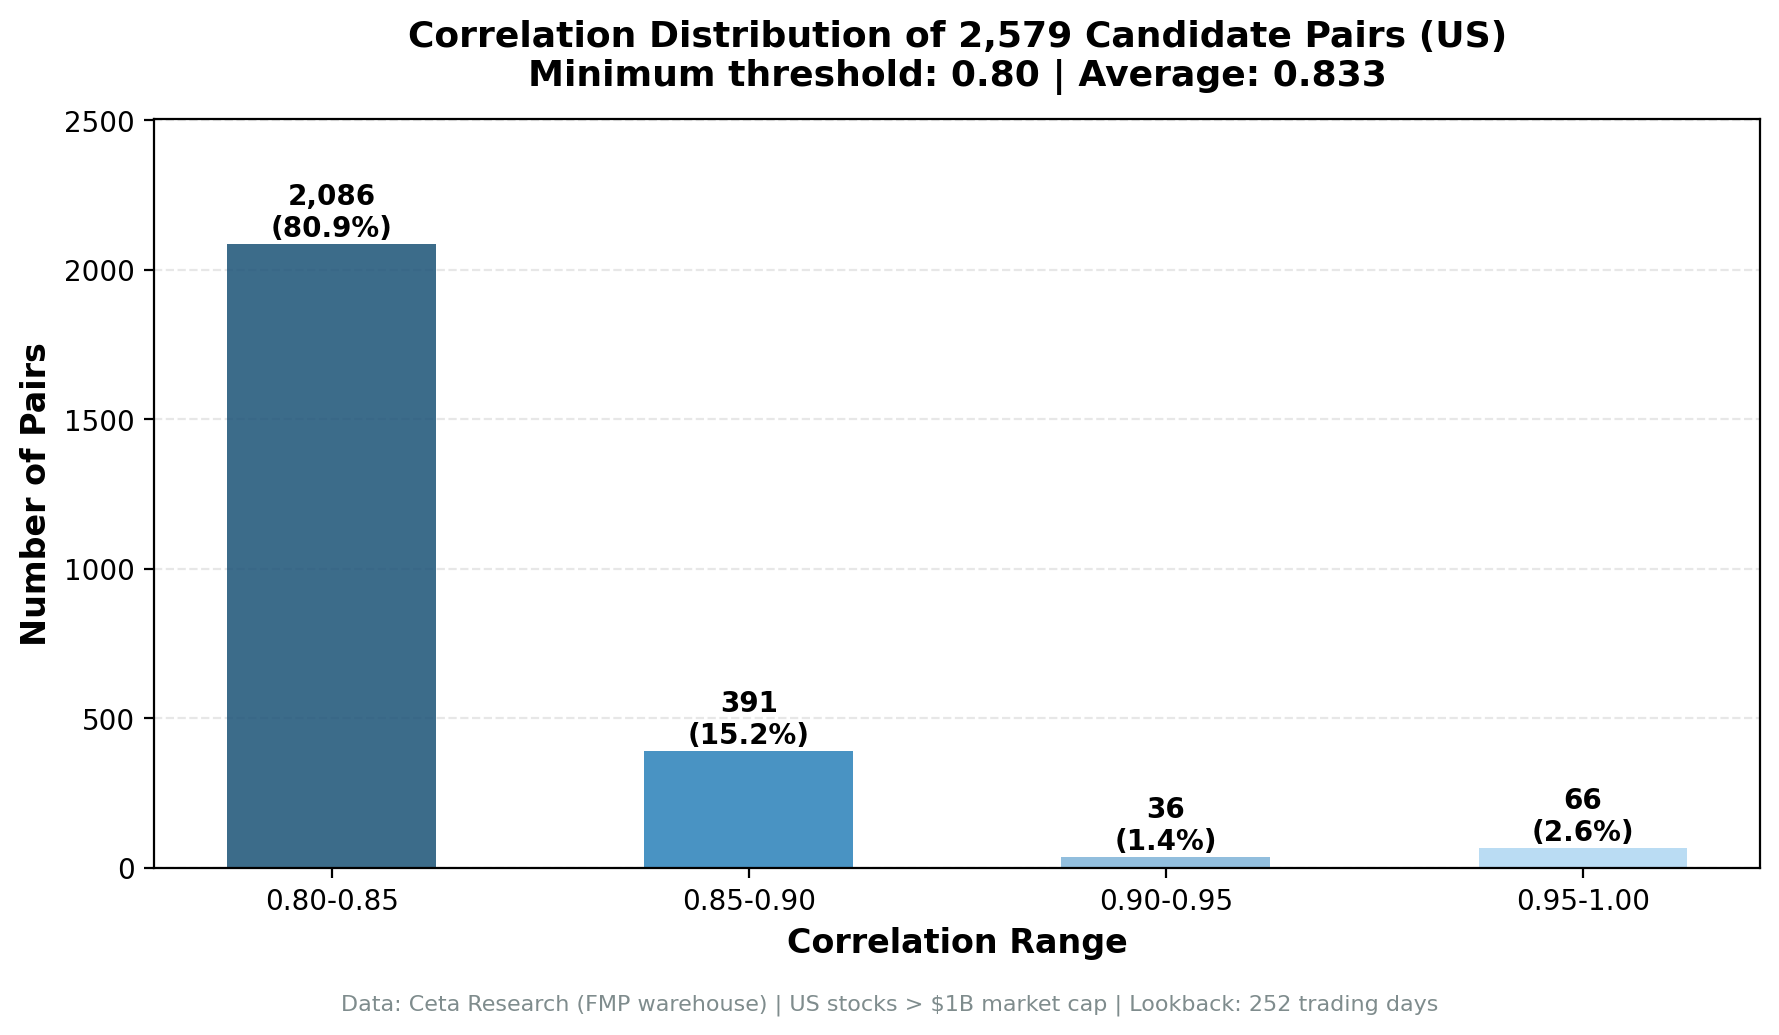
Correlation distribution:
| Range | Count | Share |
|---|---|---|
| 0.80–0.85 | 2,086 | 80.9% |
| 0.85–0.90 | 391 | 15.2% |
| 0.90–0.95 | 36 | 1.4% |
| 0.95–1.00 | 66 | 2.6% |
80% of candidate pairs sit in the 0.80–0.85 range. Only 4% are above 0.90. High-correlation pairs aren't rare because the signal is weak. They're rare because most pairs have different risk exposures.
Why Financial Services Dominates
2,249 of 2,579 pairs (87.2%) come from Financial Services. That concentration isn't a data artifact.
Financial Services is the largest sector by stock count (752 stocks). More stocks means more potential pairs: $n(n-1)/2$ pairs grows quadratically. 752 stocks generate about 282,000 potential same-sector pairs vs 88,000 for the next largest sector.
But the sector size alone doesn't explain the hit rate. Energy has 207 stocks and produces only 79 candidate pairs. Industrials has 436 stocks and produces 10.
The real driver is shared factor exposure. Almost every bank and insurance company has the same dominant risk factor: interest rates. When rates rise, bank net interest margins expand. When rates fall, they contract. This creates sector-wide co-movement regardless of individual business models. A regional bank in Ohio and a global investment bank both react to the same Fed decision.
By contrast, Industrials has aerospace companies, defense contractors, logistics firms, and factory equipment makers. They share a broad "economic cycle" exposure, but their specific drivers diverge. Boeing and FedEx aren't going to correlate at 0.83 on daily returns.
The correlation hierarchy across sectors reflects the strength of their dominant common factors:
- Highest hit rates: Financial Services (interest rates), Utilities (rate sensitivity + regulated returns), Energy (commodity prices), Real Estate (rates + credit)
- Lowest hit rates: Technology (business models too diverse), Healthcare (pharma vs devices vs plans vs biotech)
The Share-Class Problem
Of the 2,579 candidate pairs, 29 have correlation exactly at or above 0.9999. These are share-class variants or corporate restructuring artifacts.
Examples from the data: GOOG/GOOGL (Alphabet A vs C shares), FOX/FOXA (Fox A vs B), CCL/CUK (Carnival dual-listing), GAP/GPS (Gap ticker change), FI/FISV (Fiserv restructuring). Also CHK/EXE (Chesapeake Energy before/after its rename to Expand Energy).
These pairs pass every screening filter. They also have zero trading value. The spread between GOOG and GOOGL never diverges by more than a rounding error. There's no trade.
Before cointegration testing, filter pairs where both symbols map to the same underlying company: - Identical market caps (within 1%) - Same industry + sector - Correlation above 0.999
In our 2,579 candidates, removing these 29 artifacts leaves 2,550 economically distinct pairs.
Run It Yourself
Universe by sector (fast, no correlation computation): Live screen on Ceta Research
Single-sector correlation screen (Energy sector demo):
WITH sector_stocks AS (
 SELECT DISTINCT p.symbol, p.sector, p.industry, m.marketCap
 FROM profile p
 JOIN (
 SELECT symbol, marketCap,
 ROW_NUMBER() OVER (PARTITION BY symbol ORDER BY date DESC) AS rn
 FROM key_metrics WHERE period = 'FY' AND marketCap > 1000000000
 ) m ON p.symbol = m.symbol AND m.rn = 1
 WHERE p.sector = 'Energy' AND p.country = 'US'
 AND p.symbol NOT LIKE '%.%' AND p.symbol NOT LIKE '%-%'
),
daily_ret AS (
 SELECT symbol, CAST(date AS DATE) AS trade_date,
 (adjClose - LAG(adjClose) OVER (PARTITION BY symbol ORDER BY date))
 / NULLIF(LAG(adjClose) OVER (PARTITION BY symbol ORDER BY date), 0) AS ret
 FROM stock_eod
 WHERE symbol IN (SELECT symbol FROM sector_stocks)
 AND date >= '2024-01-01'
)
SELECT
 a.symbol AS symbol_a, b.symbol AS symbol_b,
 ROUND(CORR(a.ret, b.ret), 4) AS correlation,
 COUNT(*) AS common_days
FROM daily_ret a
JOIN daily_ret b ON a.trade_date = b.trade_date AND a.symbol < b.symbol
WHERE a.ret IS NOT NULL AND b.ret IS NOT NULL
GROUP BY a.symbol, b.symbol
HAVING COUNT(*) >= 200 AND CORR(a.ret, b.ret) >= 0.80
ORDER BY correlation DESC
LIMIT 50
The full multi-sector screening script is open source:
git clone https://github.com/ceta-research/backtests.git
cd backtests
# Screen a single sector
python3 pairs-screening/screen.py --sector Energy

# Screen all sectors and save to CSV
python3 pairs-screening/screen.py --global --output results/candidate_pairs.csv
What Comes Next
The 2,550 candidate pairs (after removing share-class artifacts) are inputs to cointegration testing.
Cointegration testing asks a harder question than correlation: do these stocks' prices have a stable long-run equilibrium? A pair can have high return correlation without mean-reverting prices. You need both.
The expected pass rate at Augmented Dickey-Fuller p < 0.05 is roughly 15-25% of screened candidates. That brings the working universe down to 400-600 validated pairs. Then half-life filtering (you want spreads that converge in 5-120 days, not 2 years) cuts it further.
The full funnel:
3,701 US stocks
 → ~884,000 same-sector pairs
 → 2,579 candidates (correlation + fundamental filters)
 → 2,550 economically distinct (remove share-class)
 → ~500 cointegrated pairs (ADF p < 0.05)
 → 50-100 tradeable (half-life 5-120 days)
 → 10-20 active trades (capacity + diversification)
Each stage filters more aggressively. The screening stage is about recall. The cointegration stage is about precision.
Limitations
Correlation is backward-looking. A pair correlated over the past year may not be correlated next year. Structural changes, mergers, business pivots, regulatory shifts, can break relationships permanently. The CHK/EXE 1.000 correlation example is a perfect illustration: it's a company rename, not a stable trading pair.
252-day lookback creates recency bias. Pairs that became highly correlated during unusual market conditions (rate shock, sector rotation) may not persist in normal markets. Check stability across multiple years before committing to a pair.
Share-class inflation. The 29 artifact pairs inflate apparent pair counts in every sector. Consumer Defensive shows 2 candidate pairs, both of which are share-class variants with average correlation of exactly 1.000. The real count is zero.
Sector mapping is approximate. Conglomerates are assigned a primary sector but operate across several. Pairing a diversified industrial with a pure-play manufacturer may not capture actual business overlap.
Liquidity asymmetry. The mktcap ratio filter (< 5x) reduces asymmetric risk but doesn't guarantee comparable liquidity. A $1.5B company and a $7B company can pass the filter while having very different bid-ask spreads and daily volumes.
Correlation isn't cointegration. 91.5% of candidate pairs share the same industry. That strengthens the correlation rationale, but it doesn't mean the spread will mean-revert. Cointegration testing is the next filter, and ~75-85% of correlated pairs will fail it.
Part of the Pairs Trading Masterclass series.
Run It Yourself
Explore the data behind this analysis on Ceta Research. Query our financial data warehouse with SQL, build custom screens, and run your own backtests across 70,000+ stocks on 20 exchanges.
Data: Ceta Research (FMP financial data warehouse). Screening run on US stocks > $1B market cap, most recent 252 trading days, as of February 2026. Full methodology: backtests/METHODOLOGY.md


