Post-Earnings Drift in Canada: A Modest but Real Signal on the TSX
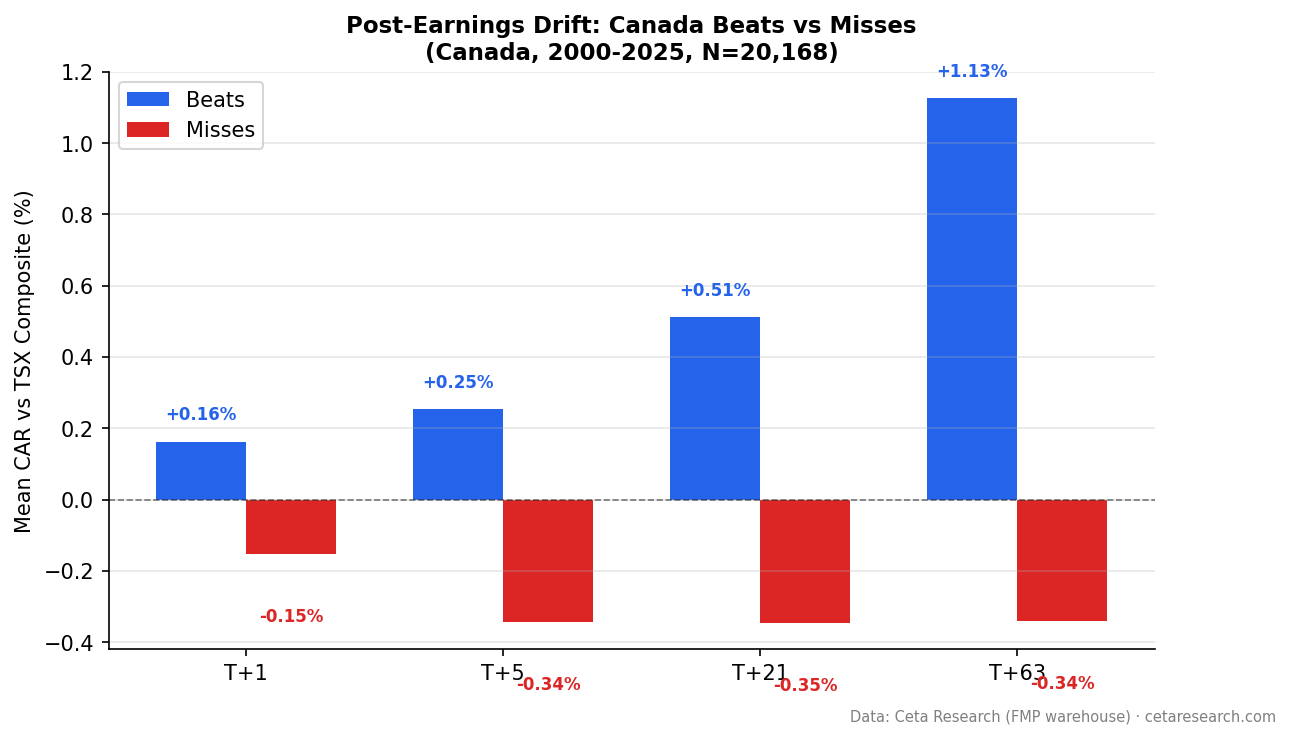
20,168 earnings events on the TSX (2000-2025). Beats drift +1.13% vs TSX Composite at T+63 (t=+6.98). Misses drift -0.34% (t=-1.87, not significant). Q5-Q1 spread: +2.44pp. Next-day close entry.

Canadian stocks drift after earnings surprises, but the effect is smaller than most markets once you benchmark against the local index and use realistic execution.
Contents
We analyzed 20,168 earnings events on the TSX between 2000 and 2025 using next-day close (MOC) entry and the TSX Composite as benchmark. Beats drifted +1.13% at T+63. Misses declined -0.34%, though the miss result is not statistically significant at T+63 (t=-1.87). The Q5-Q1 spread is +2.44 percentage points. The signal is real on the long side but weaker than our earlier ETF-benchmarked numbers suggested.
The Strategy
Post-Earnings Announcement Drift (PEAD) is an event study. We measure Cumulative Abnormal Return (CAR) at fixed windows following an earnings announcement, benchmarked against the local market index.
Signal: Surprise = (epsActual - epsEstimated) / |epsEstimated|
Positive means beat. Negative means miss.
Parameters:
- Universe: TSX, market cap > CAD$500M (historical FY key_metrics)
- Period: 2000-2025 (20,168 events: 9,843 beats, 10,325 misses)
- Benchmark: TSX Composite (^GSPTSE)
- Execution: Next-day close (market-on-close)
- Surprise cap: |surprise| <= 200%
- Winsorized means: 1st/99th percentile
- Event windows: T+1, T+5, T+21, T+63 trading days
Data: Ceta Research (FMP financial data warehouse), earnings_surprises table.
Screen for current TSX earnings surprises:
SELECT es.symbol,
    CAST(es.date AS DATE) AS event_date,
    es.epsActual AS actual_eps,
    es.epsEstimated AS est_eps,
    ROUND((es.epsActual - es.epsEstimated)
        / ABS(NULLIF(es.epsEstimated, 0)) * 100, 1) AS surprise_pct
FROM earnings_surprises es
JOIN profile p ON es.symbol = p.symbol
WHERE p.exchange IN ('TSX')
  AND CAST(es.date AS DATE) >= CURRENT_DATE - INTERVAL '30' DAY
  AND es.epsEstimated IS NOT NULL
  AND ABS(es.epsEstimated) > 0.01
  AND es.epsActual > es.epsEstimated
ORDER BY surprise_pct DESC
LIMIT 30
What We Found
Beats drift significantly. Misses don't, at T+63.
| Category | T+63 | t-stat | Significant? |
|---|---|---|---|
| Beats (9,843 events) | +1.13% | +6.98 | Yes |
| Misses (10,325 events) | -0.34% | -1.87 | No |
The t-statistic for beats at T+63 is +6.98, comfortably significant. For misses, -1.87, which falls short of the 95% threshold (t < -1.96). The beat hit rate is 53.0%. The miss hit rate is 47.7%.
The beat signal is real but more modest than our earlier EWC-benchmarked estimate of +1.80%. Switching to the TSX Composite and next-day close entry absorbs the benchmark gap between TSX-listed stocks and an ETF traded in USD. The miss signal, which looked clean at -0.92% vs EWC, loses statistical significance against the local index.
The quintile structure shows a gradient, but it's not perfectly monotonic.
We sorted all 20,168 events into five groups by surprise magnitude:
| Quintile | CAR at T+63 |
|---|---|
| Q1 (worst misses) | -1.57% |
| Q2 | +0.16% |
| Q3 | +1.13% |
| Q4 | +1.40% |
| Q5 (biggest beats) | +0.88% |
The Q5-Q1 spread is +2.44 percentage points. The gradient from Q1 through Q4 is clean: each step up in surprise produces more positive drift. But Q5 (+0.88%) actually sits below Q3 and Q4, a non-monotonic result at the top end. The largest beats don't produce the largest drift.
Q1 misses at -1.57% still represent a meaningful penalty. The actionable signal on the long side is more in the Q3-Q4 range than at the Q5 extreme.
Canada vs the Global Picture
Across the markets we studied, most show asymmetric PEAD where one side dominates. Canada's beat drift is positive and significant, but the miss signal is weaker than most.
| Market | Beats T+63 | Misses T+63 |
|---|---|---|
| India | +2.89% | -2.28% |
| Canada (TSX) | +1.13% | -0.34% (not sig.) |
| US | -0.40% | -1.96% |
| China (SHZ+SHH) | +1.78% | +0.74% |
| Japan (JPX) | -0.26% | -1.38% |
Canada's beat signal (+1.13%) is moderate. India shows the strongest beat drift at +2.89%. The US and Japan actually show negative or near-zero beat drift with local benchmarks and MOC entry, making Canada's positive beat signal relatively distinctive among developed markets.
The miss signal at -0.34% is not statistically significant, which puts Canada closer to China (where misses also don't produce strong downside drift) than to the US or Japan (where miss penalties are large and significant).
Limitations
Benchmark choice. We use the TSX Composite (^GSPTSE) as benchmark, which is a better match for TSX-listed stocks than our earlier EWC-based analysis. The TSX Composite is cap-weighted and dominated by large-caps, so some size exposure remains for stocks near the CAD$500M threshold.
Sector concentration. The TSX is heavily weighted toward energy, financials, and materials. Sector-specific earnings cycles may create clustering effects that aren't pure PEAD.
Transaction costs. We measure gross abnormal returns. Bid-ask spreads, especially for smaller TSX stocks in earlier years, reduce net capture.
Estimate quality. Analyst coverage thins on smaller TSX names. The "consensus estimate" for a CAD$500M company with 2 analysts covering it is a weaker anchor than for a large-cap with 20 analysts. This may inflate surprise magnitudes in both directions.
Surprise cap. The 200% cap excludes roughly 4-6% of events, particularly those where estimated EPS is near zero.
Takeaway
PEAD on the TSX is real on the beat side. The +1.13% drift at T+63 (t=+6.98) holds up with a local benchmark and next-day close entry. The miss signal (-0.34%, t=-1.87) is not statistically significant at conventional thresholds.
The Q5-Q1 spread of +2.44pp and the Q1 penalty of -1.57% suggest there's still a gradient in how the market prices surprises. But the clean "symmetric" story we told with ETF benchmarks doesn't hold. Canada's PEAD is primarily a long-only signal: buy beats, and the drift is positive.
For Canadian equity investors, the practical question is whether +1.13% gross drift over 63 days justifies the execution costs. The signal is smaller than India (+2.89%) but positive and significant, which is more than the US or Japan can claim for their beat drift with the same methodology.
Data: Ceta Research (FMP financial data warehouse). 20,168 events, TSX, 2000-2025. Abnormal returns computed vs TSX Composite (^GSPTSE) benchmark. Next-day close (MOC) entry. 1st/99th percentile winsorization. Surprise cap 200%. Past performance does not guarantee future results. Educational content only, not investment advice.
References
- Ball, R. & Brown, P. (1968). "An Empirical Evaluation of Accounting Income Numbers." Journal of Accounting Research, 6(2), 159-178.
- Bernard, V. & Thomas, J. (1989). "Post-Earnings-Announcement Drift: Delayed Price Response or Risk Premium?" Journal of Accounting Research, 27(Supplement), 1-36.
- Bernard, V. & Thomas, J. (1990). "Evidence that Stock Prices Do Not Fully Reflect the Implications of Current Earnings for Future Earnings." Journal of Accounting and Economics, 13(4), 305-340.