Post-Earnings Drift in Taiwan: The Miss Penalty Is the Signal
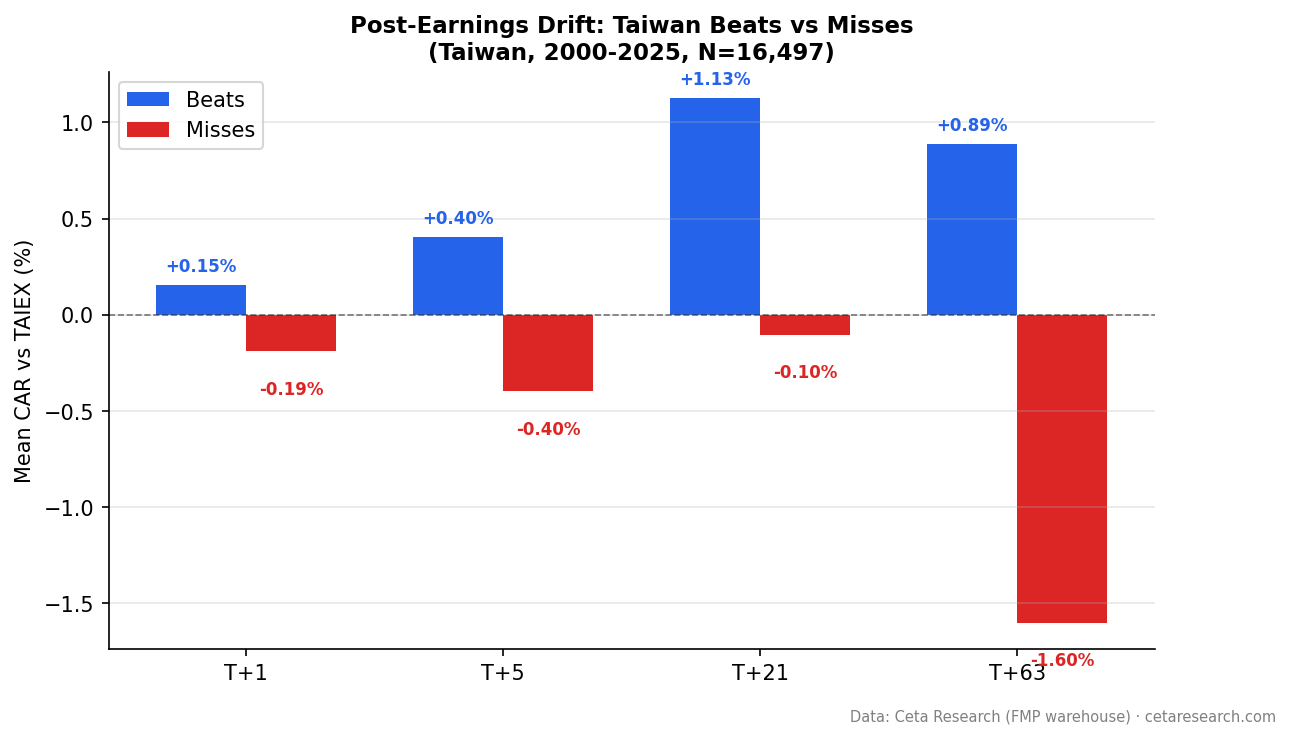
16,497 earnings events on the Taiwan Stock Exchange (2000-2025). Misses drift -1.60% vs TAIEX at T+63 (t=-9.30). Q1 worst misses drop -2.89%. Q5-Q1 spread: +4.37pp, 2nd highest globally. Beats: +0.89% (t=+4.27). Next-day close entry.

Taiwan's PEAD pattern is miss-dominated. Beats drift moderately. Misses get punished hard.
Contents
- The Strategy
- What We Found
- Why Taiwan Punishes Misses Hard
- Taiwan vs China
- Limitations
- Takeaway
- References
We ran 16,497 earnings events on the Taiwan Stock Exchange (TAI) from 2000 to 2025 using next-day close (MOC) entry and TAIEX as benchmark. Misses drifted -1.60% over 63 trading days (t=-9.30). Beats produced +0.89% drift, also significant (t=+4.27). The Q1 (worst misses) quintile dropped -2.89% by T+63. That's where the signal lives.
The Q5-Q1 spread of +4.37pp is the second highest globally, after India (+5.17pp).
The Strategy
Post-Earnings Announcement Drift (PEAD) is an event study. We measure cumulative abnormal returns in the days and weeks after an earnings surprise.
The signal: Surprise = (epsActual - epsEstimated) / |epsEstimated|
Parameters:
- Universe: TAI (Taiwan Stock Exchange), market cap > TWD10B (historical FY)
- Period: 2000-2025 (16,497 events: 7,267 beats, 9,230 misses)
- Benchmark: TAIEX (^TWII)
- Execution: Next-day close (market-on-close)
- Surprise cap: |surprise| <= 200%
- Winsorized means: 1st/99th percentile
- Event windows: T+1, T+5, T+21, T+63 trading days
Data: Ceta Research (FMP financial data warehouse), earnings_surprises table.
Screen for current earnings surprises on Taiwan stocks:
SELECT es.symbol,
    CAST(es.date AS DATE) AS event_date,
    es.epsActual AS actual_eps,
    es.epsEstimated AS est_eps,
    ROUND((es.epsActual - es.epsEstimated)
        / ABS(NULLIF(es.epsEstimated, 0)) * 100, 1) AS surprise_pct
FROM earnings_surprises es
JOIN profile p ON es.symbol = p.symbol
WHERE CAST(es.date AS DATE) >= CURRENT_DATE - INTERVAL '30' DAY
  AND es.epsEstimated IS NOT NULL
  AND ABS(es.epsEstimated) > 0.01
  AND p.exchange = 'TAI'
ORDER BY surprise_pct ASC
LIMIT 30
Note the ORDER BY surprise_pct ASC — Taiwan's signal is strongest on the miss side, so screening for the worst surprises is where attention belongs.
What We Found
Both directions are significant, but misses dominate.
| Category | T+63 | t-stat | Significant? |
|---|---|---|---|
| Beats (7,267 events) | +0.89% | +4.27 | Yes |
| Misses (9,230 events) | -1.60% | -9.30 | Yes |
The beat drift is positive and significant at +0.89% (t=+4.27). That's a real long signal, though more modest than the +1.11% we reported with our earlier benchmark.
The miss drift at -1.60% (t=-9.30) is the main event. Across 9,230 miss events, the downside drift is nearly twice the upside. The t-statistic of -9.30 leaves no doubt this is systematic.
The quintile table shows how concentrated the miss penalty is.
| Quintile | CAR at T+63 |
|---|---|
| Q1 (worst misses) | -2.89% |
| Q2 | -1.30% |
| Q3 | -0.34% |
| Q4 | +0.54% |
| Q5 (biggest beats) | +1.49% |
The Q5-Q1 spread is +4.37 percentage points, the second highest globally after India (+5.17pp). Q1 at -2.89% is one of the strongest miss penalties in the study. Stocks in the worst miss quintile keep declining for three months after reporting.
Notice the shape: Q3 is still negative (-0.34%). Positive drift only starts at Q4. This means the miss signal bleeds into the middle quintiles, not just the extremes.
Beat rates are persistently low.
Of the 16,497 events, only 44.1% are beats. Misses outnumber beats consistently. This matters because the dominant signal type in the data is also the dominant trading signal: avoiding miss stocks.
Why Taiwan Punishes Misses Hard
Several structural factors amplify the miss penalty on TAI.
Semiconductor concentration. Taiwan's stock market is heavily weighted toward technology and semiconductors. TSMC alone represents a substantial fraction of total market cap. The broader tech supply chain includes hundreds of listed companies: foundries, packaging, testing, equipment, materials. These companies have highly visible earnings cycles tied to end-demand (smartphones, PCs, servers). When they miss, it's rarely an isolated event. A miss at one tier often signals demand weakness across the supply chain. The market discounts this quickly and continues discounting it for weeks.
High analyst coverage with tight estimates. Taiwan's semiconductor sector is closely followed by global analysts. Estimates for major companies are precise. A miss isn't just bad relative to a loosely-set consensus; it's bad relative to a well-informed consensus with real information. Larger misses on tight estimates signal genuine demand deterioration, which takes months to fully reprice.
Concentrated institutional ownership. Taiwanese institutional investors and foreign institutional investors (FINI) are significant market participants. Unlike retail-heavy markets where inconsistent behavior mutes drift, institutional holders respond to earnings misses with systematic selling that can persist over multiple weeks.
Export-cycle dynamics. Taiwan's economy is highly export-dependent. Earnings misses often reflect global demand shifts that don't reverse quickly. The downward drift after a miss reflects not just the initial reaction but also subsequent downward estimate revisions as analysts update their models. Estimate revision cascades sustain the drift longer than in more domestically-focused markets.
Taiwan vs China
Taiwan and China are neighboring markets with very different PEAD profiles.
| Metric | Taiwan (TAI) | China (SHZ+SHH) |
|---|---|---|
| Beats T+63 | +0.89% (t=+4.27) | +1.78% (t=+8.18) |
| Misses T+63 | -1.60% (t=-9.30) | +0.74% (t=+4.67) |
| Q1 CAR T+63 | -2.89% | +0.49% |
| Q5 CAR T+63 | +1.49% | +2.52% |
| Q5-Q1 spread | +4.37pp | +2.03pp |
| Dominant signal | Miss penalty | Beat selection |
| Short-sale environment | More accessible | Severely restricted |
China's A-share market shows positive drift for both beats and misses. Every quintile drifts up vs the SSE Composite. Taiwan is the opposite: misses produce real negative drift, and Q1 at -2.89% is one of the harshest miss penalties globally.
Both markets produce positive beat drift, but China's is stronger (+1.78% vs +0.89%). Taiwan's advantage is on the miss side: the -1.60% miss drift is actionable for short strategies in a way that China's +0.74% miss drift is not.
If you're constructing a long/short strategy, Taiwan's data supports both legs. China is long-only by nature: even misses drift positive there.
Limitations
Taiwan data starts mid-study. The yearly stats show meaningful coverage beginning around 2014. Earlier years have sparse event counts. The 2000-2025 frame is used for consistency across the global study, but Taiwan's statistical power comes primarily from post-2014 data.
Sector concentration. Heavy semiconductor representation means the results may be more specific to tech/supply-chain earnings dynamics than to the Taiwan market broadly. A purely non-tech subsample might show different patterns.
Benchmark choice. We use TAIEX (^TWII) as benchmark, which is a better local match than the earlier analysis (which used SPY, despite referencing EWT). TAIEX is cap-weighted and dominated by TSMC and other mega-caps, so some size exposure remains for mid-cap stocks above the TWD10B threshold.
Short-sale constraints in practice. Taiwan allows shorting more freely than China, but securities lending availability varies by stock. The miss penalty is statistically clear in the data; executing it in practice still requires borrowable shares at acceptable rates.
Transaction costs. Gross abnormal returns. Taiwan has a transaction tax (0.3% on stock sales) that directly reduces the net capture from short strategies.
Takeaway
Taiwan's PEAD signal is driven by the miss side. The -2.89% drift for Q1 (worst misses) over 63 trading days is one of the strongest miss penalties globally. The Q5-Q1 spread of +4.37pp is the second highest after India (+5.17pp).
Beats produce real drift too (+0.89% at T+63, t=+4.27), so Taiwan supports a bilateral signal. But the miss penalty is the main event.
The structural story fits. Taiwan's semiconductor-heavy market has tight analyst estimates, visible supply-chain earnings cycles, and a more accessible short market than neighboring China. When companies miss in this environment, the adjustment is sharp and sustained.
The practical edge depends on your ability to short. For long-only investors, the beat signal is modest but real. For anyone who can short, the miss quintile is where Taiwan's data says the signal is clearest.
Data: Ceta Research (FMP financial data warehouse). 16,497 events, TAI (Taiwan Stock Exchange), 2000-2025. Abnormal returns computed vs TAIEX (^TWII) benchmark. Next-day close (MOC) entry. 1st/99th percentile winsorization. Surprise cap 200%. Past performance does not guarantee future results. Educational content only, not investment advice.
References
- Ball, R. & Brown, P. (1968). "An Empirical Evaluation of Accounting Income Numbers." Journal of Accounting Research, 6(2), 159-178.
- Bernard, V. & Thomas, J. (1989). "Post-Earnings-Announcement Drift: Delayed Price Response or Risk Premium?" Journal of Accounting Research, 27(Supplement), 1-36.
- Bernard, V. & Thomas, J. (1990). "Evidence that Stock Prices Do Not Fully Reflect the Implications of Current Earnings for Future Earnings." Journal of Accounting and Economics, 13(4), 305-340.