
Piotroski F-Score in Hong Kong: Massive Spread, Massive Caveats

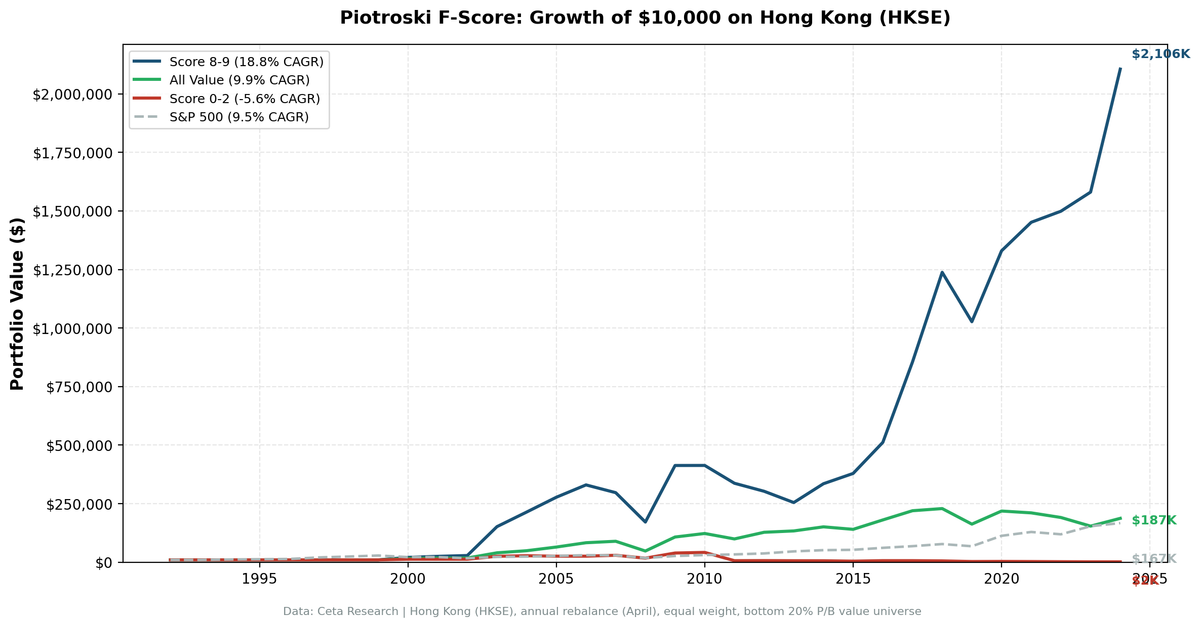
Hong Kong produces the largest Piotroski F-Score spread of any market we tested: +24.5%. Score 8-9 stocks returned 18.8% annually over 31 years. Score 0-2 stocks returned -5.7%. Against the Hang Seng (4.0%), Score 8-9 beats the local market by +14.7%. On the surface, this looks like the strongest validation of the F-Score globally.
Contents
- Method
- What We Found
- The volatility problem
- The years that drive the result
- Alpha decomposition
- Why Hong Kong Is Different
- Should You Trust This Result?
- Part of a Series
- Limitations
It's not. The 83.1% annual volatility tells you this isn't a reliable signal. It's a thin portfolio generating extreme returns from individual stock noise.
Method
Data source: Ceta Research (FMP financial data warehouse) Universe: HKSE-listed stocks, value universe (bottom quintile by price-to-book), market cap above local threshold Time period: 31 years (1994-2025) Rebalancing: Annual (April, after annual reports) Execution: Next-day close (MOC) Benchmarks: All value stocks (same universe, unfiltered), Hang Seng Avg holdings post-2010: 12.8 stocks per year
Same methodology as our US study.
What We Found

| Portfolio | CAGR | Volatility | Sharpe Ratio | Max Drawdown |
|---|---|---|---|---|
| Score 8-9 | 18.8% | 83.1% | 0.190 | -44.4% |
| Score 0-2 | -5.7% | n/a | n/a | n/a |
| All value stocks | 9.6% | n/a | n/a | n/a |
| Hang Seng | 4.0% | n/a | n/a | n/a |
The 18.8% CAGR is the highest Score 8-9 return of any market in our study. The -5.7% for Score 0-2 is the lowest. The +24.5% spread dwarfs every other exchange. Hong Kong also has the strongest selection alpha (+9.2%) and avoidance alpha (+15.3%) of any market.
These numbers are real. But they need heavy qualification.
The volatility problem
83.1% annual volatility is not a normal portfolio characteristic. For context, the US Score 8-9 portfolio runs at 19.2% vol. Japan at 25.6%. Hong Kong's is more than 3x the US level.
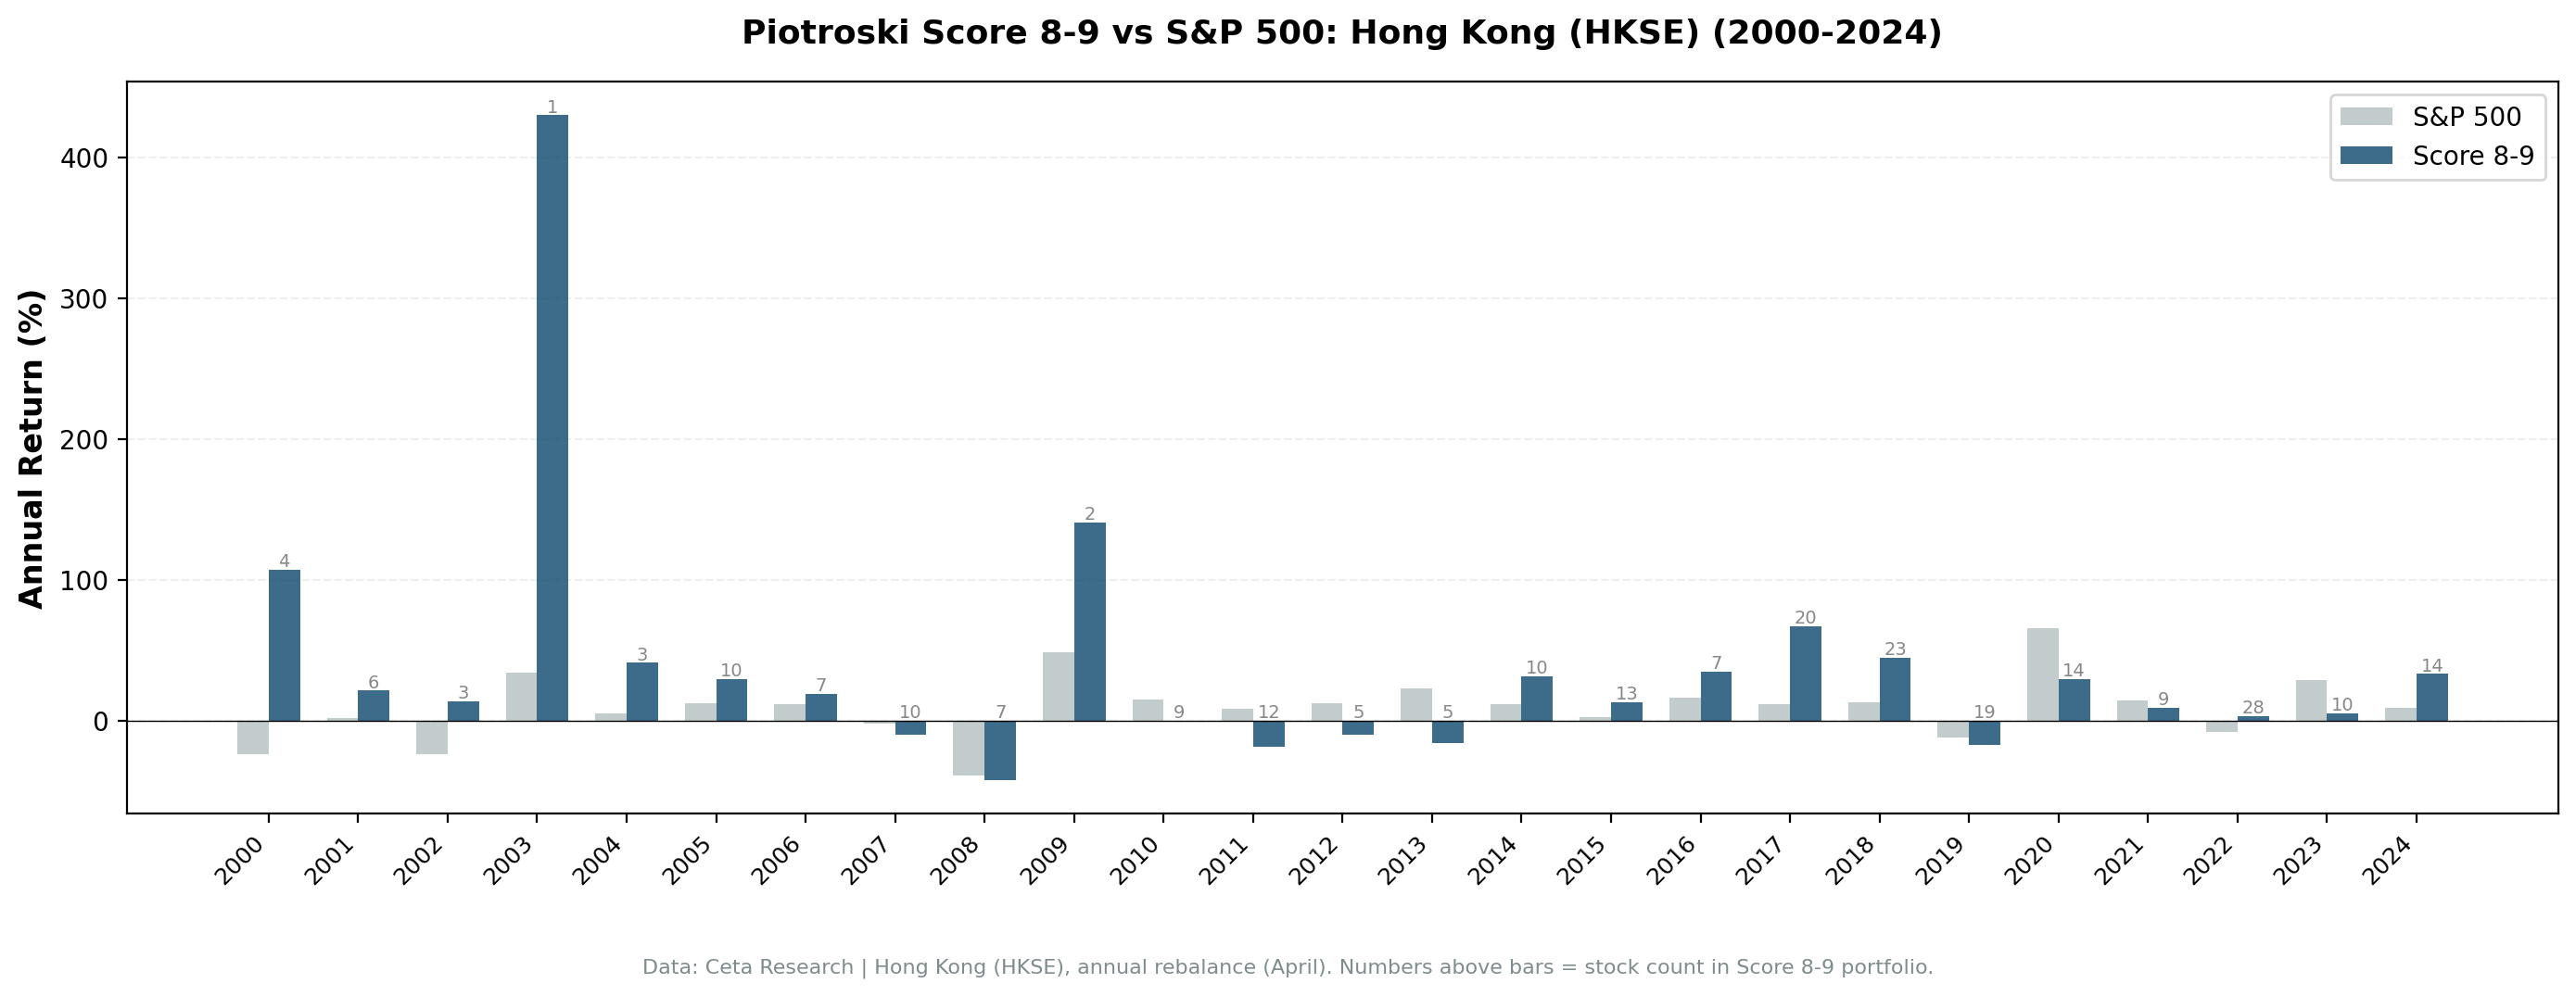
This kind of volatility comes from concentration in a handful of stocks. With 12.8 average holdings post-2010, one or two extreme movers can dominate an entire year's returns.
The years that drive the result
Two years illustrate the problem:
2006: +706.9% return from 14 stocks. One calendar year, seven-fold gains. This is almost certainly driven by a small number of companies in the portfolio experiencing extraordinary re-ratings. No diversified strategy produces +707% in a single year.
2009: +410.3% return from 4 stocks. Four stocks. The entire annual return for the Score 8-9 portfolio rested on the performance of four names coming out of the global financial crisis.
Remove these two years and the CAGR drops substantially. The point isn't that the data is wrong. It's that the result is driven by individual stock outcomes in a thin portfolio, not by a systematic quality signal.
Alpha decomposition
- Selection alpha: +9.2% per year (Score 8-9 vs All value)
- Avoidance alpha: +15.3% per year (All value vs Score 0-2)
Both signals are positive and large. Score 0-2 stocks returned -5.7% annually. That's 31 years of negative compounding. Hong Kong's low-scoring value stocks aren't just underperformers. They're consistent capital destroyers, worse even than Australia's -0.7%.
The avoidance signal is more trustworthy than the selection signal because it draws from a wider pool. Many more stocks score 0-2 than score 8-9, reducing the concentration problem.
Why Hong Kong Is Different
Hong Kong's market structure amplifies these effects.
Small-cap value concentration. HKSE has many small-cap companies with thin float and limited analyst coverage. Value stocks (bottom P/B quintile) on HKSE include micro-caps that can move 50-100% on a single catalyst. When the F-Score selects 12 of these names, portfolio returns become a function of individual stock luck.
China exposure. Many HKSE-listed companies derive revenue from mainland China. Mainland economic policy shifts create correlated moves across the portfolio that aren't captured by company-level financial statement analysis.
Ownership structure. Family-controlled companies are common on HKSE. These can have financial statements that look strong by F-Score criteria (declining debt, improving margins, no dilution) but limited upside for minority shareholders due to related-party transactions and non-arm's-length decisions.
Should You Trust This Result?
The positive spread is real in the data. But a Sharpe ratio of 0.190 on 83.1% vol means the signal-to-noise ratio is poor. The F-Score "works" in Hong Kong in the same way a lottery ticket "works" when you happen to pick the right numbers.
The avoidance signal is more actionable. Filtering out Score 0-2 stocks from any Hong Kong value strategy removes a consistently negative-returning segment. That's useful regardless of what you do with the rest of the portfolio.
For the selection signal, you'd want to see similar results with lower volatility and deeper portfolios before relying on it. Adding minimum liquidity filters or market cap floors would likely reduce both the returns and the volatility, producing a more realistic picture.
Part of a Series
This is one of several regional Piotroski F-Score studies. The US analysis covers 32 years with more stable results: Piotroski F-Score: 32 Years of Data on a 9-Point Quality Checklist.
Hong Kong's +24.5% spread is the highest of any market, but also the least reliable. See our global comparison for context on how volatility and sample size affect the signal across nine exchanges.
Limitations
Extreme concentration. 12.8 stocks per year post-2010 with 83.1% volatility means individual names dominate. Results are not statistically stable.
Outlier years. 2006 (+706.9%) and 2009 (+410.3%) contribute disproportionately to cumulative returns. The CAGR is sensitive to whether these years are included.
HKD-denominated returns. Returns are in local currency. HKD is pegged to USD, so currency effects are minimal for US-based investors.
Data quality for small-caps. Micro-cap HKSE stocks may have less reliable financial statement data, particularly in earlier periods.
No liquidity filter. The study doesn't control for trading volume. Some qualifying stocks may be practically untradeable at the portfolio sizes implied by the backtest.
Data: Ceta Research, FMP financial data. HKSE, 31 years, annual rebalance, equal weight, value universe (bottom P/B quintile). Past performance does not guarantee future results. Educational content only, not investment advice.


