
Piotroski F-Score in Japan: The Avoidance Signal Carries the Weight

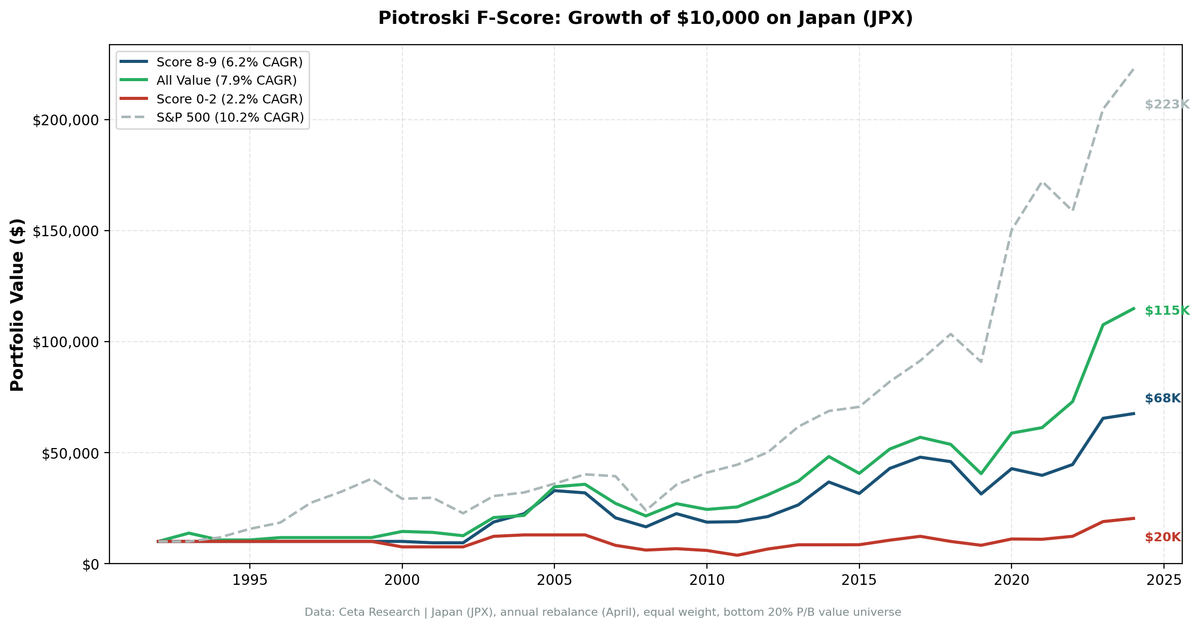
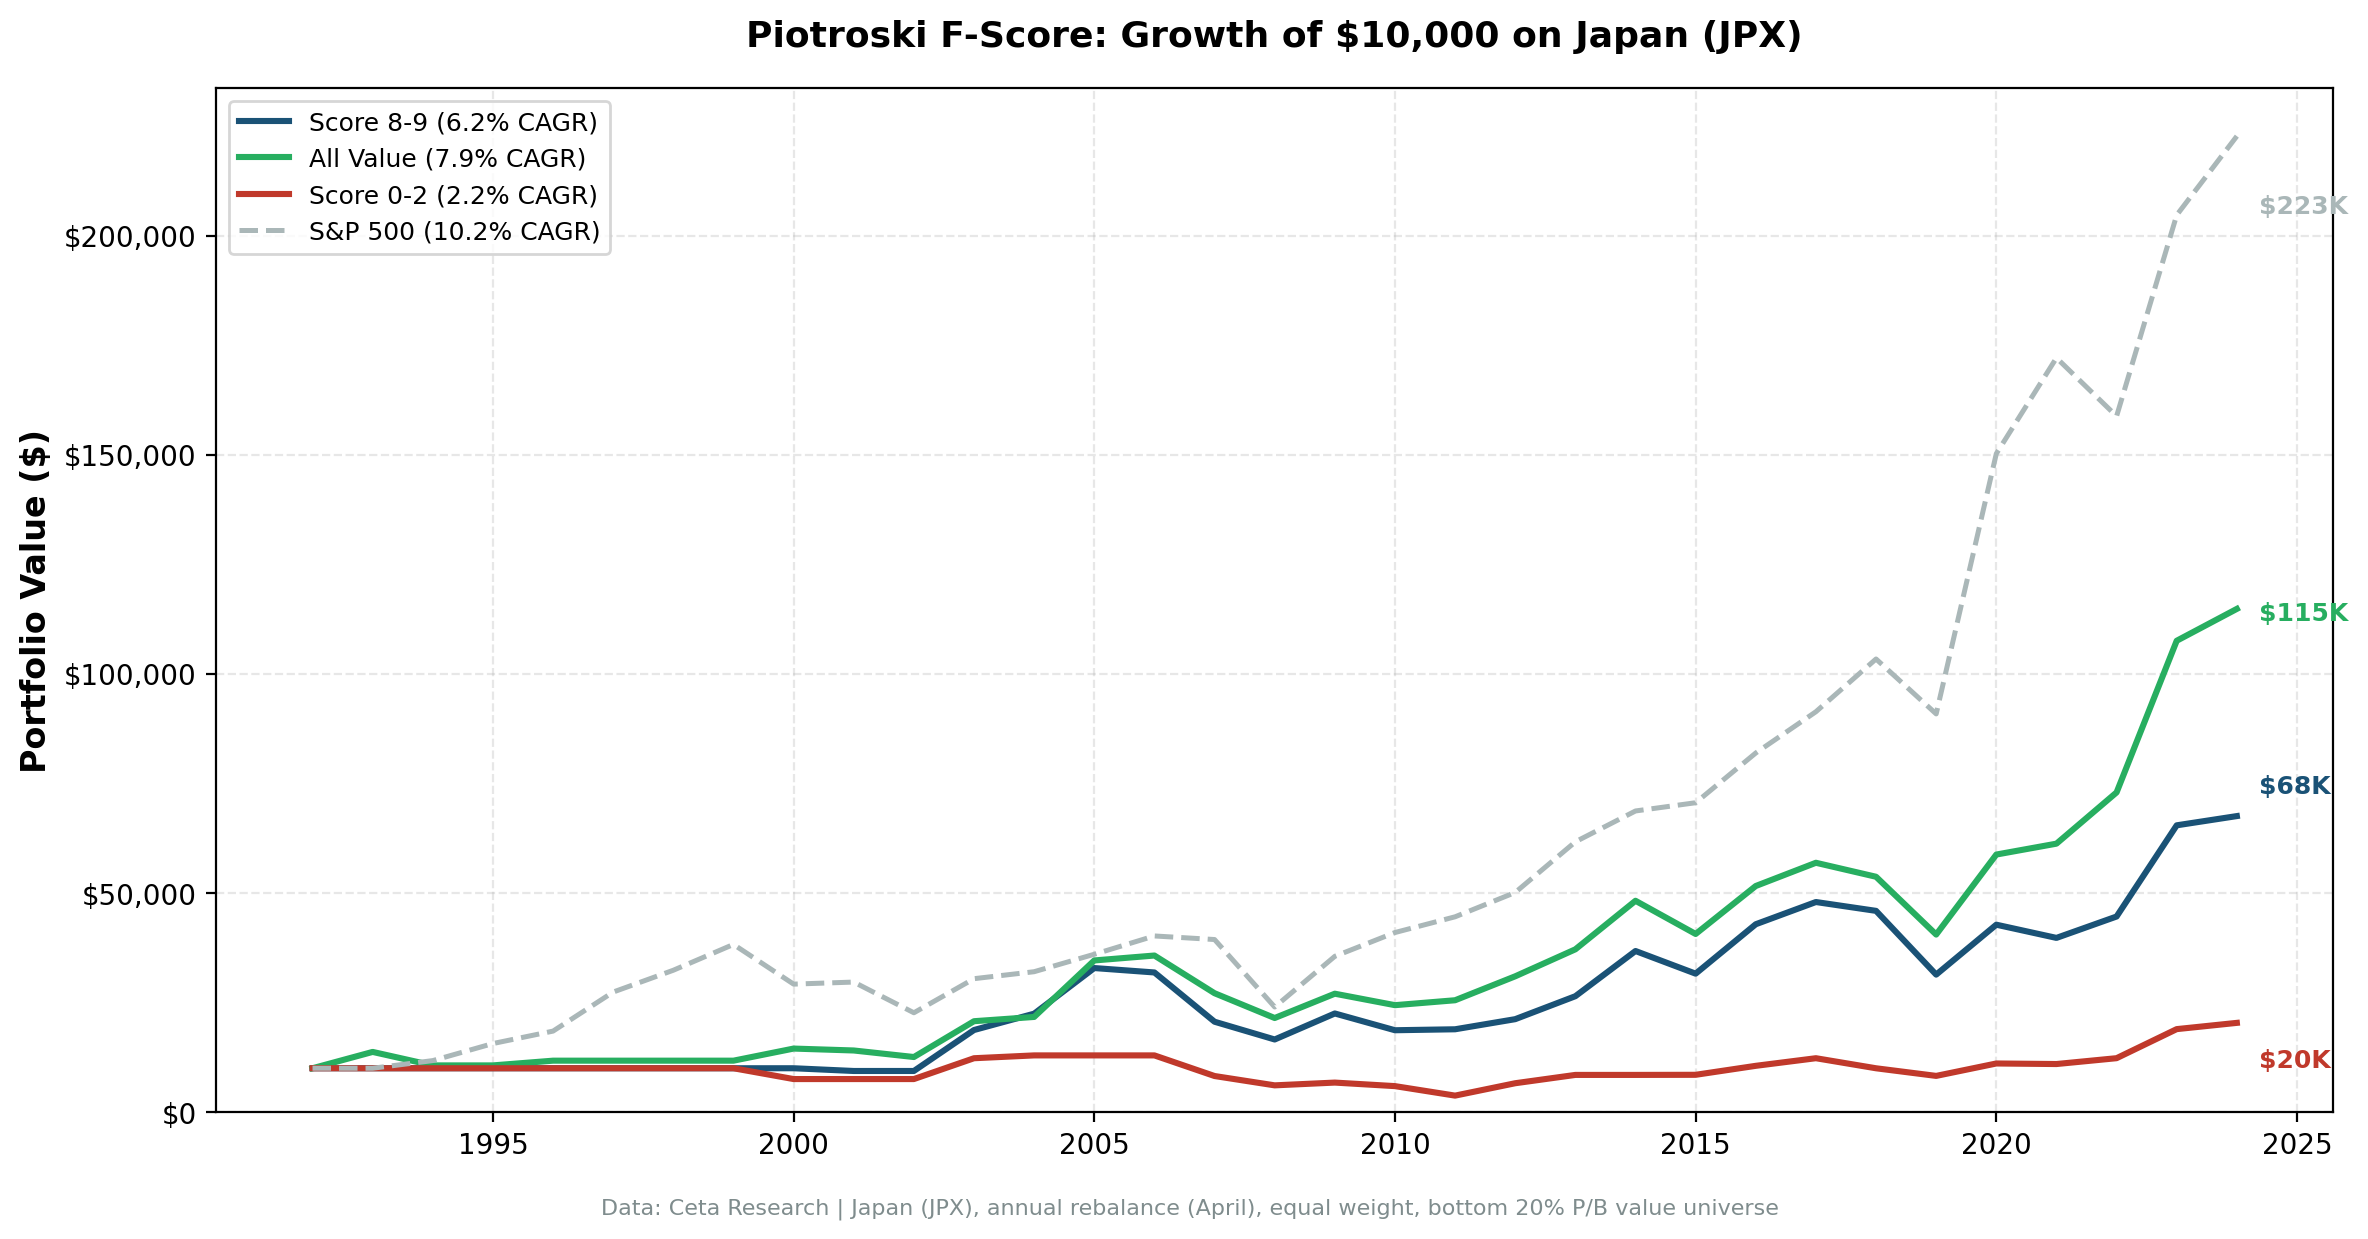
Japan's Piotroski F-Score tells a familiar story with an important twist. High-scoring value stocks (8-9) returned 5.1% annually over 32 years, beating the Nikkei 225 (0.7%) by +4.4%. Low-scoring stocks (0-2) returned 3.5%. That's a +1.6% spread. But the real finding is where the alpha comes from: almost all of it is avoidance. Buying high-scorers actually underperformed the broad value universe by 2.6% per year. Avoiding low-scorers saved you 4.2% per year.
Contents
- Method
- What We Found
- Alpha decomposition
- Why avoidance matters more on JPX
- When F-Score Works on JPX
- Part of a Series
- Limitations
The F-Score on JPX is a filter, not a stock picker. But against the local market, it delivers clear alpha.
Method
Data source: Ceta Research (FMP financial data warehouse) Universe: JPX-listed stocks, value universe (bottom quintile by price-to-book), market cap above local threshold Time period: 32 years (1993-2025) Rebalancing: Annual (April, after annual reports) Execution: Next-day close (MOC) Benchmarks: All value stocks (same universe, unfiltered), Nikkei 225 Avg holdings post-2010: 20.5 stocks per year
Piotroski scores computed from raw financial statements at each rebalance date. Nine binary signals covering profitability, leverage, and operating efficiency. Same methodology as our US study.
What We Found
| Portfolio | CAGR | Volatility | Sharpe Ratio | Max Drawdown |
|---|---|---|---|---|
| Score 8-9 | 5.1% | 25.6% | 0.195 | -49.6% |
| Score 0-2 | 3.5% | 25.9% | n/a | n/a |
| All value stocks | 7.7% | n/a | n/a | n/a |
| Nikkei 225 | 0.7% | n/a | n/a | n/a |
The spread between high and low scores is +1.6 percentage points per year. That's modest over 32 years. But look at the "All value stocks" line: 7.7% CAGR, beating the Score 8-9 portfolio by 2.6%.
This means high-scoring stocks didn't actually beat the value universe. The F-Score's value in Japan comes entirely from telling you what to avoid. But measured against the Nikkei 225, Score 8-9 outperformed the local market by +4.4% per year. That's genuine alpha vs the benchmark that matters for Japanese investors.
Alpha decomposition
- Selection alpha: -2.6% per year (Score 8-9 vs All value)
- Avoidance alpha: +4.2% per year (All value vs Score 0-2)
The avoidance signal dominates. Score 0-2 stocks in Japan are the classic value traps: statistically cheap, fundamentally deteriorating. Filtering them out of any value screen would have saved substantial capital over three decades.
Why avoidance matters more on JPX
Japanese value stocks have a unique structural challenge. The market has spent decades in a low-growth, low-inflation environment. Many companies trade at low price-to-book ratios not because they're temporarily depressed, but because they've been cheap for years. In this context, the F-Score's profitability and efficiency signals are better at flagging deterioration than improvement. A company that fails on cash flow, debt, and margin criteria in Japan is more likely trapped than recovering.
Both groups run at similar volatility (25.6% vs 25.9%), but Score 0-2 stocks deliver lower returns for that risk.
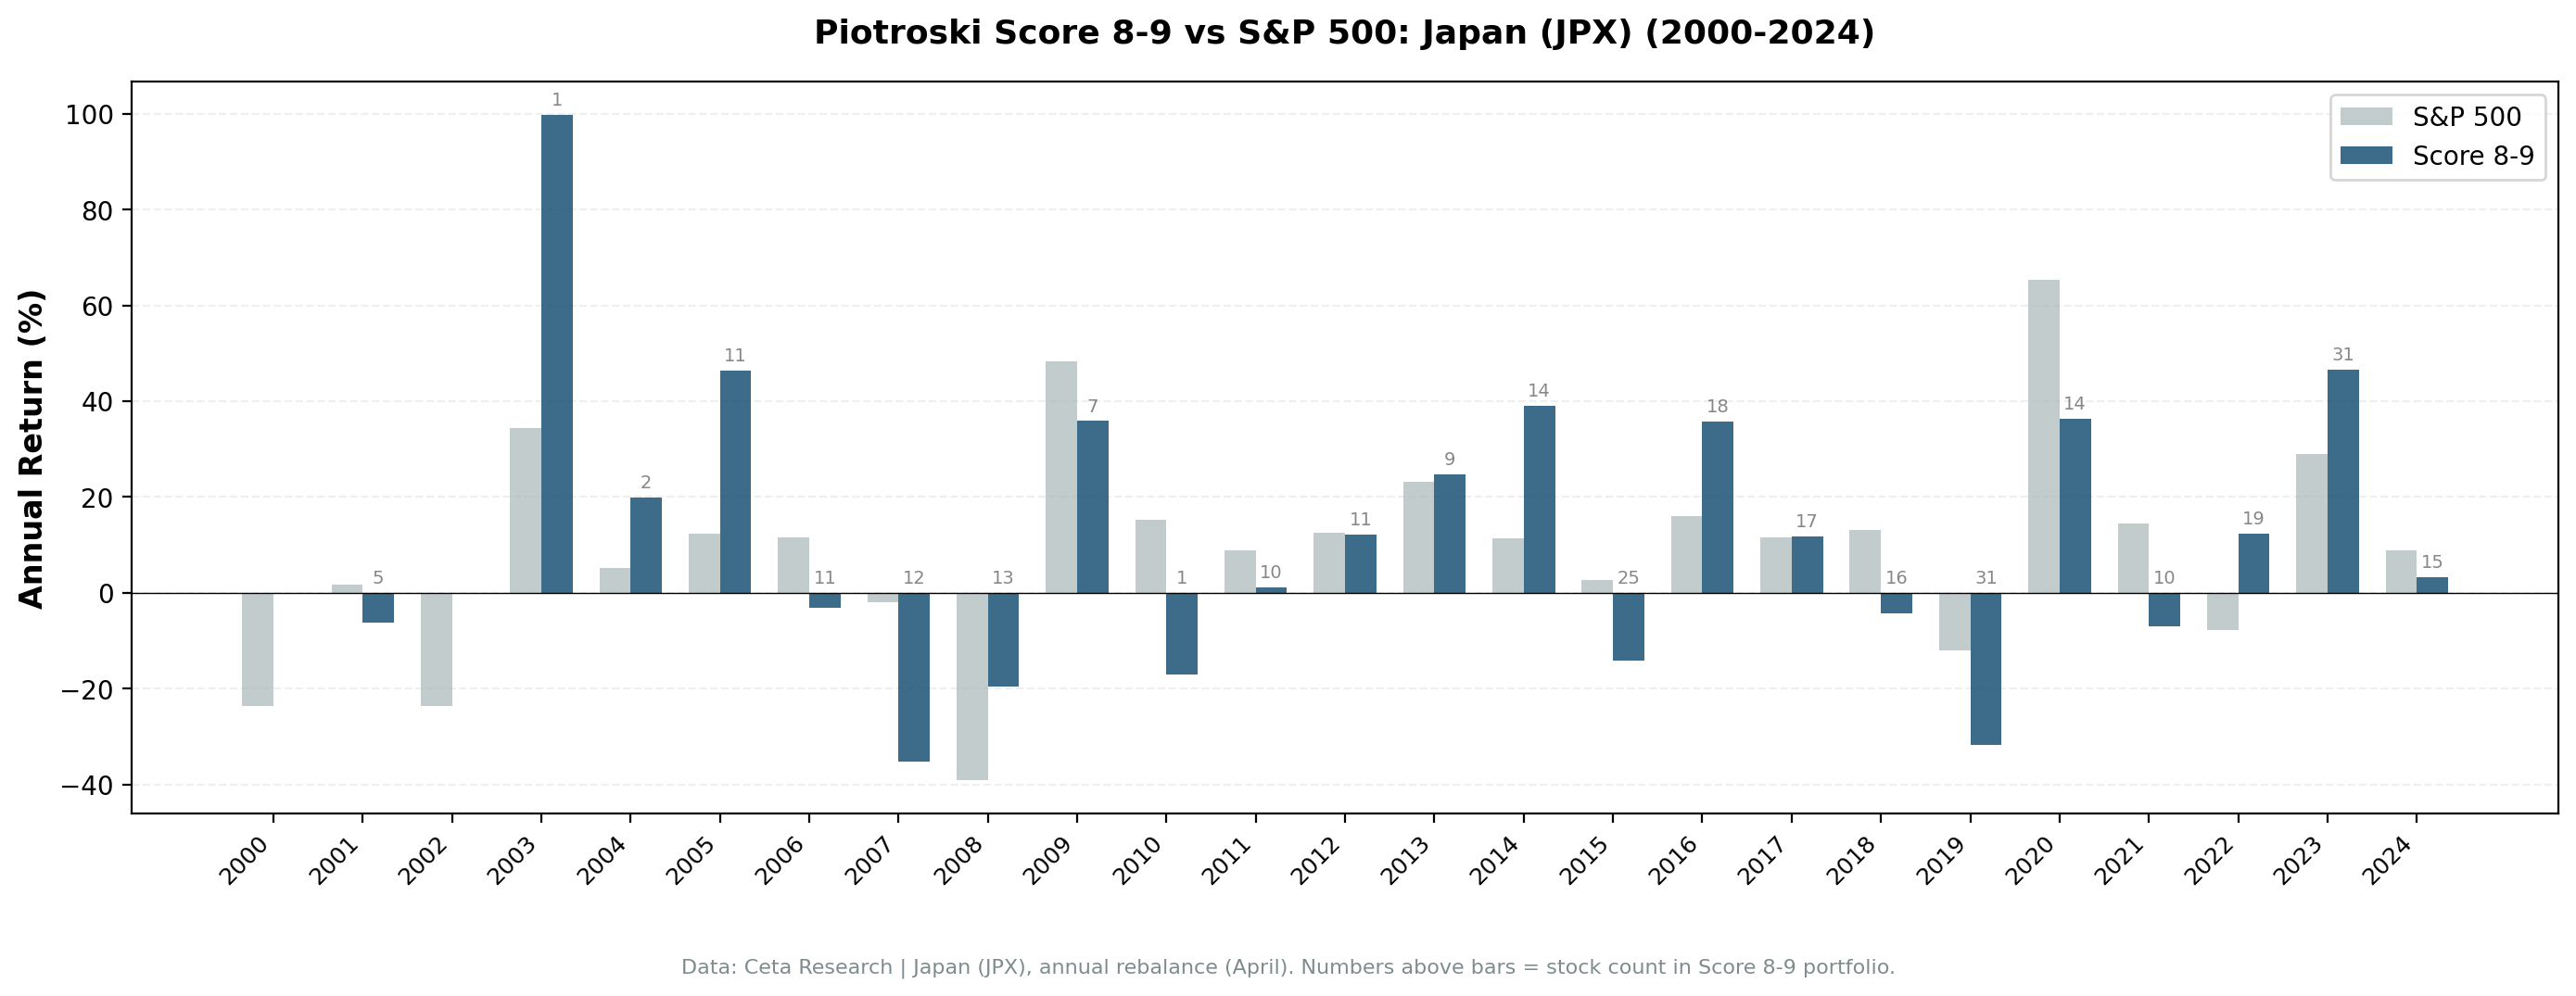
When F-Score Works on JPX
The score's avoidance signal is strongest during Japan's periodic banking and deflation crises. Weak balance sheets (rising debt, declining margins, dilutive issuance) compound during these periods. Removing those stocks from a value portfolio acts as a quality floor.
The selection signal is weaker because Japan's value universe includes many companies with stable but low growth. Passing all nine tests doesn't guarantee repricing upward. It just means the fundamentals aren't getting worse. In a market where "not getting worse" is the norm for half the value universe, the signal gets diluted.
Part of a Series
This is one of several regional Piotroski F-Score studies. The US analysis covers 32 years and 10,222 stocks: Piotroski F-Score: 32 Years of Data on a 9-Point Quality Checklist.
The F-Score spread varies dramatically by market. Japan's +1.6% is modest. Other exchanges range from -6.7% (India) to +24.5% (Hong Kong). See our global comparison for the full picture.
Limitations
JPY-denominated returns. All returns are in local currency. For international investors, yen depreciation (especially 2012-2024) affects realized returns in home currency.
Value universe definition. Bottom quintile by P/B on JPX includes many companies that have been "cheap" for decades. This is a structural feature of the Japanese market, not a temporary dislocation.
Post-2010 sample. Average holdings of 20.5 stocks post-2010 is adequate but not deep. Earlier periods may have thinner coverage due to FMP data availability for JPX.
No sector balancing. The screen doesn't control for sector concentration. Japan's value universe skews heavily toward financials and industrials.
Data: Ceta Research, FMP financial data. JPX, 32 years, annual rebalance, equal weight, value universe (bottom P/B quintile). Past performance does not guarantee future results. Educational content only, not investment advice.


