Pre-Earnings Runup in Japan: The Effect Disappears Against the Nikkei

Japanese stocks don't drift upward before earnings announcements. Not when you measure against the right benchmark.
Contents
- Why the Benchmark Matters
- Method
- Results
- What Changed From the Original Analysis
- What This Means
- Limitations
- Takeaway
Our original analysis showed a +0.114% pre-earnings drift at T-10 (t=2.77), benchmarked against EWJ (iShares MSCI Japan ETF). That finding was statistically significant and suggested a modest but real pre-earnings premium in Japan. We were wrong about the benchmark, and that changes the conclusion.
When we switch to the Nikkei 225 as the benchmark, the local index that trades on the same calendar and in the same currency as the stocks being measured, the overall T-10 CAR drops to -0.014% (t=-0.36). Not significant. Not positive. The pre-earnings runup in Japan doesn't exist against its local market.
Why the Benchmark Matters
EWJ is a US-listed ETF that tracks Japanese equities. It trades on NYSE hours, settles in USD, and follows the US holiday calendar. Using EWJ as the benchmark for a JPX event study introduces three problems.
First, the trading calendar mismatch. When the code counts "10 trading days before earnings," it was counting NYSE trading days, not JPX trading days. Japanese holidays and US holidays don't overlap. The T-10 window was measuring a slightly different period than intended.
Second, currency effects. EWJ returns reflect both Japanese equity performance and JPY/USD exchange rate movements. Any yen weakness during the pre-earnings window shows up as artificial positive CAR when benchmarked against a USD-denominated ETF.
Third, tracking error. EWJ has an expense ratio, NAV premiums/discounts, and doesn't perfectly replicate the JPX universe. These small differences compound over 15,216 events.
The Nikkei 225 eliminates all three issues. It trades on JPX, in yen, on the same calendar as the stocks being studied.
Method
Universe: JPX-listed stocks with exchange-specific market cap filter and at least 4 prior earnings reports with analyst estimates. Period: Effective coverage 2017-2025. Benchmark: Nikkei 225 (cumulative abnormal return). Events: 15,216 earnings announcements. Beat-rate categories: Habitual beater (>75% beat rate, 8+ quarters), mixed (25-75%), habitual misser (<25%). Winsorization: 1st/99th percentile.
Results
| Category | T-10 CAR | t-stat | T-5 CAR | T-1 CAR | T+1 CAR | N |
|---|---|---|---|---|---|---|
| Overall | -0.014% | -0.36 | +0.043% | +0.039%* | -0.090%* | 15,216 |
| Mixed | -0.024% | -0.58 | +0.034% | +0.038% | -0.071% | 13,357 |
| Habitual Beater | +0.130% | 1.19 | +0.108% | +0.039% | -0.171% | 1,620 |
| Habitual Misser | -0.410% | -1.40 | +0.140% | +0.064% | -0.622% | 239 |
*T-1 overall significant at p<0.05. T+1 overall significant (t=-2.13).

What Changed From the Original Analysis
| Metric | Old (vs EWJ) | New (vs Nikkei 225) |
|---|---|---|
| Overall T-10 | +0.114% (t=2.77**) | -0.014% (t=-0.36) |
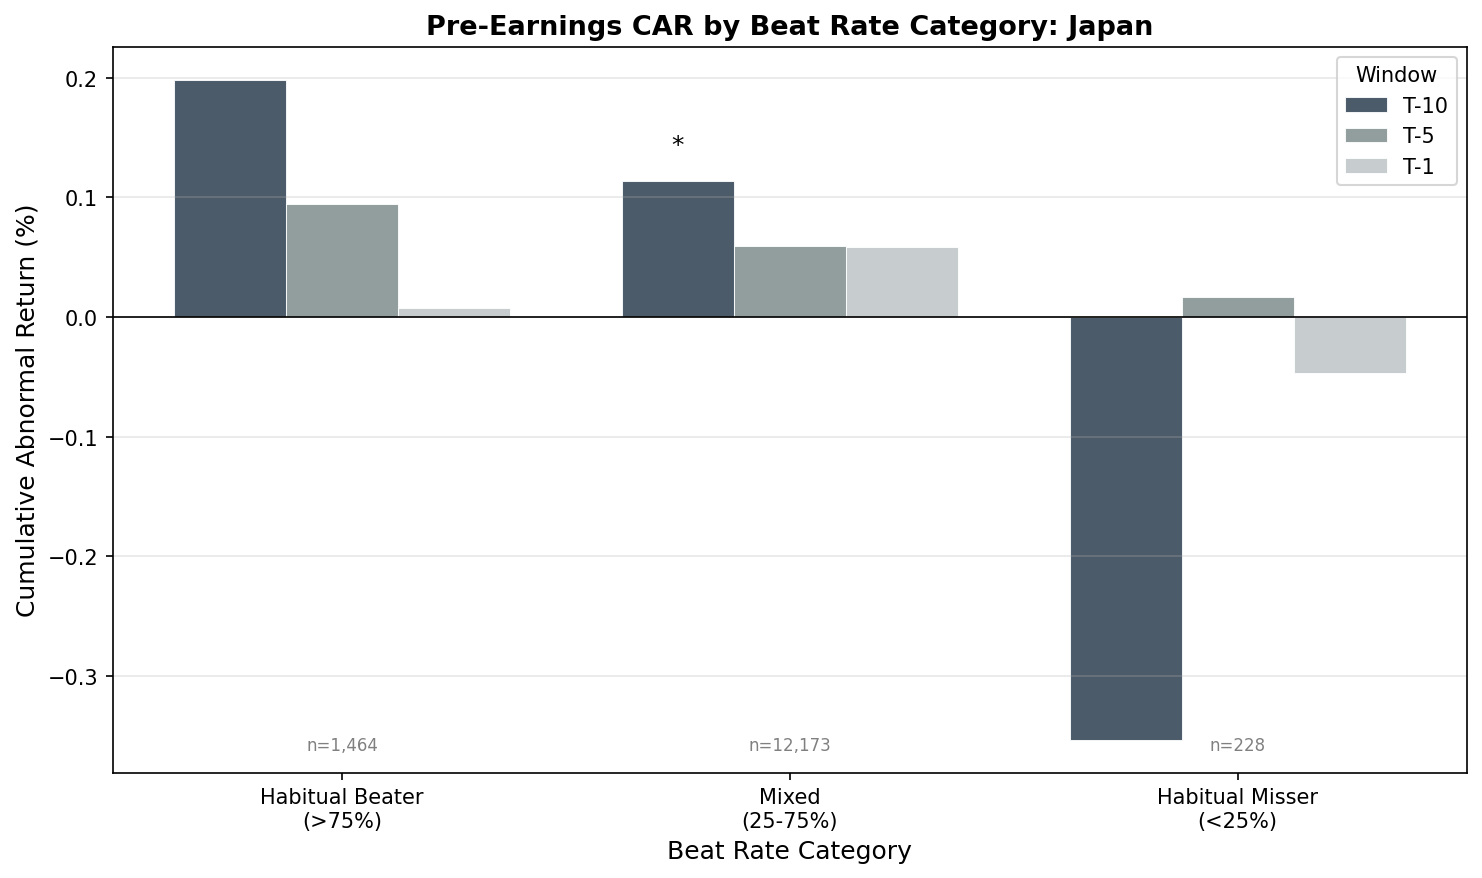
| Beater T-10 | +0.199% (t=1.70) | +0.130% (t=1.19) |
| Mixed T-10 | +0.113% (t=2.55**) | -0.024% (t=-0.58) |
| Misser T-10 | -0.353% (t=-1.26) | -0.410% (t=-1.40) |
The overall effect went from significant to zero. The mixed cohort, which drove the original result, lost all significance. Habitual beaters still show a directional positive (+0.130%) but don't reach significance with 1,620 events.
The only window that survives is T-1 (one day before), where the overall CAR is +0.039% (t=2.12). That's a very small effect concentrated in the final trading day before earnings.
What This Means
The "pre-earnings runup in Japan" was largely an artifact of benchmarking against a USD-denominated ETF that trades on a different calendar. When measured properly against the Nikkei 225:
- There is no statistically significant pre-earnings drift at T-10 or T-5 in Japan
- Beat rate doesn't predict pre-earnings behavior in Japanese equities
- The only detectable signal is a tiny T-1 effect (+0.039%), possibly reflecting last-day positioning
This is a useful negative result. It tells us that the mechanisms driving the US pre-earnings premium (informed positioning, options hedging, beat-rate pricing) either don't operate in Japan or are too small to detect across 15,216 events over 8 years.
Japan's conservative guidance culture, cross-shareholding structures, and lower single-stock options activity likely suppress the pre-earnings drift that appears in the US. The market has less incentive to pre-position based on beat histories when the norm is conservative guidance across the board.
Limitations
The Nikkei 225 is a price-weighted index of 225 large-cap stocks. It doesn't perfectly represent the broader JPX universe. A TOPIX or equal-weighted JPX benchmark might produce slightly different results, though the direction of the change (less positive) would be the same.
Event counts before 2017 are sparse. The 8-year window covers one full cycle but not the longer history available for US equities.
The habitual misser cohort (n=239) is too small for reliable inference. The -0.410% figure is directionally interesting but statistically noisy.
Takeaway
Japan does not have a meaningful pre-earnings drift when measured against its local index. The original +0.114% result was an artifact of the EWJ benchmark. Against the Nikkei 225, the T-10 CAR is -0.014% with a t-stat of -0.36.
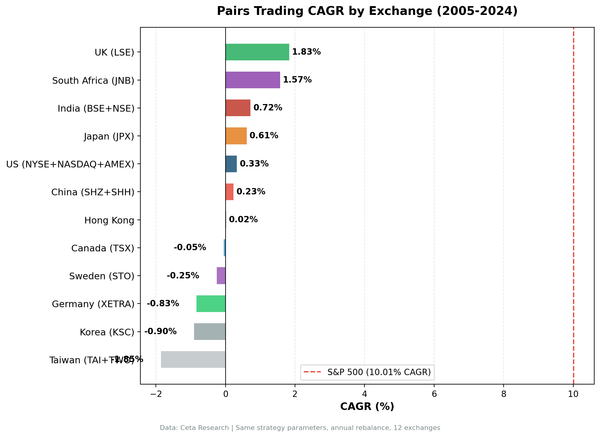
This matters for global pre-earnings strategies. Japan was previously ranked as having a "modest but significant" effect. It doesn't. If you're screening for pre-earnings opportunities across global markets, Japan should be excluded or treated as neutral.
The honest conclusion: the pre-earnings runup is not universal. It works in the US, Korea, and India. It doesn't work in Japan.
Data: Ceta Research (FMP financial data). Event study: earnings_surprises + stock_eod + key_metrics tables. Benchmark: Nikkei 225 (local currency index). Winsorized at 1%/99%. ~2017-2025 effective coverage. This is educational content, not investment advice.