Pre-Earnings Runup: 25 Years of US Data Shows Beat Rate Matters

Habitual earnings beaters drift +0.266% above the S&P 500 in the 10 trading days before they announce. Habitual missers fall -0.479%. That's a 74bp spread between two groups of stocks, both approaching the same event, in the same market, over the same window.
Contents
- Method
- What We Found
- The Beat Rate Effect
- Academic Evidence
- Why the Runup Happens
- Screening for Pre-Earnings Opportunities
- Limitations
- Takeaway
- References
The overall effect is real but modest: +0.067% at T-10, statistically significant across 163,661 events. But the overall number obscures the real story. The pre-earnings runup is a beat-rate story. The market doesn't uniformly drift before announcements. It separates stocks with credible beat histories from those without one, and prices them accordingly.
We tested this across NYSE, NASDAQ, and AMEX from 2000 through 2025. The result holds from the Q1-to-Q5 quintile spread (53bp) to the individual category breakdown. Beat rate is not just a post-earnings signal. It predicts pre-announcement behavior too.
Method
Universe: NYSE, NASDAQ, AMEX. Market cap > $1B (historical FY). Period: 2000-2025. 163,661 earnings events. Benchmark: SPY (cumulative abnormal return). Winsorization: 1st/99th percentile.
Beat rate classification: - Habitual Beater: beat rate > 75%, minimum 8 reported quarters - Mixed: beat rate 25%-75% - Habitual Misser: beat rate < 25%
Windows measured: T-10, T-5, T-1 (pre-announcement), T+1 (post-announcement control)
All CARs are relative to SPY over the same window.
What We Found
The pre-earnings drift is statistically significant across all three pre-announcement windows. It disappears at T+1, which is expected: once the announcement hits, it's a different event.
Pre-Event CAR by Window (Overall, n=163,661):
| Window | Mean CAR | t-stat | N | Hit Rate |
|---|---|---|---|---|
| T-10 | +0.067% | 3.73 | 163,661 | 49.8% |
| T-5 | +0.054% | 3.76 | 163,661 | 50.3% |
| T-1 | +0.027% | 2.60 | 163,661 | 50.2% |
| T+1 | +0.022% | 1.75 | 163,661 | 49.8% |
T+1 drops below significance (t=1.75). That's the cleanest possible sign that what we're measuring is pre-announcement behavior, not just general momentum.
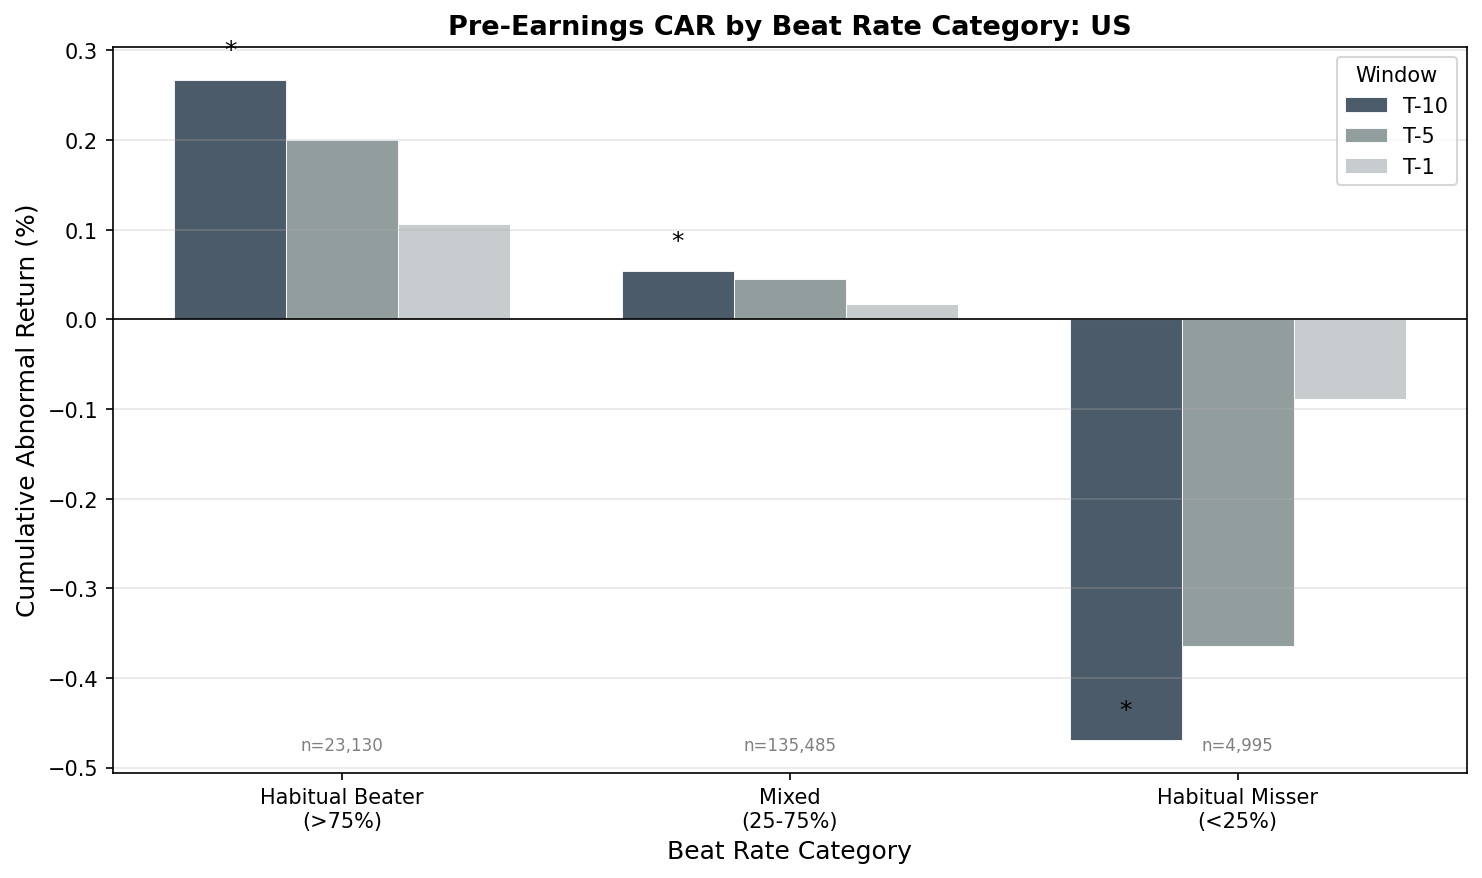
By Category at T-10:
| Category | Mean CAR | t-stat | N |
|---|---|---|---|
| Habitual Beater (>75%) | +0.266% | 5.58 | 23,130 |
| Mixed (25-75%) | +0.055% | 2.81 | 135,520 |
| Overall | +0.067% | 3.73 | 163,661 |
| Habitual Misser (<25%) | -0.479% | -3.65 | 5,011 |
Missers don't just underperform. They actively fall. By T-10, habitual missers are -0.479% below the S&P 500 heading into the announcement. Then they lose another -0.315% at T+1 (t=-4.13), which makes sense: their miss lands, market reacts.
Beaters run up +0.266%, then their T+1 is a non-event: +0.009%, t=0.23. The announcement is already in the price.
The Beat Rate Effect
The relationship between beat rate and pre-earnings drift is monotonic. Sort all events into quintiles by historical beat rate and the pattern holds at every step.
Quintile T-10 CAR:
| Quintile | Beat Rate Range | Mean Beat Rate | Mean CAR | Hit Rate |
|---|---|---|---|---|
| Q1 (lowest) | 0%-43.1% | 31.6% | -0.219% | 47.2% |
| Q2 | 43.1%-53.7% | 48.8% | +0.030% | 49.3% |
| Q3 | 53.7%-62.5% | 58.0% | +0.135% | 50.2% |
| Q4 | 62.5%-72.4% | 67.2% | +0.087% | 50.6% |
| Q5 (highest) | 72.4%-100% | 81.6% | +0.310% | 51.9% |
Q5-Q1 spread: 53bp. Q1 stocks actively lose ground before they announce. Q5 stocks rally. The crossing point is roughly the 50% beat rate, which is Q2 territory.
The hit rate pattern mirrors this. Q1 shows 47.2% positive days. Q5 shows 51.9%. These are small numbers, but they're consistent with a real distributional shift, not noise.
Habitual beaters (n=23,130) hit statistical significance at all three pre-announcement windows:
| Window | Mean CAR | t-stat | Hit Rate |
|---|---|---|---|
| T-10 | +0.266% | 5.58 | 51.7% |
| T-5 | +0.198% | 4.99 | 51.7% |
| T-1 | +0.106% | 3.42 | 51.4% |
| T+1 | +0.009% | 0.23 | — |
Consistent drift across all windows, then nothing at T+1. That's not luck. That's a systematic pre-positioning effect.

Academic Evidence
This isn't a new finding. Barber, De George, Lehavy, and Trueman (2013) documented a pre-earnings premium in the Journal of Accounting Research. They found abnormal returns in the days before announcements, concentrated in stocks with stronger earnings histories and higher trading volume expectations. The mechanism they propose: informed investors position ahead of expected beats, lifting prices before the fact.
So and Wang (2014) took a different angle in the Journal of Financial Economics, focusing on liquidity provision. Options market makers and short-term traders accumulate positions ahead of announcements. The cost of that liquidity provision shows up as a drift premium for stocks where the directional outcome is more predictable. Habitual beaters have more predictable outcomes, so liquidity providers are more willing to accumulate early.
Both papers point in the same direction: the pre-announcement drift is driven by informed positioning, and the signal is stronger when the expected outcome is clearer.
Why the Runup Happens
Three mechanisms, each reinforcing the others:
Informed positioning. Institutional investors with fundamental models know which companies have consistent beat histories. They build positions early. The buying pressure accumulates over 10 trading days, not in one session.
Options market dynamics. Companies approaching earnings see rising implied volatility. Market makers hedge their options books by buying underlying shares. For stocks with credible beat histories, the hedging demand skews bullish.
Habitual beater effect. Companies that beat consistently often do so through guidance management. Management teams with a track record of sandbagging estimates are better known to the market. Analysts and investors price in an expected beat before it happens.
Liquidity premium. Some of the T-10 CAR reflects compensation for holding through event risk. Investors who provide liquidity into the announcement window earn a premium for absorbing that uncertainty.
These aren't competing explanations. They're additive. A stock with a 90% historical beat rate is subject to all four simultaneously.
Screening for Pre-Earnings Opportunities
Simple screen (upcoming earnings, ranked by beat rate):
SELECT ec.symbol,
    CAST(ec.date AS DATE) AS earnings_date,
    ec.epsEstimated,
    COUNT(es.symbol) AS prior_reports,
    SUM(CASE WHEN es.epsActual > es.epsEstimated THEN 1 ELSE 0 END) AS beats,
    ROUND(SUM(CASE WHEN es.epsActual > es.epsEstimated THEN 1 ELSE 0 END)
        * 100.0 / NULLIF(COUNT(es.symbol), 0), 1) AS beat_rate_pct
FROM earnings_calendar ec
LEFT JOIN earnings_surprises es ON ec.symbol = es.symbol
    AND CAST(es.date AS DATE) < CAST(ec.date AS DATE)
WHERE CAST(ec.date AS DATE) BETWEEN CURRENT_DATE AND CURRENT_DATE + INTERVAL '14' DAY
  AND ec.epsEstimated IS NOT NULL
GROUP BY ec.symbol, CAST(ec.date AS DATE), ec.epsEstimated
HAVING COUNT(es.symbol) >= 4
ORDER BY beat_rate_pct DESC
LIMIT 30
Advanced screen (habitual beaters only, >$1B market cap):
WITH beat_history AS (
    SELECT symbol,
        COUNT(*) AS total_reports,
        SUM(CASE WHEN epsActual > epsEstimated THEN 1 ELSE 0 END) AS beats,
        ROUND(SUM(CASE WHEN epsActual > epsEstimated THEN 1 ELSE 0 END)
            * 100.0 / COUNT(*), 1) AS beat_rate_pct
    FROM earnings_surprises
    WHERE epsEstimated IS NOT NULL
      AND ABS(epsEstimated) > 0.01
    GROUP BY symbol
    HAVING COUNT(*) >= 8
),
upcoming AS (
    SELECT symbol, CAST(date AS DATE) AS earnings_date, epsEstimated
    FROM earnings_calendar
    WHERE CAST(date AS DATE) BETWEEN CURRENT_DATE AND CURRENT_DATE + INTERVAL '14' DAY
      AND epsEstimated IS NOT NULL
)
SELECT u.symbol, u.earnings_date, u.epsEstimated,
    bh.beat_rate_pct, bh.beats, bh.total_reports,
    ROUND(k.marketCap / 1e9, 1) AS mktcap_bn
FROM upcoming u
JOIN beat_history bh ON u.symbol = bh.symbol
JOIN key_metrics k ON u.symbol = k.symbol AND k.period = 'FY'
WHERE k.marketCap > 1000000000
  AND bh.beat_rate_pct >= 75
QUALIFY ROW_NUMBER() OVER (PARTITION BY u.symbol ORDER BY k.date DESC) = 1
ORDER BY bh.beat_rate_pct DESC, ROUND(k.marketCap / 1e9, 1) DESC
LIMIT 30
The advanced screen targets the habitual beater cohort directly. These are the 23,130 events where the T-10 CAR averaged +0.266% with a t-stat of 5.58.
Limitations
Transaction costs. The +0.266% gross CAR for habitual beaters looks clean on paper. After bid-ask spreads and market impact, the net capture shrinks. This matters more for smaller-cap names in the beater cohort.
Benchmark. SPY is a simple benchmark. A multi-factor model (Fama-French 5-factor, or at minimum sector-adjusted) would more precisely isolate the pre-earnings effect from momentum, quality, and size exposures that habitual beaters tend to carry.
Crowding. The pre-earnings drift is documented in academic literature going back to 2013. Systematic funds screen for this. More capital chasing the same signal compresses returns over time. Our 2000-2025 aggregate may overstate what's available today.
Sample construction. The habitual misser cohort (n=5,011) is small relative to the overall universe. Low-beat-rate companies may face survivorship issues, delisting, or coverage loss. The -0.479% CAR for this group should be interpreted with that in mind.
Estimate quality. Consensus estimates in the data warehouse reflect final pre-announcement numbers. The market may have already absorbed revisions in the days prior, partially explaining the drift.
Takeaway
The pre-earnings runup is a real phenomenon in US equity markets. 163,661 events, 25 years, statistically significant across all three pre-announcement windows.
But the aggregate number (+0.067%) is not the signal. The signal is in the tails. Habitual beaters drift +0.266% at T-10. Habitual missers fall -0.479%. The spread between Q5 and Q1 beat-rate quintiles is 53bp over 10 trading days.
Beat rate is a forward-looking indicator, not just a backward-looking label. The market prices in the expected outcome before it happens. That's the mechanism, the academic explanation, and the practical screen. Sort upcoming earnings by historical beat rate, filter for minimum eight quarters of data, and focus on the companies that consistently beat expectations. That's where the pre-announcement drift concentrates.
Data: Ceta Research (FMP financial data). Event study: earnings_surprises + earnings_calendar + stock_eod + key_metrics tables. Market cap filter: >$1B (FY historical). Benchmark: SPY. Winsorized at 1%/99%. This is educational content, not investment advice.
References
- Barber, B., De George, E., Lehavy, R. & Trueman, B. (2013). "The Earnings Announcement Premium and Trading Volume." Journal of Accounting Research, 51(1).
- So, E. & Wang, S. (2014). "News-Driven Return Reversals: Liquidity Provision Ahead of Earnings Announcements." Journal of Financial Economics, 114(1).