
Price-to-Tangible-Book in Germany: 6.90% CAGR and +1.86% Alpha Over the DAX
The P/TBV strategy on Germany's XETRA returned 6.90% annualised over 25 years, beating the DAX's 5.04% by 1.86% per year. Down capture of 34.4% means the portfolio absorbs about a third of the DAX's losses in down years.

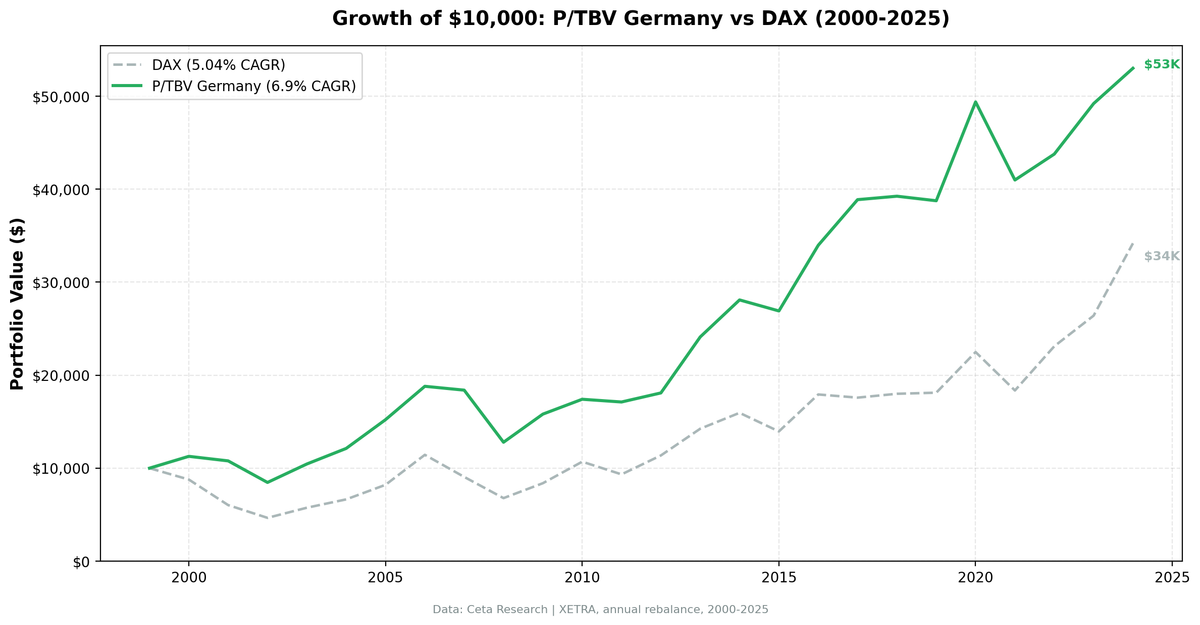
The P/TBV strategy on Germany's XETRA exchange returned 6.90% annualised over 25 years, beating the DAX's 5.04% by 1.86% per year. That's the thinnest winning margin of any major market in this series, and the case rests on the defensive profile rather than the return edge. Down capture of 34.4% means the portfolio absorbs about a third of the DAX's losses in down years. Beta of 0.608 confirms it: German tangible-book stocks move at roughly 60% of the speed of the domestic index. In 2007, the DAX dropped 20.77% while this portfolio lost just 2.20%. That's not a hedging artefact. It's a structural feature of what XETRA's industrial base actually is.
Contents
Data: FMP financial data warehouse, 2000–2025. Updated June 2026.
The Strategy
Price-to-Tangible-Book removes goodwill and intangible assets from book value before dividing into market cap: P/TBV = marketCap / (totalStockholdersEquity - goodwill - intangibleAssets). The result is a ratio that values only what physically exists in the business. Equipment, inventory, property, receivables.
German XETRA is dominated by Mittelstand-adjacent industrial companies: machinery manufacturers, automotive suppliers, chemical producers, specialty engineers. These businesses hold substantial tangible asset bases. Low P/TBV in Germany doesn't mean a distressed tech company trading below amortised software. It means a profitable manufacturer trading below the replacement value of its factories.
Quality filters prevent buying cheap-but-broken: ROE above 8%, ROA above 3%, operating profit margin above 10%. These keep the portfolio in companies generating real returns on their tangible base, not just cheap on paper.
| Parameter | Value |
|---|---|
| Signal | P/TBV ascending (lowest first) |
| Quality filters | ROE > 8%, ROA > 3%, OPM > 10% |
| Rebalance | Annual (July), 45-day filing lag |
| Portfolio size | Top 30, equal weight |
| Minimum stocks | 10 (else cash) |
| Market cap threshold | €500M (~$545M USD) |
| Universe | XETRA (Germany) |
| Period | 2000-2025 (25 years) |
| Benchmark | DAX |
What We Found
Germany's opening year sets the defensive tone. In 2000, the strategy gained +12.72% while the DAX lost 12.21%, a 25-point gap. German manufacturers, automotive companies, and chemical producers that passed the quality screen were cheap on tangible assets and profitable. The DAX was dragged down by its tech and telecom components (Deutsche Telekom, SAP, Infineon) while low-P/TBV industrials held steady. An earlier version of this backtest showed +68.8% for 2000; that number was inflated by corrupted price rows in the source data, which our data-quality filters now remove. The corrected gap is still large, just not implausible.
The down capture of 34.4% is the defining characteristic. The portfolio takes about a third of the DAX's damage in down years and participates in roughly three-quarters of the up years (up capture 76.5%). That asymmetry is the entire edge: the strategy compounds by losing less, not by winning more. Beta of 0.608 confirms it: these stocks move at roughly 60% of the speed of the DAX.
The 2007-2008 sequence shows both sides. In 2007, the strategy lost just 2.20% while the DAX dropped 20.77%. In 2008, when the financial crisis hit globally, the strategy fell 30.47% against the DAX's 25.17%. The 2007 resilience didn't carry into the systemic crisis: when everything fell, the strategy's industrial holdings fell harder than the index. The two years together still left the strategy well ahead, but 2008 itself is a clear failure year, not a defensive one.
2013 is a standout: +33.28% against the DAX's +25.29%. European industrial earnings held up as the ECB's accommodative policy supported capex cycles, and low-P/TBV German industrials re-rated as real asset values became more appreciated by European institutional money.
The recent years have been mixed. 2019 brought -1.24% against the DAX's +0.65% as German manufacturing contracted, especially in automotive (diesel scandal aftermath, EV transition costs). 2022 saw the DAX surge +25.89% while the strategy returned only +6.80%, a 19-point gap as the index rallied on different sector composition. 2024 repeated that pattern: +7.72% against the DAX's +29.47%. But 2020 delivered +27.41% against the DAX's +24.12%, and 2023 stayed close to the benchmark (+12.41% vs +14.26%).
Germany averaged 16.9 stocks per period with zero cash years. The quality filter maintained a viable universe throughout, which is notable given how tight the screen is.
Annual Returns
| Year | Strategy | DAX | Excess |
|---|---|---|---|
| 2000 | +12.72% | -12.21% | +24.92% |
| 2001 | -4.34% | -31.32% | +26.98% |
| 2002 | -21.50% | -22.76% | +1.26% |
| 2003 | +23.43% | +23.38% | +0.05% |
| 2004 | +16.03% | +15.62% | +0.41% |
| 2005 | +25.50% | +23.56% | +1.94% |
| 2006 | +23.60% | +39.31% | -15.71% |
| 2007 | -2.20% | -20.77% | +18.57% |
| 2008 | -30.47% | -25.17% | -5.30% |
| 2009 | +23.66% | +23.64% | +0.02% |
| 2010 | +10.10% | +27.58% | -17.48% |
| 2011 | -1.68% | -12.72% | +11.04% |
| 2012 | +5.69% | +21.78% | -16.08% |
| 2013 | +33.28% | +25.29% | +7.99% |
| 2014 | +16.51% | +11.99% | +4.53% |
| 2015 | -4.22% | -12.53% | +8.31% |
| 2016 | +26.24% | +28.49% | -2.25% |
| 2017 | +14.45% | -1.90% | +16.35% |
| 2018 | +0.95% | +2.36% | -1.40% |
| 2019 | -1.24% | +0.65% | -1.89% |
| 2020 | +27.41% | +24.12% | +3.29% |
| 2021 | -17.00% | -18.38% | +1.38% |
| 2022 | +6.80% | +25.89% | -19.10% |
| 2023 | +12.41% | +14.26% | -1.85% |
| 2024 | +7.72% | +29.47% | -21.75% |
The Current Screen
The US screen is available at cetaresearch.com/data-explorer?q=5GCSAfLr-m. Exchange-specific queries for XETRA and other markets can be run on the data explorer at cetaresearch.com.
Limitations
Currency exposure is significant. Returns are calculated in EUR. A non-European investor takes on EUR/USD risk. Post-2022 EUR weakness has been a drag for USD-based investors in European equities.
The portfolio is structurally concentrated in industrials and chemicals. When German manufacturing faces a structural headwind, as it has since 2019 (automotive transition, energy costs), there's no diversification within the strategy's natural universe. The quality filter can't protect against sector-level economic deterioration.
Average portfolio size of 16.9 stocks is smaller than the target of 30. The €500M market cap threshold and quality filters together create a tight screen. The strategy has been capacity-constrained by design, which is a reasonable trade-off but worth understanding.
The +1.86% annual edge is thin. Two bad relative years in a row would erase a decade of accumulated excess, and 2022 plus 2024 both produced 19-point-plus gaps against a rallying DAX. The case for the strategy in Germany rests on its defensive profile (34.4% down capture, beta 0.608), not on the return edge.
Part of a Series
This post is part of a multi-exchange series on the Price-to-Tangible-Book strategy. The US flagship backtest, including full methodology and global results summary, is at ptbv-strategy-us-backtest.
Data: Ceta Research (FMP financial data warehouse), 2000-2025. Full methodology: backtests/METHODOLOGY.md
Past performance does not guarantee future results. This is educational content, not investment advice.

