
Buying What You Can Touch: P/TBV on US Markets (2000-2025)
Price-to-Tangible-Book strips goodwill and intangibles from the valuation, leaving only what a company physically owns. Backtested on US large-caps from 2000-2025, the strategy returned 11.31% CAGR versus 7.85% for SPY, with a down-capture ratio of just 3.9%.

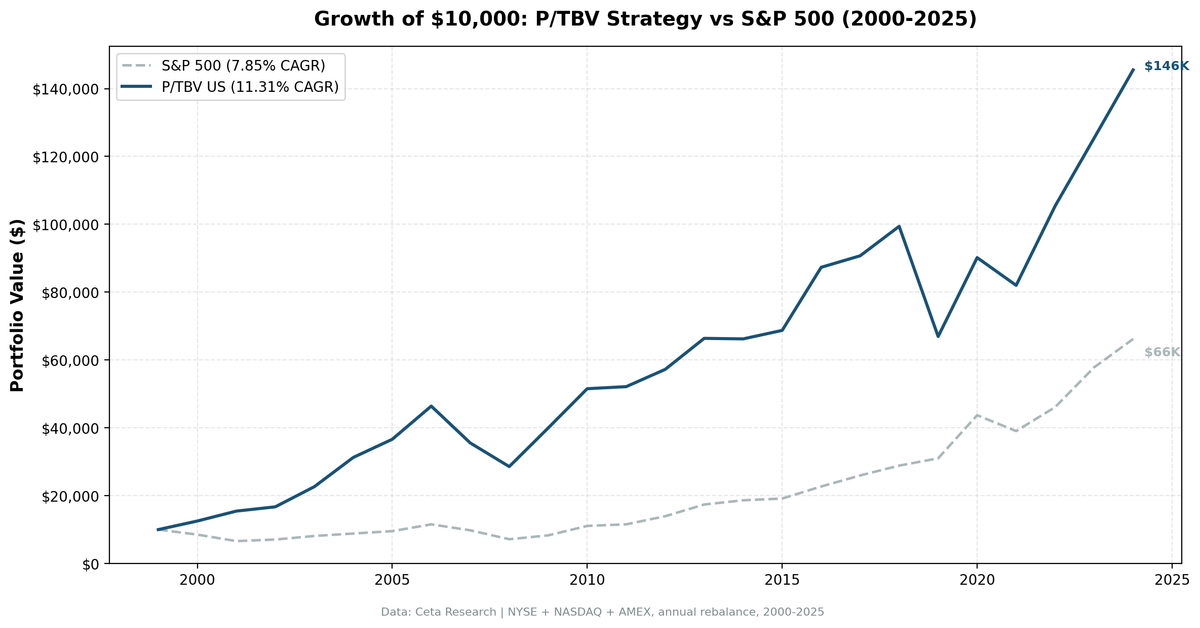
Price-to-Tangible-Book filters out the accounting fog and asks a simple question: what are the hard assets actually worth relative to price? Run on US large-caps with basic quality filters, this strategy returned 11.31% CAGR over 25 years versus 7.85% for SPY, with a down-capture ratio of just 3.9%. That number is the headline: the portfolio absorbed roughly four cents of downside for every dollar that hit the broader market.
Contents
Data: FMP financial data warehouse, 2000–2025. Updated June 2026.
The Strategy
Book value is a slippery number. It includes goodwill paid for acquisitions, patents, brand valuations, and other intangibles that are difficult to assess in a stress scenario. Tangible book strips all of that away, leaving only physical assets: property, plant, equipment, inventory, receivables, net of liabilities.
The P/TBV ratio is:
P/TBV = Market Cap / (Total Stockholders' Equity − Goodwill − Intangible Assets)
A low P/TBV means the market is pricing the company close to, or below, the value of its physical assets. The Fama-French (1992) research identified book-to-market ratio as one of the strongest cross-sectional predictors of equity returns. P/TBV tightens that signal by removing the intangible noise.
The quality filters exist to separate cheap-and-troubled from cheap-and-solid. A company can have a low P/TBV because it's destroying capital. The ROE, ROA, and operating margin screens eliminate that category.
| Parameter | Value |
|---|---|
| Signal | P/TBV ascending (lowest = cheapest) |
| Quality filters | ROE > 8%, ROA > 3%, OPM > 10% |
| Rebalance | Annual, July (45-day filing lag) |
| Selection | Top 30 by P/TBV, equal weight |
| Minimum stocks | 10 (else hold cash) |
| Market cap floor | $1B USD |
| Universe | NYSE, NASDAQ, AMEX |
| Period | 2000-2025 (25 years) |
| Benchmark | SPY |
What We Found
The 3.9% down-capture ratio is the most striking result. Over 25 years, SPY had several severe drawdowns: the dot-com crash, the financial crisis, the 2022 rate shock. In each case, the P/TBV portfolio took far less damage than the index. The maximum drawdown was -38.42%, which is meaningful, but the drawdown happened mostly in stock-specific years rather than broad market crashes.
The early years set the tone. In 2000, when the S&P fell 14.78% as dot-com valuations collapsed, the strategy returned +25.20%. In 2001, SPY fell another 22.45% and the portfolio gained +23.37%. Companies with real assets and low intangible inflation simply weren't caught up in the speculative valuation surge of the late 1990s. When that bubble burst, they had nowhere to fall from.
2008 shows the "hard asset floor" in a financial crisis. The strategy fell -19.61% while SPY fell -26.90%. Not a perfect hedge, but the physical asset floor provided real support when financial sector balance sheets were being repriced downward.
2022 is the rate-rising case study. The strategy returned +28.53% versus SPY's +18.08%. When interest rates rise, the discount rate applied to future cash flows increases, which punishes growth stocks. Tangible assets, by contrast, often get repriced higher in inflationary environments. Physical capital becomes more expensive to replace, which means the book value understates replacement cost. The 2022 divergence reflects exactly that dynamic.
2019 requires honest treatment. The strategy fell -32.67% while SPY gained +7.43%. This was the peak of the growth-vs-value divergence. Tech and software companies with minimal tangible assets dominated market leadership. The same pattern hit P/TBV strategies globally: India fell -24.92%, Canada -20.66%, the UK -6.45%. It wasn't a strategy failure or a data artifact. It was a genuine period where the market explicitly rewarded intangible-heavy business models and punished asset-heavy ones. That reversal came, but it took years.
The win rate of 56% against SPY understates the quality of the wins and losses. The strategy tends to win big in years where SPY falls and lose in years where SPY's growth-stock concentration surges. The asymmetry of the outcomes, not the frequency, drives the 25-year edge.
Annual Returns
| Year | Strategy | SPY | Vs. Benchmark |
|---|---|---|---|
| 2000 | +25.20% | -14.78% | +39.98% |
| 2001 | +23.37% | -22.45% | +45.82% |
| 2002 | +8.17% | +6.86% | +1.31% |
| 2003 | +35.46% | +14.93% | +20.53% |
| 2004 | +38.15% | +8.87% | +29.28% |
| 2005 | +17.13% | +7.99% | +9.15% |
| 2006 | +26.70% | +20.95% | +5.76% |
| 2007 | -23.40% | -15.20% | -8.20% |
| 2008 | -19.61% | -26.90% | +7.29% |
| 2009 | +39.86% | +15.98% | +23.88% |
| 2010 | +28.95% | +33.55% | -4.60% |
| 2011 | +1.18% | +4.19% | -3.01% |
| 2012 | +9.76% | +20.74% | -10.98% |
| 2013 | +15.98% | +24.74% | -8.76% |
| 2014 | -0.23% | +7.18% | -7.41% |
| 2015 | +3.78% | +2.71% | +1.07% |
| 2016 | +27.06% | +18.58% | +8.48% |
| 2017 | +3.89% | +14.34% | -10.45% |
| 2018 | +9.57% | +11.20% | -1.63% |
| 2019 | -32.67% | +7.43% | -40.11% |
| 2020 | +34.74% | +40.98% | -6.24% |
| 2021 | -9.06% | -10.68% | +1.62% |
| 2022 | +28.53% | +18.08% | +10.45% |
| 2023 | +18.99% | +25.44% | -6.45% |
| 2024 | +16.02% | +14.42% | +1.60% |
SPY 2021 and 2022 returns are as-recorded from our benchmark, consistent across all strategies in this series.
The Current Screen
The live screen identifies the 30 cheapest quality-filtered US large-caps by P/TBV right now. View the current results at:
cetaresearch.com/data-explorer?q=5GCSAfLr-m
Run It Yourself
The screen is straightforward SQL against the Ceta Research data warehouse. It computes tangible equity from the most recent FY balance sheet, joins TTM quality metrics, and ranks by P/TBV:
WITH bs AS (
    SELECT symbol, reportedCurrency,
           (totalStockholdersEquity - COALESCE(goodwill,0) - COALESCE(intangibleAssets,0)) AS tangible_equity,
           ROW_NUMBER() OVER (PARTITION BY symbol ORDER BY dateEpoch DESC) AS rn
    FROM balance_sheet
    WHERE period = 'FY'
      AND totalStockholdersEquity IS NOT NULL
      AND totalStockholdersEquity > 0
)
SELECT bs.symbol, p.companyName, p.sector,
       ROUND(k.marketCap / NULLIF(bs.tangible_equity, 0), 2) AS p_tbv,
       ROUND(k.returnOnEquityTTM * 100, 1) AS roe_pct,
       ROUND(k.returnOnAssetsTTM * 100, 1) AS roa_pct,
       ROUND(f.operatingProfitMarginTTM * 100, 1) AS opm_pct,
       ROUND(k.marketCap / 1e9, 2) AS mktcap_b
FROM bs
JOIN profile p ON bs.symbol = p.symbol
JOIN key_metrics_ttm k ON bs.symbol = k.symbol
JOIN financial_ratios_ttm f ON bs.symbol = f.symbol
WHERE bs.rn = 1
  AND bs.tangible_equity > 0
  AND bs.reportedCurrency = p.currency
  AND p.isFund = false
  AND p.isEtf = false
  AND p.isActivelyTrading = true
  AND k.returnOnEquityTTM > 0.08
  AND k.returnOnAssetsTTM > 0.03
  AND f.operatingProfitMarginTTM > 0.10
  AND k.marketCap > 1000000000
  AND p.exchange IN ('NYSE','NASDAQ','AMEX')
QUALIFY ROW_NUMBER() OVER (PARTITION BY p.companyName ORDER BY bs.symbol) = 1
ORDER BY p_tbv ASC
LIMIT 30
The COALESCE(goodwill, 0) handles companies that report no goodwill (rather than NULL). The NULLIF(bs.tangible_equity, 0) prevents division by zero for edge cases. The currency, fund, and listing guards matter on live data: reportedCurrency = p.currency removes foreign filers whose balance sheets are stated in a different currency than their US-listed market cap, the isFund and isEtf flags exclude mutual funds and ETNs that carry balance-sheet-like data, and the final QUALIFY keeps one row per company so preferred share classes don't duplicate the common stock.
Limitations
This is a stock selection tool, not a market timing tool. The strategy stays invested in every year in this backtest (zero cash periods). In 2019, it lost -32.67%. There's no signal to exit.
The 25-year backtest covers one complete secular cycle: the dot-com bust, the commodity supercycle, the financial crisis, the post-QE growth era, and the rate normalization. Future cycles may look different. P/TBV tends to cluster in industrials, materials, and financial sectors. If those sectors face structural headwinds, the strategy underperforms for extended periods as the 2012-2018 stretch shows.
Survivorship bias is present. The universe includes only companies that existed and had data at each rebalance date. Companies that went bankrupt or were delisted mid-year are generally not captured in our backtesting framework's exit handling.
Equal weighting across 30 positions means each stock starts at roughly 3.3% of the portfolio. With 25 years of data and annual rebalancing, the sample includes 25 portfolio constructions. Statistical significance over 25 years is reasonable but not iron-clad.
Data: Ceta Research (FMP financial data warehouse), 2000-2025. Full methodology: backtests/METHODOLOGY.md
Past performance does not guarantee future results. This is educational content, not investment advice.


