
Price-to-Tangible-Book in Hong Kong: 6.48% CAGR and +4.84% Alpha Over the Hang Seng
The P/TBV strategy on the Hong Kong Stock Exchange returned 6.48% annualised over 25 years against the Hang Seng's 1.64%, adding 4.84% per year with a 68% win rate. $10,000 grew to $48,000 vs $15,000 for the index.

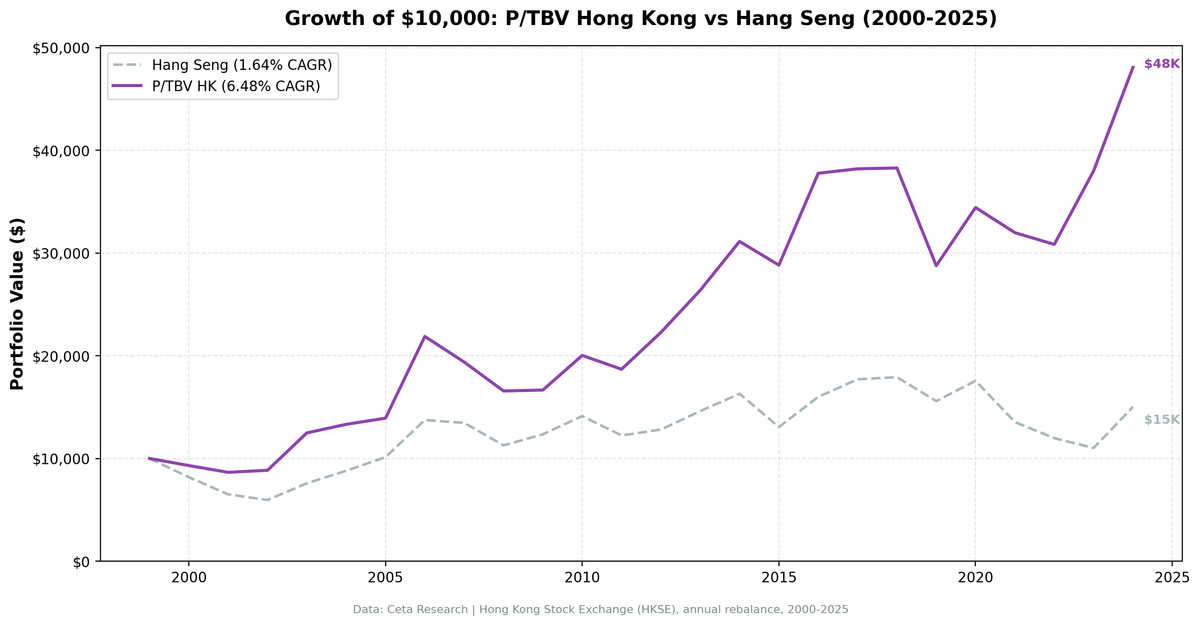
The P/TBV strategy on the Hong Kong Stock Exchange returned 6.48% annualised over 25 years against the Hang Seng's 1.64%, adding 4.84% per year. The Hang Seng went almost nowhere for a quarter century: $10,000 in the index grew to about $15,000, while the strategy turned the same $10,000 into roughly $48,000. The strategy beat the index in 17 of 25 years, a 68% win rate, and its maximum drawdown of -24.85% is far shallower than the index's -40.45%.
Contents
Data: FMP financial data warehouse, 2000–2025. Updated June 2026.
The Strategy
Price-to-Tangible-Book removes goodwill and intangible assets from book value before dividing into market cap: P/TBV = marketCap / (totalStockholdersEquity - goodwill - intangibleAssets). What remains is the physical and financial business: property, equipment, inventory, loan books, receivables.
Hong Kong's listed universe is unusually well suited to this signal. The exchange is dominated by property developers, conglomerates, banks, and industrial holding companies. These businesses carry enormous tangible asset bases, and Hong Kong has a long tradition of stocks trading at persistent discounts to book value. A low P/TBV screen here selects from a deep pool of asset-heavy companies, and the quality filters separate the profitable ones from the value traps.
| Parameter | Value |
|---|---|
| Signal | P/TBV ascending (lowest first) |
| Quality filters | ROE > 8%, ROA > 3%, OPM > 10% |
| Rebalance | Annual (July), 45-day filing lag |
| Portfolio size | Top 30, equal weight |
| Minimum stocks | 10 (else cash) |
| Market cap threshold | HK$2B (~$256M USD) |
| Universe | Hong Kong Stock Exchange (HKSE) |
| Period | 2000-2025 (25 years) |
| Benchmark | Hang Seng |
What We Found
The headline is the benchmark, not the strategy. The Hang Seng returned 1.64% annualised over 25 years, one of the weakest major-index records in our 15-market study. Against that backdrop, the strategy's 6.48% CAGR is a large relative win even though the absolute number is modest. The +4.84% annual excess is the fifth largest in the series.
The down capture of 41.64% means the portfolio absorbs about 42 cents of every dollar the Hang Seng loses in down years. That protection shows up exactly where it matters. In 2021, the Hang Seng fell 22.89% as China's property crisis and regulatory crackdowns hit; the strategy lost just 7.13%. In 2022, the index fell another 11.56% and the strategy lost 3.56%. The quality filters kept the portfolio out of the most leveraged developers whose returns on assets had already deteriorated.
2023 is the standout year: +23.20% while the Hang Seng fell 7.96%, a 31-point gap. As the broad index sank on China-growth pessimism, the cheap end of the quality-filtered universe re-rated. That single year accounts for a meaningful share of the strategy's lifetime excess.
The early 2000s set the same tone. The strategy lost far less than the index through the dot-com unwind (2000-2002), then captured the recovery: +41.14% in 2003 against the index's +27.26%, and +57.17% in 2006 against +35.67% during the pre-crisis China boom.
The strategy has clear weak years. In 2004 and 2005 it lagged by 9 and 11 points as the H-share rally lifted index heavyweights that don't pass a tangible-book screen. 2019 was the worst year outright: -24.85%, which is also the strategy's maximum drawdown, while the index fell 12.99%. That was the global value crash, and Hong Kong's version was amplified by the protests-driven property selloff. And in 2024, the strategy's +26.52% trailed the index's +36.31% rebound.
Hong Kong averaged 22.4 stocks per period with zero cash years. The universe of qualifying asset-heavy companies is deep enough that the screen always filled.
Annual Returns
| Year | Strategy | Hang Seng | Excess |
|---|---|---|---|
| 2000 | -6.93% | -18.23% | +11.29% |
| 2001 | -7.09% | -20.43% | +13.34% |
| 2002 | +2.29% | -8.47% | +10.76% |
| 2003 | +41.14% | +27.26% | +13.88% |
| 2004 | +6.69% | +16.02% | -9.33% |
| 2005 | +4.50% | +15.16% | -10.65% |
| 2006 | +57.17% | +35.67% | +21.50% |
| 2007 | -11.40% | -2.02% | -9.38% |
| 2008 | -14.53% | -16.25% | +1.71% |
| 2009 | +0.55% | +9.50% | -8.95% |
| 2010 | +20.23% | +14.39% | +5.83% |
| 2011 | -6.72% | -13.33% | +6.61% |
| 2012 | +19.19% | +4.68% | +14.51% |
| 2013 | +18.42% | +13.99% | +4.43% |
| 2014 | +18.03% | +11.60% | +6.43% |
| 2015 | -7.40% | -19.87% | +12.48% |
| 2016 | +31.02% | +22.44% | +8.58% |
| 2017 | +1.15% | +10.71% | -9.56% |
| 2018 | +0.21% | +1.16% | -0.95% |
| 2019 | -24.85% | -12.99% | -11.86% |
| 2020 | +19.70% | +12.68% | +7.01% |
| 2021 | -7.13% | -22.89% | +15.76% |
| 2022 | -3.56% | -11.56% | +8.00% |
| 2023 | +23.20% | -7.96% | +31.17% |
| 2024 | +26.52% | +36.31% | -9.79% |
The Current Screen
The US screen is available at cetaresearch.com/data-explorer?q=5GCSAfLr-m. For Hong Kong, swap the exchange filter to p.exchange = 'HKSE' and set the market cap floor to k.marketCap > 2000000000 (HK$2B; market caps are stored in local currency per exchange).
Limitations
The Sharpe ratio of 0.183 is low in absolute terms. The strategy's volatility (19.0% annualised) is high relative to its 6.48% return, and the 3% Hong Kong risk-free rate eats into the excess. This is a relative-return story against a weak index, not a high-Sharpe strategy on its own.
Property exposure is structural. Hong Kong's low P/TBV universe is heavy in developers, landlords, and banks with property-backed loan books. The quality filters caught the worst of the post-2021 property deterioration, but the filing lag means the screen reacts to reported financials up to a year after conditions turn.
The Hang Seng's 1.64% CAGR makes any reasonable stock-selection method look strong. If Hong Kong's index returns revert toward global norms, the strategy's excess will likely compress. Beta of 0.87 means the portfolio still moves with the local market.
Returns are in local currency (HKD). The HKD's peg to the USD removes most currency risk for dollar-based investors, but the peg itself is a policy choice that has come under periodic speculation.
Survivorship bias applies: companies delisted during the period aren't fully captured in exit returns.
Part of a Series
This post is part of a multi-exchange series on the Price-to-Tangible-Book strategy. The US flagship backtest, including full methodology and global results summary, is at ptbv-strategy-us-backtest.
Data: Ceta Research (FMP financial data warehouse), 2000-2025. Full methodology: backtests/METHODOLOGY.md
Past performance does not guarantee future results. This is educational content, not investment advice.

