
Sector-Adjusted Momentum on Germany: 10.29% CAGR, 77.4% Down Capture

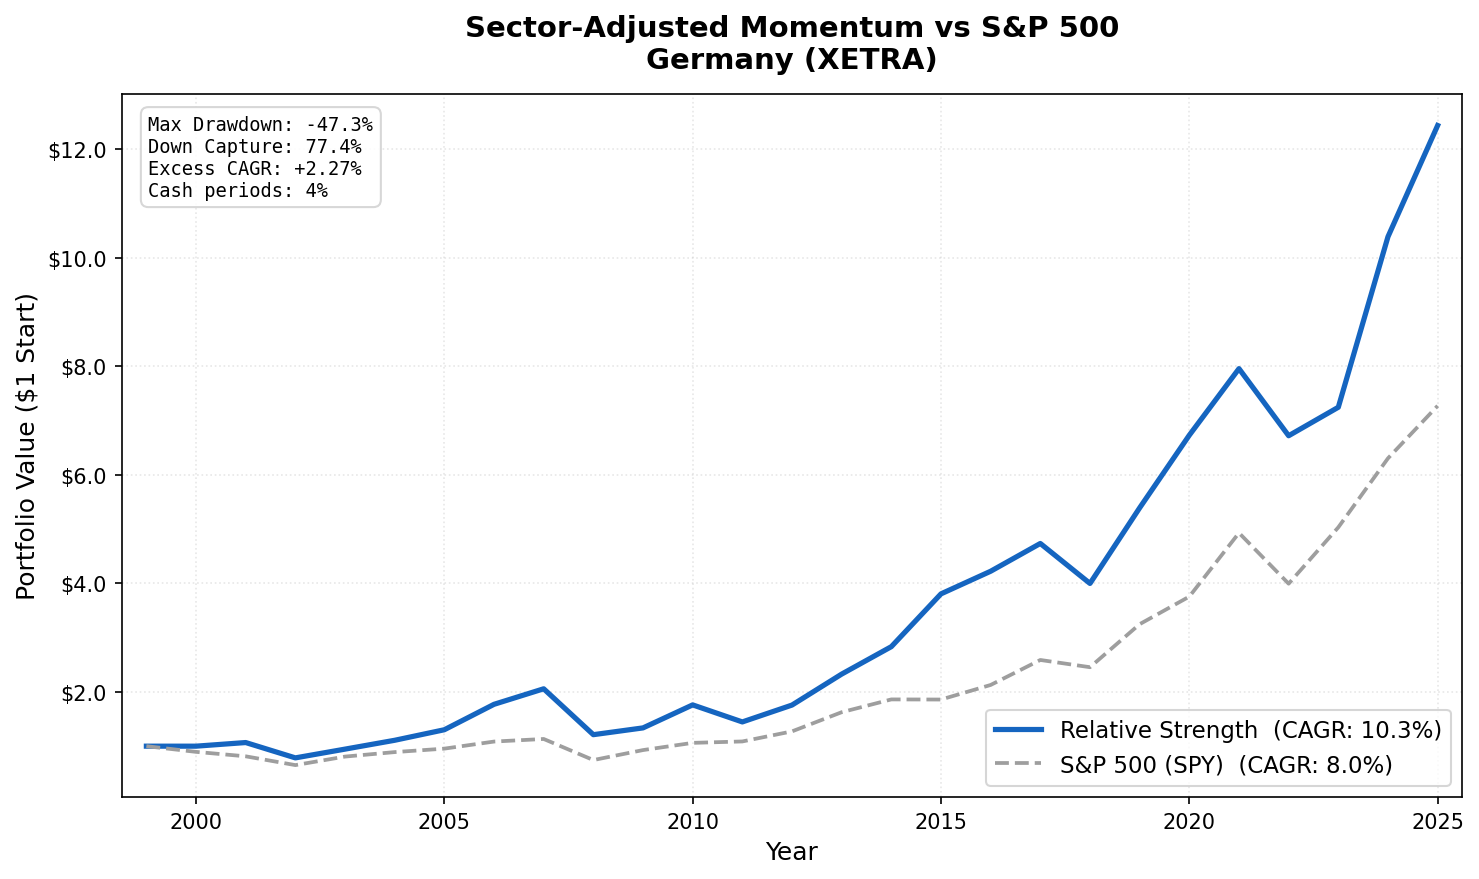
We backtested the Sector-Adjusted Momentum strategy on XETRA (German stocks) from 2000 to 2025. The strategy buys stocks outperforming their own sector peers on a 12-month return basis, stripping out sector trends to isolate stock-level momentum. The result: 10.29% annual return versus the S&P 500 benchmark's 8.01%, with a max drawdown of -47.29% and 77.4% down capture.
Contents
The return story is solid. The risk story is better.
Method
- Data source: Ceta Research (FMP financial data warehouse)
- Universe: XETRA stocks, market cap > €500M
- Period: 2000–2025 (25 years, 103 quarterly periods)
- Rebalancing: Quarterly (January, April, July, October), equal weight
- Benchmark: S&P 500 Total Return (SPY), 8.01% CAGR over this period
- Transaction costs: 0.2% one-way (mid-cap tier for European market)
- Cash rule: Hold cash if fewer than 10 stocks qualify at a rebalance date
Signal construction: 1. Compute each stock's 12-month return, skipping the most recent month (12M-1M per Jegadeesh & Titman 1993) 2. Compute the equal-weighted sector average across qualifying XETRA stocks 3. Relative strength = stock return minus sector average return 4. Buy top 30 by relative strength, equal weight
Data quality guards: Minimum price €1.0, maximum raw signal 500% (filters split-adjustment artifacts), maximum single-period return 200%.
4 of 103 quarters were cash periods (4%). XETRA is one of the most consistent exchanges in the dataset.
Performance

| Metric | Strategy | SPY |
|---|---|---|
| CAGR (2000–2025) | 10.29% | 8.01% |
| Excess CAGR | +2.27% | — |
| Sharpe Ratio | 0.433 | 0.354 |
| Max Drawdown | -47.29% | — |
| Down Capture | 77.4% | 100% |
| Cash Periods | 4/103 (4%) | — |
| Avg Stocks Held | 29.6 | — |
| Avg Active Sectors | 9.0 | — |
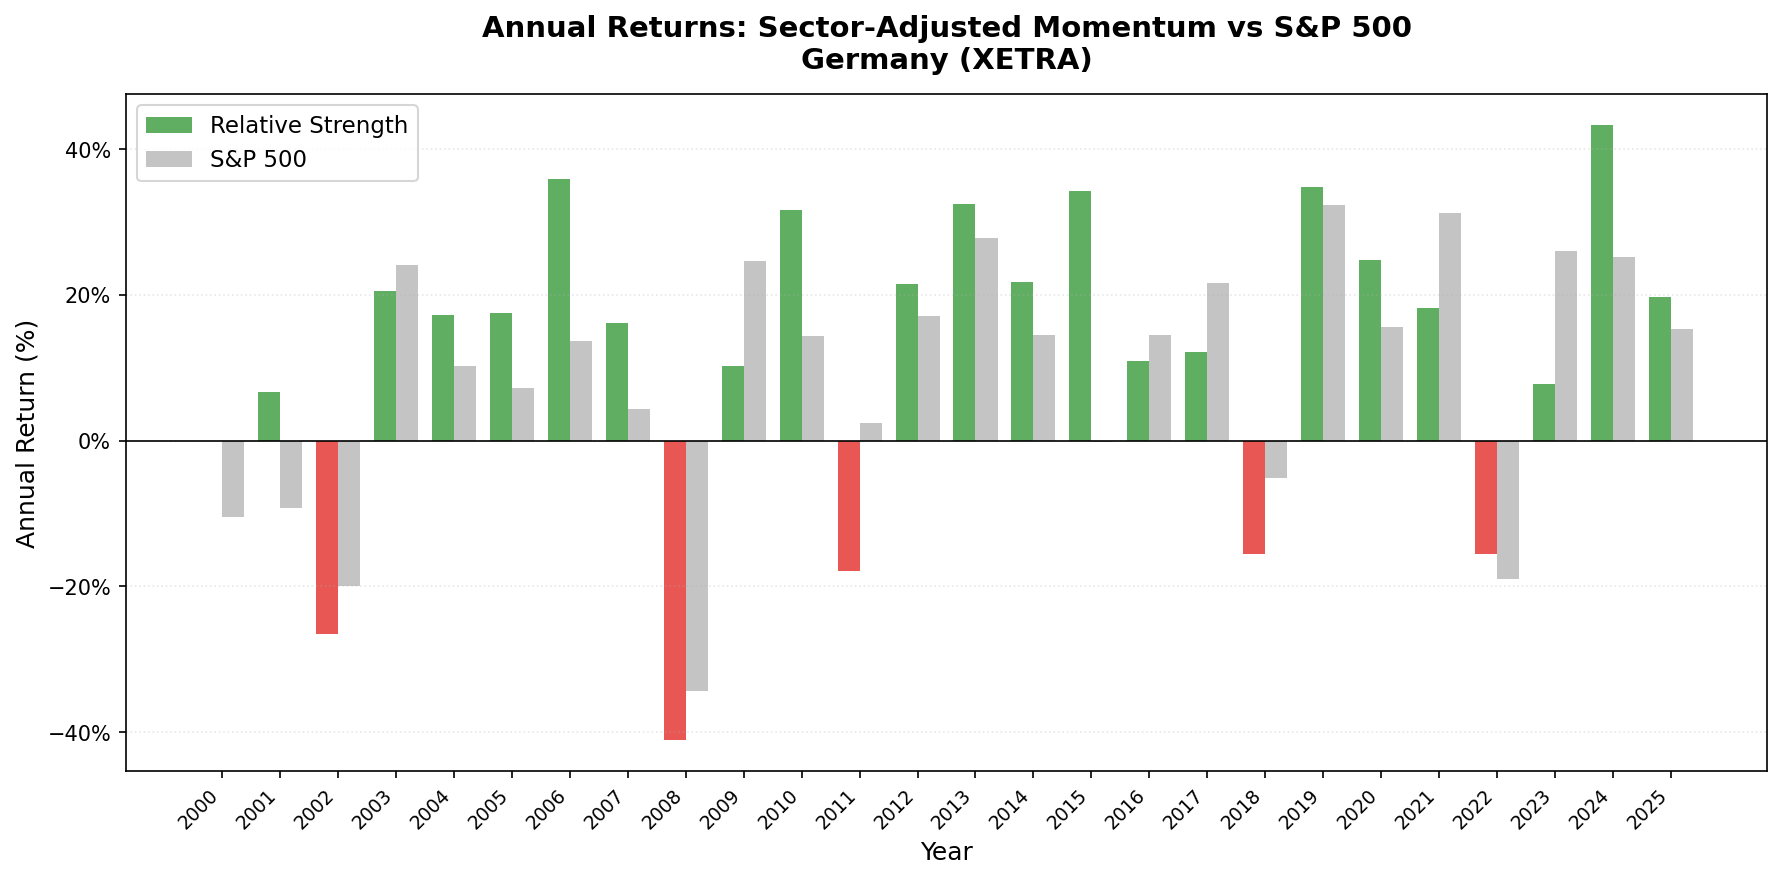
77.4% down capture means that when the S&P 500 fell, the German RS portfolio fell about 77 cents for every dollar the market dropped. Over 25 years of bear markets and corrections, that's a real structural advantage. It compounds: spending less time in deep drawdowns means more capital base to recover from.
Why Germany Works
XETRA has the highest sector diversity of any exchange in this dataset: 9.0 average active sectors at rebalance dates. That matters for the RS signal.
With 9 sectors consistently represented in the universe, the sector adjustment does genuine work. A chemicals stock is compared to other chemicals and materials companies. An automotive name is measured against automotive and industrial peers. The relative strength score reflects real competitive positioning within the sector, not just a rising or falling tide.
Germany also has a deep universe of mid-cap industrial and specialty companies that aren't well-covered by major indices or research firms. These are exactly the stocks where momentum signals tend to persist, information diffuses slowly, and price adjustment takes time.
The resulting portfolio has minimal sector concentration. It tends to pull 2–4 stocks from each of 8–9 sectors, which spreads drawdown risk. When a sector corrects sharply, the portfolio doesn't get hit disproportionately.
The XETRA Universe
XETRA is the primary trading venue for German equities and includes stocks from across the EU that have chosen German listing. The DAX 40 is the headline index, but the RS strategy operates across the much larger universe above €500M market cap, several hundred stocks at most rebalance dates.
The industrial and materials weight in Germany means the RS portfolio isn't dominated by technology (as it would be on NASDAQ). Germany's equity market is structurally more balanced: you get exposure to Industrials, Financials, Consumer Cyclical, Healthcare, and Technology in roughly similar proportions.
The Current Screen
This SQL runs on live XETRA data and replicates the backtest signal.
WITH universe AS (
    SELECT p.symbol, p.companyName, p.exchange, p.sector,
           k.marketCap / 1e9 AS market_cap_billions
    FROM profile p
    JOIN key_metrics_ttm k ON p.symbol = k.symbol
    WHERE k.marketCap > 500000000000        -- €500M (adjust for EUR/USD)
      AND p.isActivelyTrading = true
      AND p.sector IS NOT NULL AND p.sector != ''
      AND p.exchange = 'XETRA'
),
price_1m_ago AS (
    SELECT symbol, adjClose AS price_1m,
           ROW_NUMBER() OVER (PARTITION BY symbol
               ORDER BY ABS(CAST(dateEpoch AS BIGINT) -
                   CAST(EXTRACT(EPOCH FROM (CURRENT_DATE - INTERVAL '30' DAY))::BIGINT AS BIGINT))
           ) AS rn
    FROM stock_eod
    WHERE date BETWEEN CURRENT_DATE - INTERVAL '45' DAY AND CURRENT_DATE - INTERVAL '15' DAY
      AND adjClose > 1.0
),
price_12m_ago AS (
    SELECT symbol, adjClose AS price_12m,
           ROW_NUMBER() OVER (PARTITION BY symbol
               ORDER BY ABS(CAST(dateEpoch AS BIGINT) -
                   CAST(EXTRACT(EPOCH FROM (CURRENT_DATE - INTERVAL '365' DAY))::BIGINT AS BIGINT))
           ) AS rn
    FROM stock_eod
    WHERE date BETWEEN CURRENT_DATE - INTERVAL '395' DAY AND CURRENT_DATE - INTERVAL '335' DAY
      AND adjClose > 1.0
),
raw_momentum AS (
    SELECT u.symbol, u.companyName, u.exchange, u.sector, u.market_cap_billions,
           ROUND((p1m.price_1m - p12.price_12m) / p12.price_12m * 100, 1) AS raw_mom_pct
    FROM universe u
    JOIN price_12m_ago p12 ON u.symbol = p12.symbol AND p12.rn = 1
    JOIN price_1m_ago p1m  ON u.symbol = p1m.symbol  AND p1m.rn = 1
    WHERE p12.price_12m > 1.0 AND p1m.price_1m > 1.0
),
sector_avg AS (
    SELECT sector, COUNT(*) AS sector_count, AVG(raw_mom_pct) AS sector_avg_mom
    FROM raw_momentum
    GROUP BY sector
    HAVING COUNT(*) >= 5
)
SELECT m.symbol, m.companyName, m.exchange, m.sector,
       ROUND(m.market_cap_billions, 2) AS market_cap_billions,
       m.raw_mom_pct,
       ROUND(s.sector_avg_mom, 1) AS sector_avg_pct,
       ROUND(m.raw_mom_pct - s.sector_avg_mom, 1) AS relative_strength_pct,
       s.sector_count
FROM raw_momentum m
JOIN sector_avg s ON m.sector = s.sector
ORDER BY relative_strength_pct DESC
LIMIT 30
Run it on the Ceta Research Data Explorer.
By the Numbers
- Period: 2000–2025 (25 years, 103 quarterly periods)
- Strategy CAGR: 10.29%
- SPY benchmark CAGR: 8.01%
- Excess CAGR: +2.27%
- Sharpe ratio: 0.433
- Max drawdown: -47.29%
- Down capture: 77.4% (absorbed 77.4% of S&P 500 bear market losses)
- Cash periods: 4 of 103 (4%)
- Average stocks held: 29.6 of 30 target
- Average active sectors: 9.0
Academic Basis
Moskowitz, T. & Grinblatt, M. (1999). "Do Industries Explain Momentum?" Journal of Finance, 54(4), 1249-1290. Showed that roughly half of raw momentum profits come from industry-level trends. The RS signal isolates the stock-specific component.
Jegadeesh, N. & Titman, S. (1993). "Returns to Buying Winners and Selling Losers." Journal of Finance, 48(1), 65-91. The foundational momentum paper establishing the 12M skip-1M lookback.
Data: Ceta Research (FMP financial data warehouse). Backtest period 2000–2025 on XETRA.


