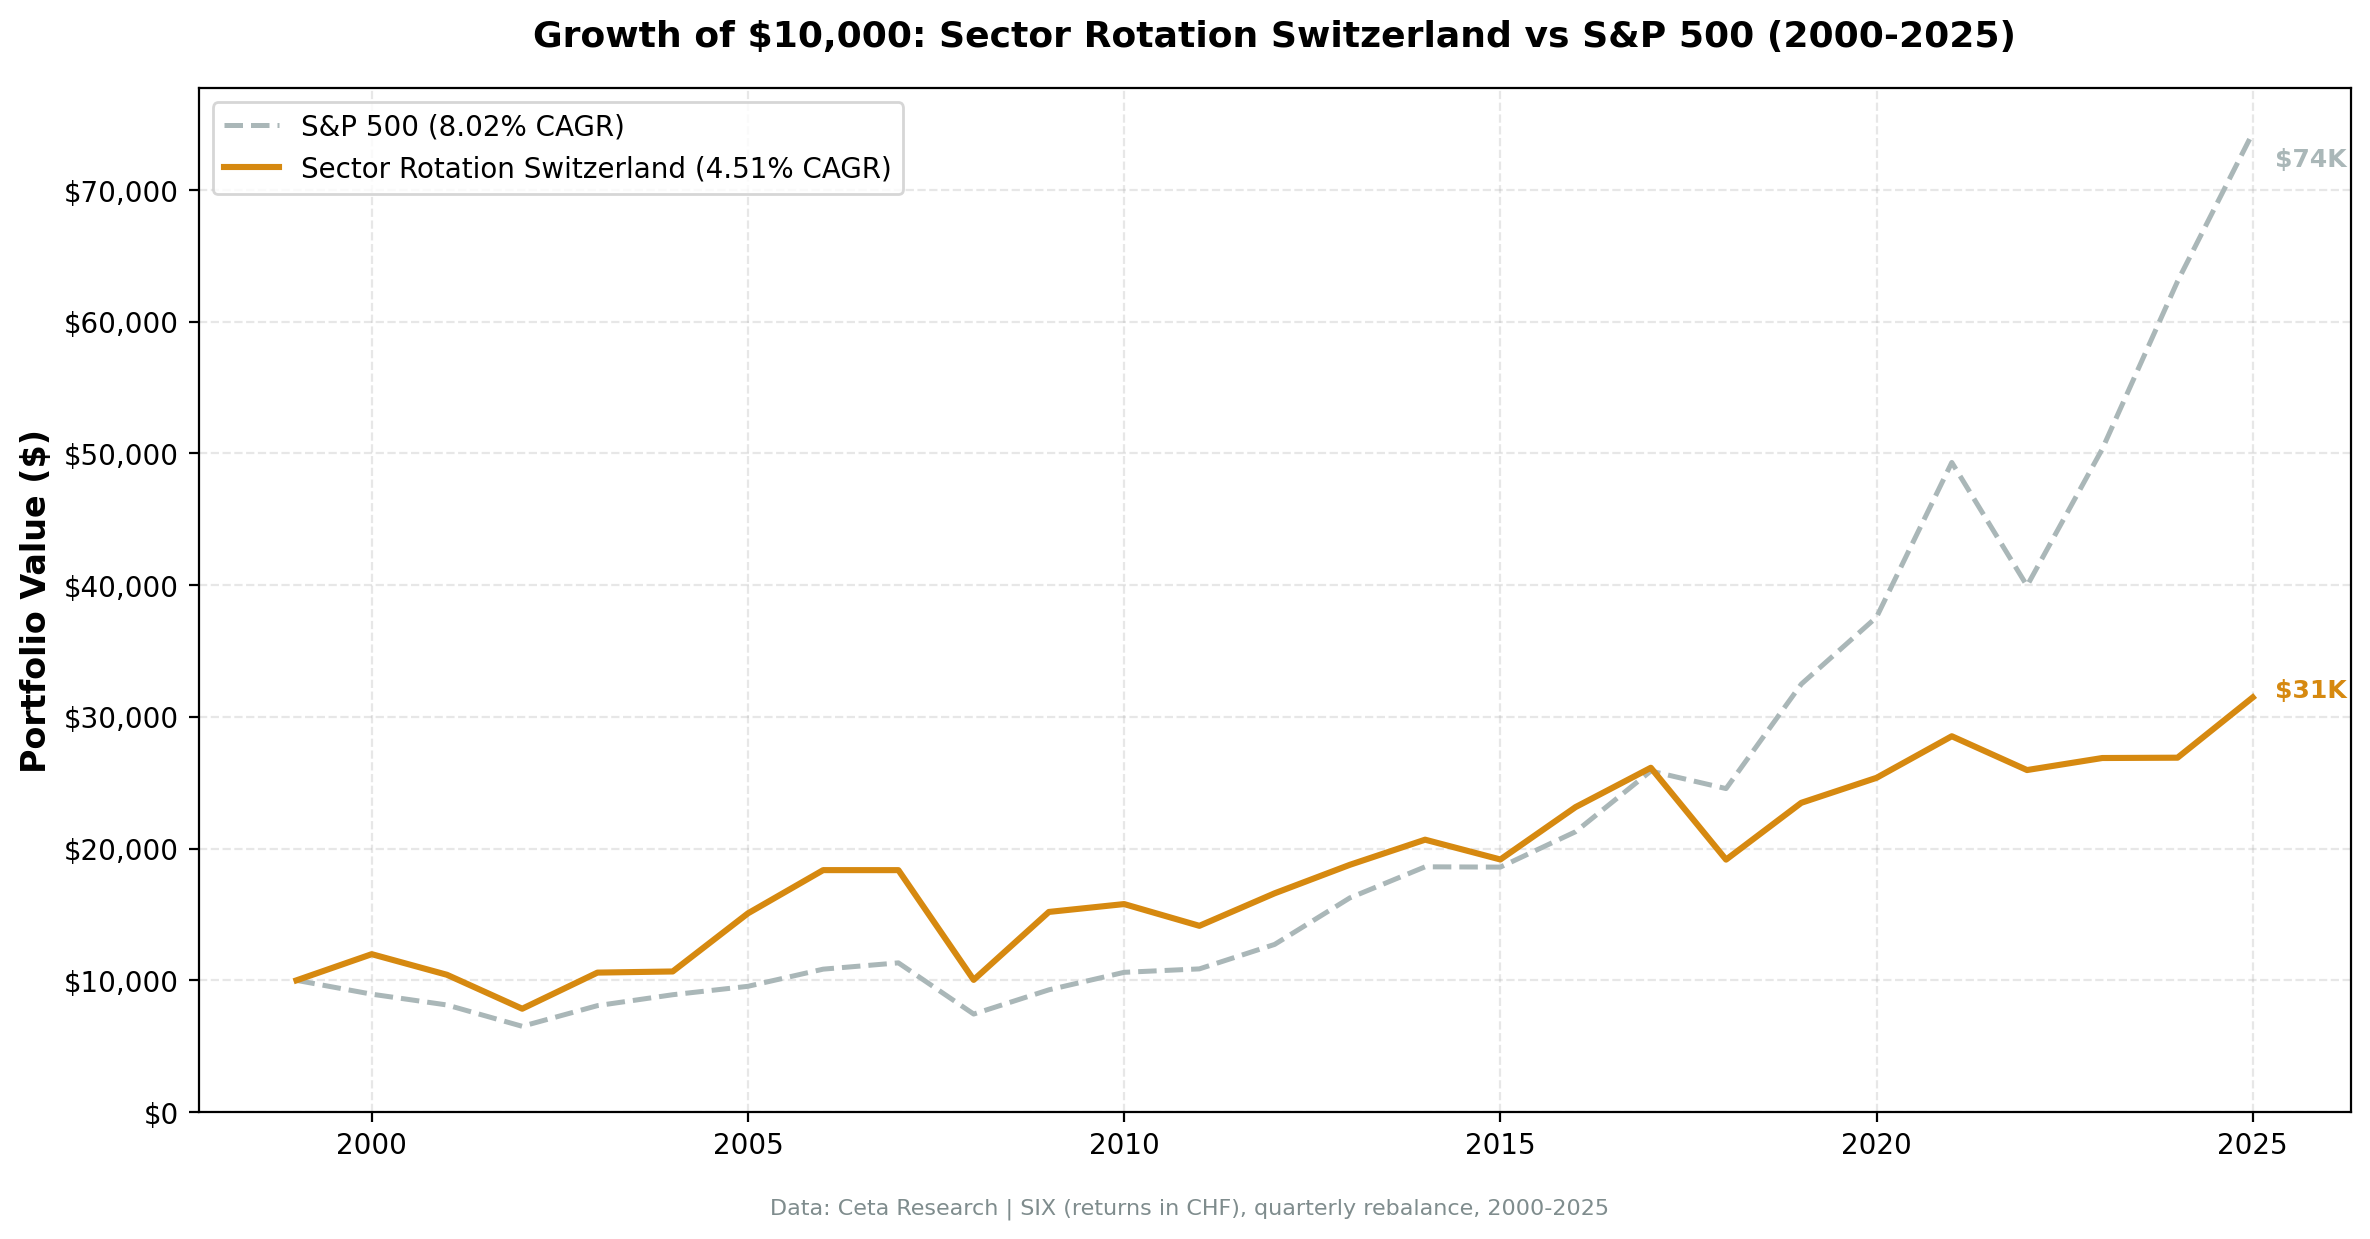
Sector Mean Reversion on Switzerland: 4.51% CAGR, -3.51% vs S&P 500


Switzerland's sector rotation strategy returned 4.51% annually from 2000 to 2025, in CHF, against the S&P 500's 8.02%. That's -3.51% annual underperformance, the worst excess return of any exchange in this study. It has the lowest Calmar ratio (0.075), the lowest up capture (76.03%), and still managed a max drawdown of -59.82%.
Contents
- Method
- What Is Sector Mean Reversion?
- What We Found
- Most Frequently Selected Sectors
- Run This Screen Yourself
- Notable Years
- Full Annual Returns
- Backtest Methodology
- Limitations
- Takeaway
- Part of a Series
- References
We tested sector mean reversion on 14 exchanges. Switzerland is the bottom of the ranking. This post covers what the data shows and why Switzerland's market structure makes this strategy structurally unsuitable.
Method
- Data source: Ceta Research (FMP financial data warehouse)
- Universe: SIX (Swiss Exchange), market cap > CHF 500M
- Period: 2000-2025 (26 years, 104 quarterly rebalance periods)
- Rebalancing: Quarterly (January, April, July, October)
- Signal: Buy all stocks in the bottom 2 sectors by 12-month trailing equal-weighted return
- Benchmark: S&P 500 Total Return (SPY)
- Cash rule: Hold cash if fewer than 2 qualifying sectors exist
- Transaction costs: Size-tiered model
Historical price data with 1-day lag. Full methodology: backtests/METHODOLOGY.md
What Is Sector Mean Reversion?
The idea is simple: sectors that underperform for 12 months are more likely to recover over the next quarter than sectors that just had a strong year. You buy the bottom 2 sectors by trailing return, hold for a quarter, rebalance, repeat.
It works when underperformance is temporary. A sector gets hit by sentiment, a macro headwind, or an earnings miss. The fundamentals are intact, prices overshoot, and capital rotates back in. That's the trade.
It doesn't work when underperformance is structural. A sector is down because the underlying businesses are deteriorating. There's no snap-back because there's no temporary mispricing to correct.
Switzerland's market is almost entirely the second case.
What We Found
SIX has the lowest up capture of any exchange in the study at 76.03%. In good markets, the portfolio only captures 76 cents of every dollar SPY gains. The down capture of 82.88% provides some protection during crashes, but not nearly enough to offset the persistent underperformance in bull markets. The result is a 4.51% CAGR against 8.02% for the benchmark over 26 years.
The Calmar ratio of 0.075 is the lowest in the study. Return per unit of drawdown risk is minimal.
| Metric | Portfolio | S&P 500 (SPY) |
|---|---|---|
| CAGR | 4.51% | 8.02% |
| Excess CAGR vs SPY | -3.51% | — |
| Max Drawdown | -59.82% | -45.53% |
| Annualized Volatility | 19.66% | — |
| Sharpe Ratio | 0.204 | 0.357 |
| Sortino Ratio | 0.314 | — |
| Calmar Ratio | 0.075 | — |
| Up Capture | 76.03% | — |
| Down Capture | 82.88% | — |
| Win Rate vs SPY | 41.35% | — |
| Avg Stocks per Period | 41.5 | — |
| Cash Periods | 3 of 104 (3%) | — |
A CHF 10,000 investment in January 2000 grew less than the same amount invested in SPY by end of 2025.
Most Frequently Selected Sectors
Over 101 invested quarters, these were the sectors that appeared most often as the bottom two by trailing return:
| Sector | Quarters Selected |
|---|---|
| Consumer Cyclical | 36 (36%) |
| Healthcare | 29 (29%) |
| Financial Services | 28 (28%) |
| Real Estate | 27 (27%) |
| Consumer Defensive | 21 (21%) |
| Basic Materials | 20 (20%) |
Consumer Cyclical and Healthcare together account for the majority of selection. That's the core of the problem.
Consumer Cyclical on SIX is Swiss luxury goods and premium consumer brands. Think Richemont, Swatch, Straumann. These stocks underperform when global consumer demand slows. When global demand slows, it often stays slow for several quarters before recovering, and the recovery is uneven. Buying into beaten-down luxury goods and watches because they've had a bad 12 months doesn't consistently work.
Healthcare is Novartis, Roche, Alcon, Lonza. Swiss pharma in the bottom 2 sectors typically signals a pipeline setback, patent expiry cycle, or pricing pressure. These are multi-year structural headwinds, not temporary sentiment gaps. The mean reversion signal fires, but the mean it's reverting to is lower than it was before.
Run This Screen Yourself
To see which SIX stocks are currently in the bottom 2 sectors by trailing return, run this on Ceta Research Data Explorer:
WITH sector_returns AS (
 SELECT
 p.sector,
 AVG(
 (s.adjClose - s_lag.adjClose) / NULLIF(s_lag.adjClose, 0)
 ) AS trailing_12m_return,
 COUNT(DISTINCT p.symbol) AS stock_count
 FROM profile p
 JOIN stock_eod s ON p.symbol = s.symbol
 AND s.date = CURRENT_DATE - INTERVAL '1 day'
 JOIN stock_eod s_lag ON p.symbol = s_lag.symbol
 AND s_lag.date = CURRENT_DATE - INTERVAL '366 days'
 WHERE p.exchange IN ('SIX')
 AND p.marketCap > 500000000
 AND p.sector IS NOT NULL
 AND p.isActivelyTrading = true
 GROUP BY p.sector
 HAVING COUNT(DISTINCT p.symbol) >= 3
),
ranked_sectors AS (
 SELECT
 sector,
 trailing_12m_return,
 stock_count,
 RANK() OVER (ORDER BY trailing_12m_return ASC) AS sector_rank
 FROM sector_returns
)
SELECT
 p.symbol,
 p.companyName,
 p.sector,
 p.marketCap,
 rs.trailing_12m_return AS sector_12m_return,
 rs.sector_rank
FROM profile p
JOIN ranked_sectors rs ON p.sector = rs.sector
WHERE rs.sector_rank <= 2
 AND p.exchange IN ('SIX')
 AND p.marketCap > 500000000
 AND p.isActivelyTrading = true
ORDER BY rs.sector_rank, p.marketCap DESC;
Notable Years
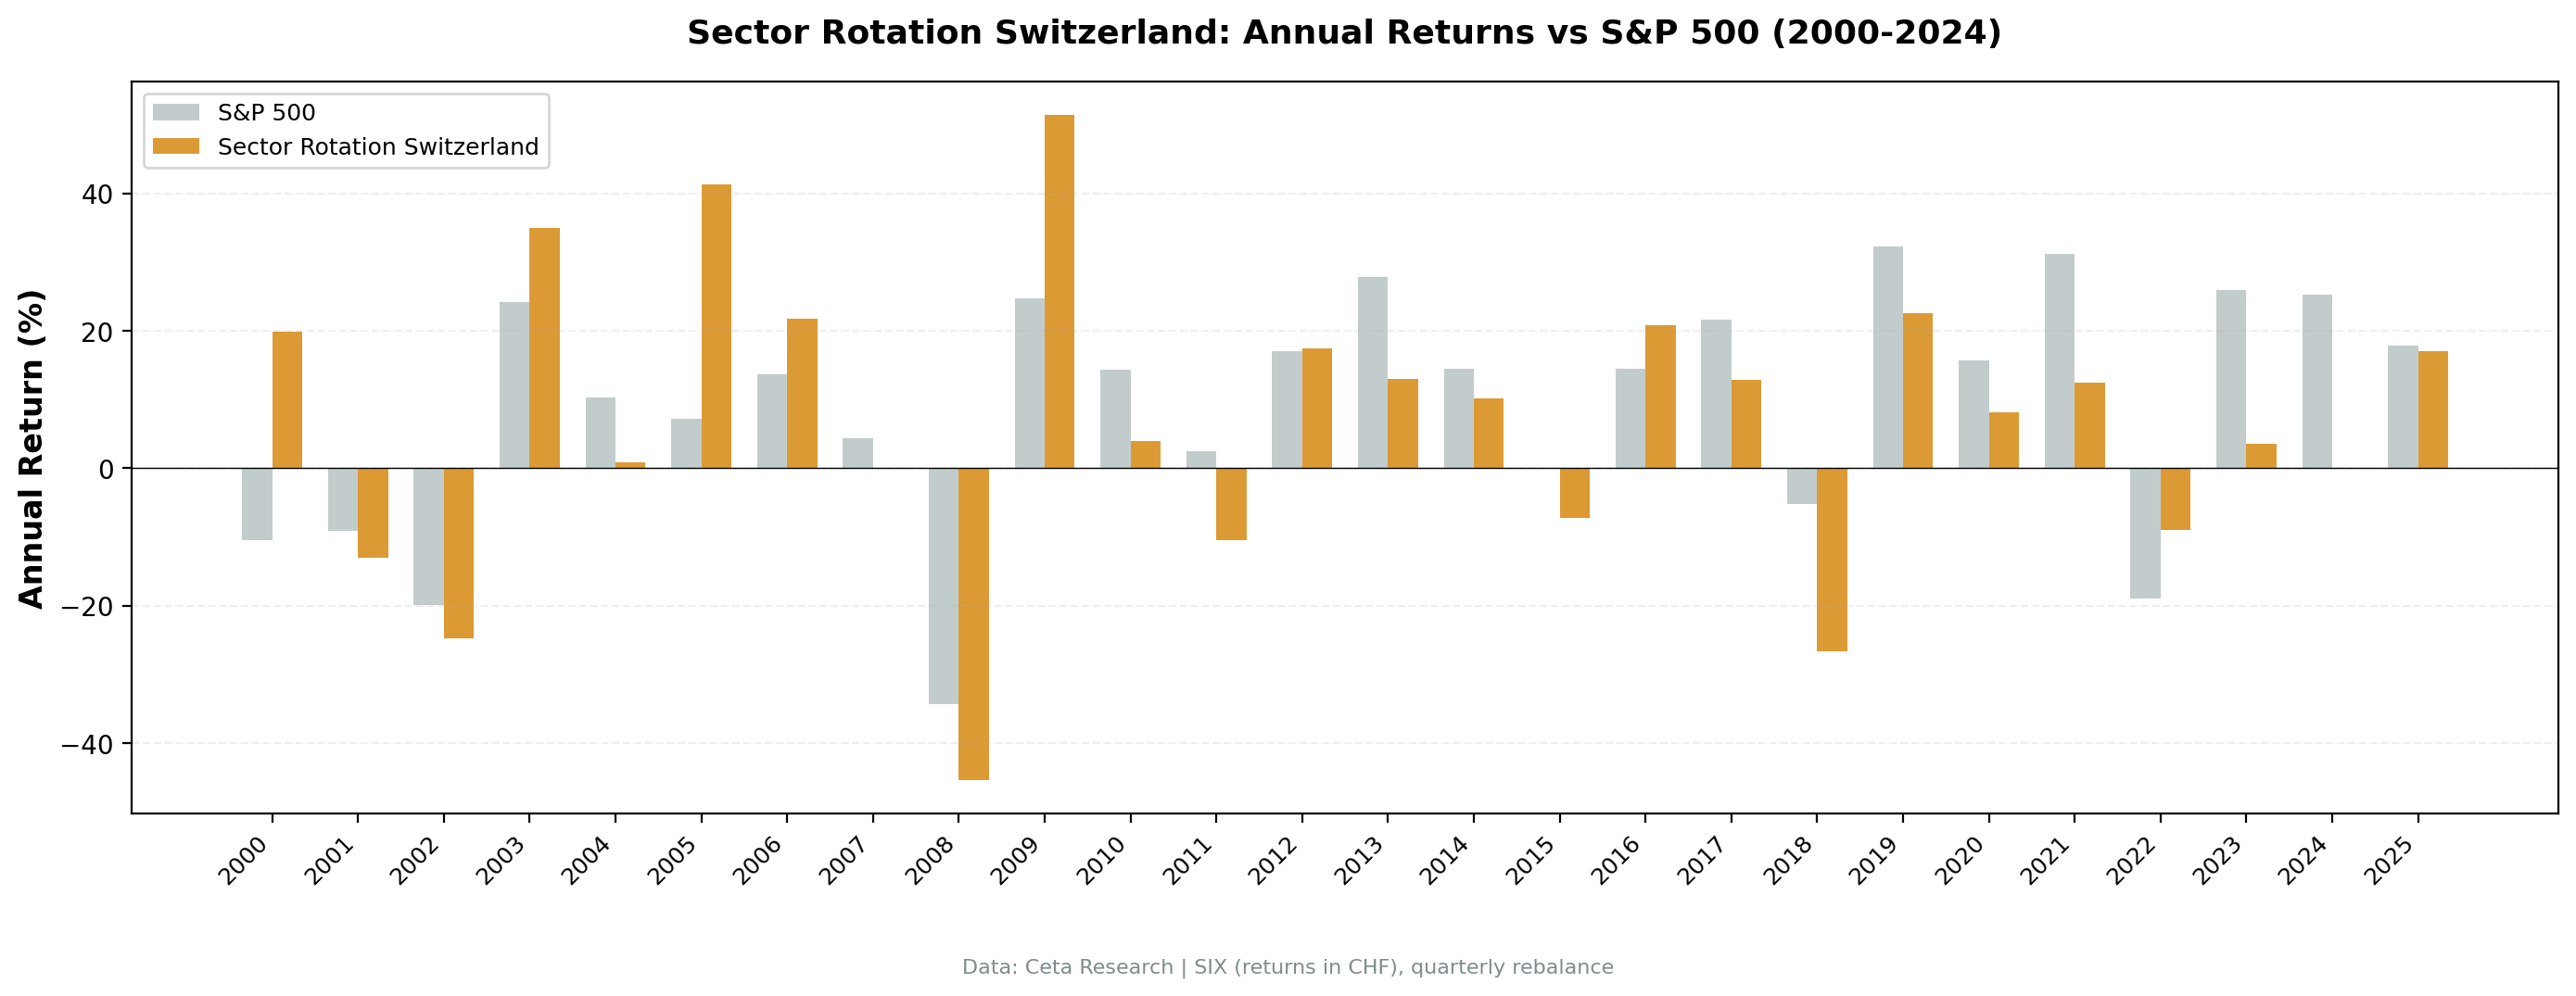
2000: +19.87%. The strategy outperformed SPY by +30.37%. This was one of only two years where the Swiss rotation signal worked well. The tech-heavy S&P 500 fell -10.5% while Swiss defensive sectors held. Early outperformance gave the strategy a good start.
2005: +41.34%. The best absolute year in the dataset. +34.17% excess over SPY as the strategy caught a global industrial cycle upturn. Basic Materials and Consumer Cyclical both recovered from prior underperformance. This is what the strategy looks like when it works.
2018: -26.68%. The worst year in the dataset. SPY fell -5.15%, but the SIX portfolio fell -26.68%, producing -21.53% excess underperformance. Healthcare (Novartis, Roche) and Consumer Cyclical stocks that had been beaten down in 2017 continued falling through 2018. The signal identified genuine structural weakness and held into it.
2023-2024: -22.48% and -25.19% excess. Two consecutive years of severe underperformance. SPY returned +26.0% and +25.28% respectively as US tech and AI-adjacent stocks drove the rally. The SIX portfolio held Swiss defensive sectors that didn't participate. When the benchmark is driven by a narrow set of high-growth names that have no equivalent in Switzerland's market, any sector rotation signal on SIX will lag by design.
Full Annual Returns
| Year | Portfolio | SPY | Excess |
|---|---|---|---|
| 2000 | +19.87% | -10.50% | +30.37% |
| 2001 | -13.06% | -9.17% | -3.89% |
| 2002 | -24.73% | -19.92% | -4.81% |
| 2003 | +34.97% | +24.12% | +10.85% |
| 2004 | +0.81% | +10.24% | -9.43% |
| 2005 | +41.34% | +7.17% | +34.17% |
| 2006 | +21.76% | +13.65% | +8.11% |
| 2007 | -0.01% | +4.40% | -4.41% |
| 2008 | -45.36% | -34.31% | -11.05% |
| 2009 | +51.40% | +24.73% | +26.67% |
| 2010 | +3.93% | +14.31% | -10.38% |
| 2011 | -10.46% | +2.46% | -12.92% |
| 2012 | +17.46% | +17.09% | +0.37% |
| 2013 | +13.03% | +27.77% | -14.74% |
| 2014 | +10.16% | +14.50% | -4.34% |
| 2015 | -7.27% | -0.12% | -7.15% |
| 2016 | +20.75% | +14.45% | +6.30% |
| 2017 | +12.89% | +21.64% | -8.75% |
| 2018 | -26.68% | -5.15% | -21.53% |
| 2019 | +22.51% | +32.31% | -9.80% |
| 2020 | +8.08% | +15.64% | -7.56% |
| 2021 | +12.44% | +31.26% | -18.82% |
| 2022 | -9.00% | -18.99% | +9.99% |
| 2023 | +3.52% | +26.00% | -22.48% |
| 2024 | +0.09% | +25.28% | -25.19% |
| 2025 | +17.01% | +17.88% | -0.87% |
The win rate of 41.35% is visible in the table. Switzerland beats SPY in fewer than half of all years. The scattered outperformance in 2000, 2003, 2005, 2006, 2009, and 2016 is real, but it's not enough to offset the persistent drag in the other 15 years.
Backtest Methodology
| Parameter | Value |
|---|---|
| Strategy | Sector Mean Reversion |
| Signal | Bottom 2 sectors by 12-month trailing EW return |
| Rebalancing | Quarterly (Jan, Apr, Jul, Oct) |
| Weighting | Equal weight within selected sectors |
| Universe | SIX (Swiss Exchange), market cap > CHF 500M |
| Period | 2000-2025 (26 years, 104 quarters) |
| Benchmark | SPY (S&P 500 Total Return) |
| Cash rule | Hold cash if fewer than 2 qualifying sectors |
| Transaction costs | Size-tiered model |
| Academic basis | Moskowitz & Grinblatt (1999) |
Limitations
Currency. All returns are in CHF. The S&P 500 benchmark is in USD. The Swiss franc is a safe-haven currency that tends to appreciate during global risk-off periods, which can mechanically reduce CHF returns when the benchmark recovers in USD. The 2009 +51.40% return is partly a function of CHF movements during the crisis recovery.
Mega-cap concentration. Switzerland's market is effectively 3-4 stocks: Nestlé, Novartis, Roche, UBS. Each dominates its sector. When Healthcare is the bottom 2 sector, that mostly means Novartis and Roche had a bad year. When Consumer Defensive is selected, it often means Nestlé underperformed. These aren't temporary dislocations. They're large-cap stocks with analyst coverage measured in the dozens, and when they're down, there's usually a reason.
Structural vs. cyclical underperformance. Mean reversion works on cyclical dislocations. Switzerland's dominant sectors (Healthcare, Consumer Defensive) are acyclical. Their underperformance periods tend to reflect patent cycles, pipeline failures, and pricing headwinds, not temporary sentiment swings.
Low up capture is the real problem. The 19.66% annualized volatility is the lowest in the study, which sounds like a feature. But 76.03% up capture means the strategy only participates in 76% of S&P 500 gains while holding 82.88% of losses. You don't get compensated for the low volatility with crash protection. You get low volatility and still miss most of the upside.
2023-2024 consecutive underperformance. Two years of -22% and -25% excess aren't noise. When the benchmark is driven by a specific theme (AI, US megacap tech) that has no equivalent in Switzerland's universe, the sector rotation signal will consistently select the wrong sectors. This is a structural misalignment between the strategy and the benchmark, not a signal failure.
Takeaway
Sector mean reversion on SIX returns 4.51% annually over 26 years against 8.02% for SPY. It's the worst result in the study by excess return, Calmar ratio, and up capture. The strategy works best in markets where sector dislocations are cyclical and recoveries are driven by domestic fundamentals. Switzerland's market is too concentrated in mega-caps with structural, multi-year headwinds for the rotation signal to work reliably.
There are individual years where Switzerland works well: 2005 (+34.17% excess), 2009 (+26.67% excess), and 2000 (+30.37% excess). But these are exceptions in a 26-year track record where the strategy beats SPY in only 41.35% of years.
If you're running sector mean reversion globally, Switzerland is the exchange to skip.
Part of a Series
We tested this strategy across 14 exchanges. Other analyses in the series:
- US (NYSE + NASDAQ + AMEX) →
- India (BSE + NSE) →
- Korea (KSC) →
- Taiwan (TAI + TWO) →
- Sweden (STO) →
- Global comparison →. All 14 exchanges ranked by Sharpe, CAGR, and down capture
References
Moskowitz, T. J., & Grinblatt, M. (1999). Do industries explain momentum? Journal of Finance, 54(4), 1249–1290.
Data: Ceta Research (FMP financial data warehouse), 2000-2025. Universe: SIX (Swiss Exchange). Market cap > CHF 500M. Returns in CHF. Benchmark: SPY (USD). Full methodology: METHODOLOGY.md. Past performance doesn't guarantee future results.