
Sector Momentum in Japan: 8.73% CAGR, +26.14% Relative Return in 2008 (JPX)
Japan's sector momentum portfolio returned -12.31% in 2008 while the Nikkei 225 fell -38.45%, a +26.14% gap. Over 26 years: 8.73% CAGR, +4.80% excess, +6.05% alpha at a beta of 0.674. Lowest down capture of our 13 markets at 45.37%.

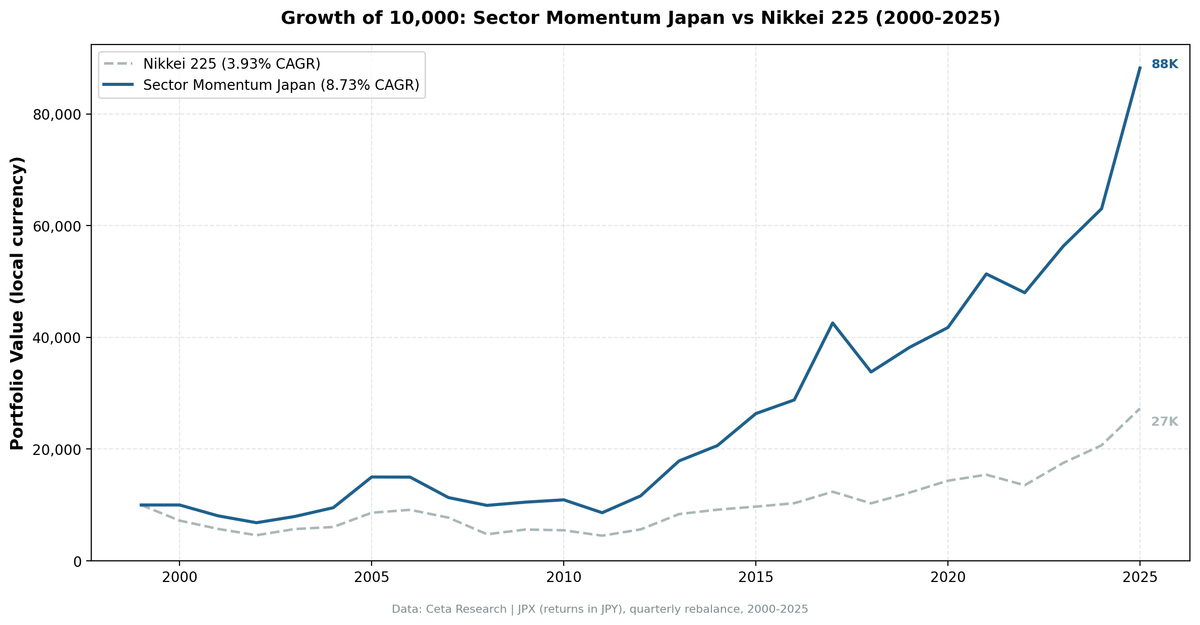
In 2008, the global financial system nearly collapsed. The Nikkei 225 fell 38.45%. Japan's sector momentum portfolio fell 12.31%. That +26.14% relative return in the worst year of the century tells you most of what you need to know about how this strategy behaves in Japanese markets.
Contents
- The Strategy
- Results
- Japan's Sector Rotation Structure
- The Years That Define the Strategy
- Full Annual Returns
- Limitations
Five years later, Abenomics hit. Japan's government launched the largest domestic stimulus program in its post-war history. Real Estate and Healthcare surged. The portfolio returned +53.81% in 2013 while the Nikkei returned +48.85%. The two years together capture the core structure of Japan's sector rotation: domestic-facing sectors that don't move with global credit cycles and do respond to Japanese policy.
Over 26 years, the strategy produced 8.73% CAGR versus 3.93% for the Nikkei 225, with a down capture of 45.37%. The Sharpe of 0.461 and Sortino of 0.778 reflect a strategy that protected capital in down markets while participating partially in up markets.
Data: FMP financial data warehouse, 2000-2025. Updated August 2026.
The Strategy
Each quarter, we rank all 11 GICS sectors by their equal-weighted 12-month trailing return across JPX-listed stocks. We hold stocks from the top 2 sectors, equal-weighted, rebalanced quarterly. Stocks must clear an exchange-specific market cap threshold. Entry is at the close of the day after each rebalance date. Transaction costs are size-tiered by market cap, from 0.1% to 0.5% one-way.
Full methodology: backtests/METHODOLOGY.md
| Parameter | Value |
|---|---|
| Universe | JPX (Japan Exchange Group) |
| Signal | Top 2 sectors by trailing 12-month equal-weighted return |
| Selection | All qualifying stocks in those sectors |
| Rebalancing | Quarterly |
| Period | 2000-2025 (26 years, 104 quarters) |
| Execution | Next-day close after each rebalance date |
| Cash rule | Cash if fewer than 5 sectors qualify or fewer than 10 stocks pass |
| Cash periods | 4 of 104 (4%) |
| Avg stocks held | 122.9 (when invested) |
| Benchmark | Nikkei 225 (JPY) |
| Transaction costs | Size-tiered by market cap, 0.1% to 0.5% one-way |
| Data source | Ceta Research (FMP financial data warehouse) |
The tier is a one-way rate and the model charges a full round trip every quarter, on every holding, even when a sector stays in the top 2 and the position carries over untouched. That's deliberately conservative: real turnover is lower than the cost model assumes.
Returns are in JPY. The Nikkei 225 is also JPY, so this is an apples-to-apples comparison.
Results
| Metric | Portfolio | Nikkei 225 (JPY) |
|---|---|---|
| CAGR (2000-2025) | 8.73% | 3.93% |
| Excess CAGR | +4.80% | |
| Alpha (Jensen) | +6.05% | |
| Total return | 782% | 173% |
| ¥10K grows to | ¥88,227 | ¥27,281 |
| Max drawdown | -47.48% | -61.06% |
| Annualized volatility | 18.73% | 21.12% |
| Sharpe ratio | 0.461 | |
| Sortino ratio | 0.778 | |
| Calmar ratio | 0.184 | |
| Up capture | 82.41% | |
| Down capture | 45.37% | |
| Beta | 0.674 | |
| Win rate vs Nikkei (quarterly) | 51.92% |
The down capture of 45.37% vs the Nikkei is the defining number. Japan's sector momentum portfolio fell under half of what the Nikkei fell in down periods on average. It's the lowest down capture of the 13 markets in this study. That protection is visible in the drawdown too: -47.48% against the Nikkei's -61.06%.
Up capture of 82.41% is the trade-off, and it's the lowest in the study as well. Japan gives up nearly a fifth of the index's upside to buy that downside protection. Over 26 years that trade came out ahead, but it means the strategy will look sluggish in any sustained Japanese bull market.
Japan's alpha exceeds its excess for the same reason. Raw excess is +4.80%; at a beta of 0.674 the portfolio carried a third less market risk than the index, so Jensen alpha comes out at +6.05%. The risk-adjusted edge is larger than the headline suggests.
Japan's Sector Rotation Structure
Japan's demographic reality is built into the rotation. An aging population creates durable healthcare demand. Decades of urban density and limited supply created persistent real estate tailwinds. Technology rode Japan's export cycle with global semiconductor and electronics demand.
| Sector | Quarters in Top 2 |
|---|---|
| Real Estate | 33 |
| Healthcare | 25 |
| Energy | 24 |
| Technology | 22 |
| Utilities | 19 |
| Communication Services | 19 |
| Consumer Defensive | 17 |
| Basic Materials | 15 |
| Industrials | 9 |
| Financial Services | 9 |
| Consumer Cyclical | 8 |
Real Estate led with 33 quarters. Healthcare, Energy and Technology follow at 25, 24 and 22. Real Estate alone holds a top-2 slot roughly a third of the time, which makes this closer to a persistent property tilt with a rotating second leg than a broad rotation.
Real Estate's dominance reflects the post-GFC recovery in Tokyo commercial property and residential REITs, driven by BOJ accommodation and Abenomics. Healthcare's persistence reflects Japan's demographic reality: the country has one of the oldest median populations in the world, and the healthcare sector has sustained multi-decade demand growth.
Consumer Cyclical and Industrials, which one might expect from Japan's manufacturing base, appeared in only 8 and 9 quarters. Japan's export industrials don't generate strong trailing momentum signals because their returns are often driven by JPY/USD exchange rate moves rather than sector fundamentals.
The Years That Define the Strategy
2000: Cash preservation during the dotcom crash. The strategy returned 0.00% while the Nikkei fell 27.95%. Japan stepped to cash. No sectors generated a sufficient momentum signal in a market still working through its own asset bubble aftermath. The result was capital preservation during a severe local market selloff, and the largest relative margin in the series at +27.95%.
2008: The standout result.
| Year | Portfolio | Nikkei 225 | Excess |
|---|---|---|---|
| 2008 | -12.31% | -38.45% | +26.14% |
| 2009 | +5.83% | +17.82% | -11.99% |
In 2008, Japan's Real Estate and Healthcare sectors held up while financials and energy collapsed globally. Japan's property market wasn't exposed to US subprime derivatives. Japan's healthcare companies served domestic demand. The strategy was already in those sectors and didn't need to rotate mid-crisis. The -12.31% loss is still real, but in the context of -38.45% for the Nikkei, the gap is exceptional.
The 2009 follow-through is the honest caveat. The portfolio returned +5.83% while the Nikkei bounced +17.82%. The strategy was positioned in sectors that recovered at a different pace. The 2008 protection came with a 2009 lag.
2017: the second-best relative year.
| Year | Portfolio | Nikkei 225 | Excess |
|---|---|---|---|
| 2017 | +47.82% | +19.97% | +27.85% |
A +27.85% margin, marginally larger than 2008's. Japan's domestic sectors ran hard while the index posted a solid but ordinary year.
2007: The Japan real estate unwind begins.
| Year | Portfolio | Nikkei 225 | Excess |
|---|---|---|---|
| 2007 | -24.46% | -15.34% | -9.12% |
Japan's real estate sector peaked in 2006-2007 and began unwinding. The strategy was still positioned in Real Estate based on prior momentum and took a -24.46% loss, its worst absolute year in the series, while the Nikkei fell 15.34%. This is the clearest example of momentum lag risk: the signal held sectors that were reversing because their trailing return was still positive from prior quarters.
2013: Abenomics.
| Year | Portfolio | Nikkei 225 | Excess |
|---|---|---|---|
| 2013 | +53.81% | +48.85% | +4.96% |
Prime Minister Abe's stimulus package, monetary easing, and structural reform agenda launched in late 2012. By 2013, Japanese equities were in a broad-based rally. Real Estate benefited from BOJ buying of J-REITs. The strategy was already in the momentum leaders, though in a broad rally like this the margin over the index is thin.
2015 and 2021: domestic momentum. +27.76% vs Nikkei +5.99% (+21.77% excess), then +22.98% vs +7.50% (+15.48%). Japan's domestic sectors ran on policy momentum while the broader index went quiet.
2022: Defensive positioning during global rate hikes.
| Year | Portfolio | Nikkei 225 | Excess |
|---|---|---|---|
| 2022 | -6.54% | -12.24% | +5.69% |
When global rate hikes hit equities, Japan's Real Estate and Healthcare sectors held value. The pattern from 2008 repeated in miniature.
2023: the worst relative year. +17.31% vs Nikkei +29.44%, a 12.13-point shortfall. A strong broad rally in Japanese equities left the two-sector portfolio behind, the same shape as 2009.
Full Annual Returns
| Year | Portfolio (JPY) | Nikkei 225 (JPY) | Excess |
|---|---|---|---|
| 2000 | +0.00% | -27.95% | +27.95% |
| 2001 | -19.39% | -20.59% | +1.21% |
| 2002 | -15.30% | -19.85% | +4.56% |
| 2003 | +16.36% | +24.24% | -7.88% |
| 2004 | +19.77% | +6.40% | +13.38% |
| 2005 | +57.76% | +42.06% | +15.70% |
| 2006 | -0.15% | +6.06% | -6.22% |
| 2007 | -24.46% | -15.34% | -9.12% |
| 2008 | -12.31% | -38.45% | +26.14% |
| 2009 | +5.83% | +17.82% | -11.99% |
| 2010 | +3.95% | -2.41% | +6.36% |
| 2011 | -21.14% | -17.68% | -3.46% |
| 2012 | +35.00% | +24.86% | +10.14% |
| 2013 | +53.81% | +48.85% | +4.96% |
| 2014 | +15.36% | +9.43% | +5.93% |
| 2015 | +27.76% | +5.99% | +21.77% |
| 2016 | +9.28% | +6.20% | +3.09% |
| 2017 | +47.82% | +19.97% | +27.85% |
| 2018 | -20.60% | -16.78% | -3.82% |
| 2019 | +13.02% | +18.62% | -5.60% |
| 2020 | +9.29% | +17.47% | -8.18% |
| 2021 | +22.98% | +7.50% | +15.48% |
| 2022 | -6.54% | -12.24% | +5.69% |
| 2023 | +17.31% | +29.44% | -12.13% |
| 2024 | +11.94% | +18.08% | -6.15% |
| 2025 | +39.97% | +31.87% | +8.11% |
The pattern across 26 years is clear. Japan outperforms in global down years (2000, 2002, 2008, 2022) and in Japan-specific policy cycles (2015, 2017, 2021). It underperforms when the Nikkei rallies broadly (2003, 2009, 2019, 2020, 2023) and when Japan's own property cycle turns (2006-2007). The strategy beat the Nikkei in 16 of 26 calendar years, and the quarterly win rate of 51.92% is close to a coin flip. The edge is in the size of the wins, not their frequency.
Limitations
Currency exposure. Returns are in JPY. USD-based investors face JPY/USD exposure. The yen has depreciated significantly against the dollar over parts of this period, which would reduce USD-equivalent returns materially in some years. The Nikkei comparison is apples-to-apples for JPY investors, but USD investors carry an additional currency layer.
The lowest up capture in the study. At 82.41%, Japan gives up more index upside than any other market tested. That's the price of a 45.37% down capture, and it means long stretches of a Japanese bull market will look disappointing.
The 2007-2009 sequence. -24.46% in 2007 followed by -12.31% in 2008 and only +5.83% in 2009 represents three years of compounded loss while the Nikkei bounced in 2009. Investors who entered Japan's sector momentum strategy in 2006 endured a difficult multi-year stretch before the recovery in 2012-2013.
Momentum lag. The 2007 loss is the clearest example of the core risk: a sector that ran strongly can generate a positive 12-month signal even as it begins to reverse. The strategy holds until the signal flips, meaning it participates in the early phase of reversals before rotating out.
Sector concentration. Real Estate alone held a top-2 slot in 33 of 104 quarters. Investors are not getting broad Japanese market exposure. They're making a concentrated bet on Japan's property and demographic themes. When those themes are out of favor, the strategy underperforms.
Cash drag. Four cash quarters out of 104 earn nothing. They cluster in the early period where FMP's Japanese coverage is thinnest, and one of them (2000) happens to produce the series' largest relative margin, so that year reads as a coverage artifact as much as a signal decision.
Data: Ceta Research (FMP financial data warehouse). Universe: JPX (Japan Exchange Group). Period: 2000-2025 (26 years), quarterly rebalance, next-day-close execution, returns in JPY. Past performance does not guarantee future results. This is educational content, not investment advice.
Part of the Sector Momentum Rotation series. US flagship blog

