
Korea Sector Momentum: 19.76% CAGR, +14.21% Excess Over KOSPI (2000-2025)
Korea sector momentum delivered 19.76% CAGR over 26 years, +14.21% above the KOSPI and the largest Jensen alpha of our 13 markets at +14.29%. It beat the local benchmark in 21 of 26 years while carrying less market risk than the index.

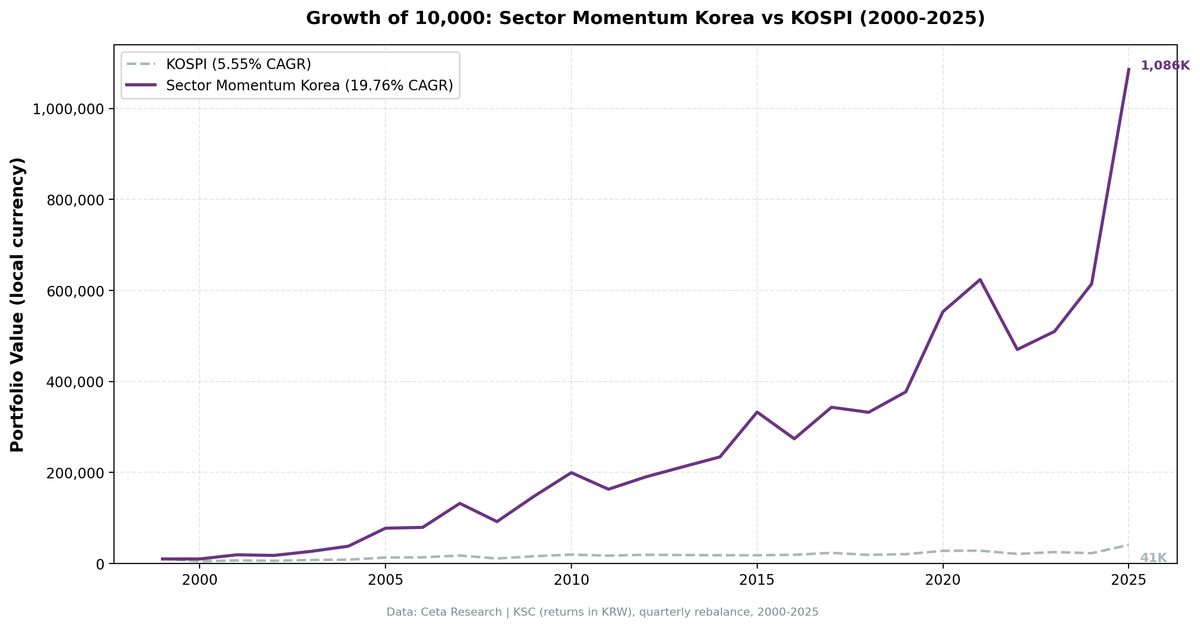
+14.21% per year over the KOSPI. That's the number that stops you.
Contents
- The Strategy
- Results
- Which Sectors Drive Korea's Rotation
- When It Works
- When It Struggles
- Full Annual Returns
- The Excess Return Explained
- Limitations
- References
Over 26 years, Korea's sector momentum rotation beat its own local benchmark by 14.21% annually. The CAGR of 19.76% against KOSPI's 5.55% reflects something structural: Consumer Defensive and Healthcare sectors in Korea rotate through multi-year cycles that domestic index weighting obscures. The strategy captures those cycles. The KOSPI doesn't.
₩10,000 growing to ₩1.09 million is remarkable. But the excess return tells you something more useful: where the returns come from and why Korea's sector rotation is structurally different from what you see in developed markets.
Data: FMP financial data warehouse, 2000-2025. Updated August 2026.
The Strategy
Same framework as the US flagship backtest. Each quarter, rank all GICS sectors on the Korea Stock Exchange (KSC) by their equal-weighted 12-month trailing return. Buy stocks from the top 2 sectors. Equal weight within the portfolio, exchange-specific market cap threshold applied.
The academic foundation is Moskowitz and Grinblatt (1999): industry-level momentum is persistent. When a sector catches a trend, that trend tends to outlast a single quarter. In Korea, sector trends tied to domestic demographics, export cycles, and regional consumption patterns appear to be especially durable.
| Parameter | Value |
|---|---|
| Universe | KSC (Korea Stock Exchange) |
| Period | 2000-2025 (26 years) |
| Rebalance | Quarterly |
| Signal | Equal-weighted 12M sector trailing return |
| Sectors held | Top 2 each quarter |
| Stock weighting | Equal weight within portfolio |
| Execution | Next-day close after each rebalance date |
| Cash rule | Cash if fewer than 5 sectors qualify or fewer than 10 stocks pass |
| Cash quarters | 4 of 104 (4%) |
| Avg stocks held | 54.6 (when invested) |
| Transaction costs | Size-tiered by market cap, 0.1% to 0.5% one-way |
The tier is a one-way rate and the model charges a full round trip every quarter, on every holding, even when a sector stays in the top 2 and the position carries over untouched. That's deliberately conservative: real turnover is lower than the cost model assumes.
Part of the Sector Momentum Rotation series. US flagship blog
Results
| Metric | Portfolio | KOSPI (benchmark) |
|---|---|---|
| CAGR | 19.76% | 5.55% |
| Excess return | +14.21% | |
| Alpha (Jensen) | +14.29% | |
| Total return | 10,758% | 307% |
| ₩10K grows to | ₩1,085,739 | ₩40,707 |
| Max drawdown | -39.86% | -52.73% |
| Annualized volatility | 28.65% | 23.74% |
| Sharpe ratio | 0.585 | |
| Sortino ratio | 1.304 | |
| Calmar ratio | 0.496 | |
| Up capture | 137.14% | |
| Down capture | 59.46% | |
| Beta vs KOSPI | 0.970 | |
| Win rate vs KOSPI (quarterly) | 65.38% |
Korea has the largest excess return and the largest Jensen alpha of the 13 markets in this study. Its Sharpe of 0.585 is second, a hair behind Canada's 0.591. The Sortino of 1.304, which penalizes only downside volatility, is the highest in the study. The portfolio carries high absolute volatility (it returned +90.98% in 2001 and +104.00% in 2005), but the downside portion of that volatility is small relative to the upside.
Korea is one of the cleaner results here because excess and alpha agree. At a beta of 0.970 the portfolio took slightly less market risk than the KOSPI, so its +14.21% excess survives risk adjustment almost untouched at +14.29% alpha. In markets where beta runs above 1.0, part of the headline excess is leverage. Not here.
A 65.38% quarterly win rate, and 21 of 26 calendar years ahead of the local benchmark, is what drives the long-run compounding.
Which Sectors Drive Korea's Rotation
| Sector | Quarters in Top 2 |
|---|---|
| Consumer Defensive | 34 |
| Healthcare | 33 |
| Consumer Cyclical | 23 |
| Industrials | 23 |
| Basic Materials | 23 |
| Energy | 20 |
| Technology | 19 |
| Communication Services | 11 |
| Financial Services | 9 |
| Real Estate | 5 |
Consumer Defensive and Healthcare together account for 67 of 208 top-2 slots across 104 quarters. This concentration isn't accidental. South Korea has one of the fastest-aging populations in the world. Healthcare demand compounds structurally regardless of global risk sentiment. Consumer Defensive captures domestic consumption from a population with high household savings and stable employment.
These sectors don't correlate tightly with global equity downturns, which is why the strategy beats KOSPI across both up and down cycles.
Technology appeared in only 19 quarters despite Korea's reputation as a tech-heavy market. The strategy's equal-weighting at sector level means Samsung and a handful of large-cap chip stocks don't dominate the signal the way they dominate the KOSPI index. When semiconductor cycles turn, the sector shows up in rotation. When they don't, Consumer Defensive and Healthcare carry the portfolio.
When It Works
2000: cash through the crash. The strategy held cash and returned 0.00% while the KOSPI fell 50.81%. Not enough sectors cleared the minimum to run the signal. Sitting out cost nothing and saved everything, which is the second-largest single-year margin in Korea's series.
2001: +90.98% vs KOSPI +39.16%. A recovery year where Korea's sector momentum was positioned in Consumer Defensive and Healthcare and captured a much larger share than the index. A +51.82% spread, the largest in Korea's series.
2005: +104.00% vs KOSPI +55.45%. Korea was in the middle of a domestic consumer boom. Consumer Defensive and Healthcare ran in parallel. The spread over the local index was +48.55%.
2007-2009 through the GFC. The portfolio returned +66.43% in 2007 vs KOSPI +29.14%, then held to -30.33% in 2008 when KOSPI fell -37.55%. The 2009 recovery was +60.62% versus KOSPI +46.55%. The strategy entered the crisis with momentum behind defensive names, which provided partial insulation, and came out of it early.
2015: +42.07% vs KOSPI -0.40%. A flat year for the Korean index. Korea's sector rotation was firing on domestic consumption themes, producing a 42-point spread.
2024: +20.50% vs KOSPI -10.15%. The index fell while the portfolio compounded, a +30.65% margin and the seventh-largest in the series.
When It Struggles
2016: -17.64% vs KOSPI +5.60%. The worst relative year in Korea's series, a 23.23-point shortfall. The sector signal was pointing into areas hit by political uncertainty around South Korea's domestic leadership crisis.
2023: +8.43% vs KOSPI +19.96%. The strategy returned well in absolute terms but trailed the index by 11.52 points.
2011: -18.25% vs KOSPI -11.77%. A down year where the portfolio fell further than the index, giving back 6.48 points.
2025: +76.70% vs KOSPI +79.65%. A huge absolute year that still came up 2.95 points short. The Korean index ran hard and the rotation nearly, but not quite, kept pace.
Full Annual Returns
| Year | Portfolio | KOSPI | Excess |
|---|---|---|---|
| 2000 | +0.00% | -50.81% | +50.81% |
| 2001 | +90.98% | +39.16% | +51.82% |
| 2002 | -6.99% | -12.38% | +5.40% |
| 2003 | +50.17% | +29.30% | +20.87% |
| 2004 | +42.57% | +8.82% | +33.75% |
| 2005 | +104.00% | +55.45% | +48.55% |
| 2006 | +2.35% | +3.31% | -0.96% |
| 2007 | +66.43% | +29.14% | +37.29% |
| 2008 | -30.33% | -37.55% | +7.23% |
| 2009 | +60.62% | +46.55% | +14.07% |
| 2010 | +34.99% | +22.05% | +12.94% |
| 2011 | -18.25% | -11.77% | -6.48% |
| 2012 | +16.58% | +11.21% | +5.37% |
| 2013 | +11.66% | -3.15% | +14.80% |
| 2014 | +10.27% | -2.07% | +12.34% |
| 2015 | +42.07% | -0.40% | +42.47% |
| 2016 | -17.64% | +5.60% | -23.23% |
| 2017 | +25.26% | +22.38% | +2.88% |
| 2018 | -3.23% | -18.94% | +15.71% |
| 2019 | +13.53% | +8.22% | +5.32% |
| 2020 | +46.75% | +35.37% | +11.38% |
| 2021 | +12.72% | +1.51% | +11.22% |
| 2022 | -24.63% | -25.53% | +0.90% |
| 2023 | +8.43% | +19.96% | -11.52% |
| 2024 | +20.50% | -10.15% | +30.65% |
| 2025 | +76.70% | +79.65% | -2.95% |
The Excess Return Explained
+14.21% annual excess over KOSPI compounds dramatically over 26 years. ₩10,000 in the strategy reaches ₩1,085,739. The same ₩10,000 in the KOSPI reaches ₩40,707.
The mechanism: Consumer Defensive and Healthcare sectors rotate through multi-year cycles driven by Korea's aging demographics and domestic consumption patterns. The KOSPI is weighted heavily toward large-cap Technology and Financials, which dilute these secular trends. The sector rotation strategy concentrates in whatever is working. Over 26 years, what worked was Consumer Defensive and Healthcare, not the index heavyweights.
Down capture of 59.46% vs KOSPI means the strategy also protected capital in down markets. When KOSPI fell, the portfolio fell a little under 60% as much on average. That protection shows up in the drawdown: -39.86% against the KOSPI's -52.73%. Korea is one of seven markets in this study whose maximum drawdown is shallower than its own index.
The 65.38% quarterly win rate is unusually high, and 21 of 26 calendar years beat the local benchmark.
Limitations
Currency risk. The backtest uses returns in local currency (KRW). For USD-based investors, exchange rate fluctuations between KRW and USD create an additional return layer not captured here. Won depreciation can offset strong local returns.
Liquidity. The Korea universe averaged 54.6 stocks when invested. This is thin for institutional capital. Transaction costs would be higher for larger positions. The size-tiered cost model is reasonable for retail but optimistic for funds.
Extraordinary years skew the CAGR. The 19.76% CAGR is driven substantially by 2001, 2005, and 2025. Remove those three years and the strategy still outperforms, but the gap narrows. An investor who started in 2006 would have experienced a very different trajectory through 2013.
Small universe volatility. With 55 stocks on average, individual sector trends can be amplified by a few names. The +90.98% in 2001 reflects genuine defensive and healthcare outperformance, but the magnitude was amplified by a concentrated universe.
Regulatory and political risk. The 2016 domestic political crisis affected sector momentum in ways not reflected in a simple equal-weighted model. Korea-specific events can disrupt sector rotation dynamics for extended periods.
Cash periods. Four quarters out of 104 held cash because fewer than 5 sectors cleared the minimum stock count. All four fall in the early period, when FMP's Korean coverage is thinnest. The 2000 result in particular is a coverage artifact as much as a signal decision, and it happens to be one of the strategy's best relative years.
References
- Moskowitz, T. J., & Grinblatt, M. (1999). Do industries explain momentum? The Journal of Finance, 54(4), 1249-1290.
- Jegadeesh, N., & Titman, S. (1993). Returns to buying winners and selling losers: Implications for stock market efficiency. The Journal of Finance, 48(1), 65-91.
Data: Ceta Research (FMP financial data warehouse), KSC (Korea Stock Exchange), 2000-2025 Backtest: 26 years, 104 quarters, size-tiered transaction costs (0.1-0.5% one-way), equal weight, next-day-close execution, exchange-specific market cap threshold Past performance does not guarantee future results. This is educational content, not investment advice.

