
Small-Cap Growth Korea: Slightly Behind the KOSPI, and Eight Years Never Invested
Korea's small-cap growth screen returned 4.60% CAGR against a KOSPI that did 5.35%. The entire deficit comes from eight opening years the screen could not fill.

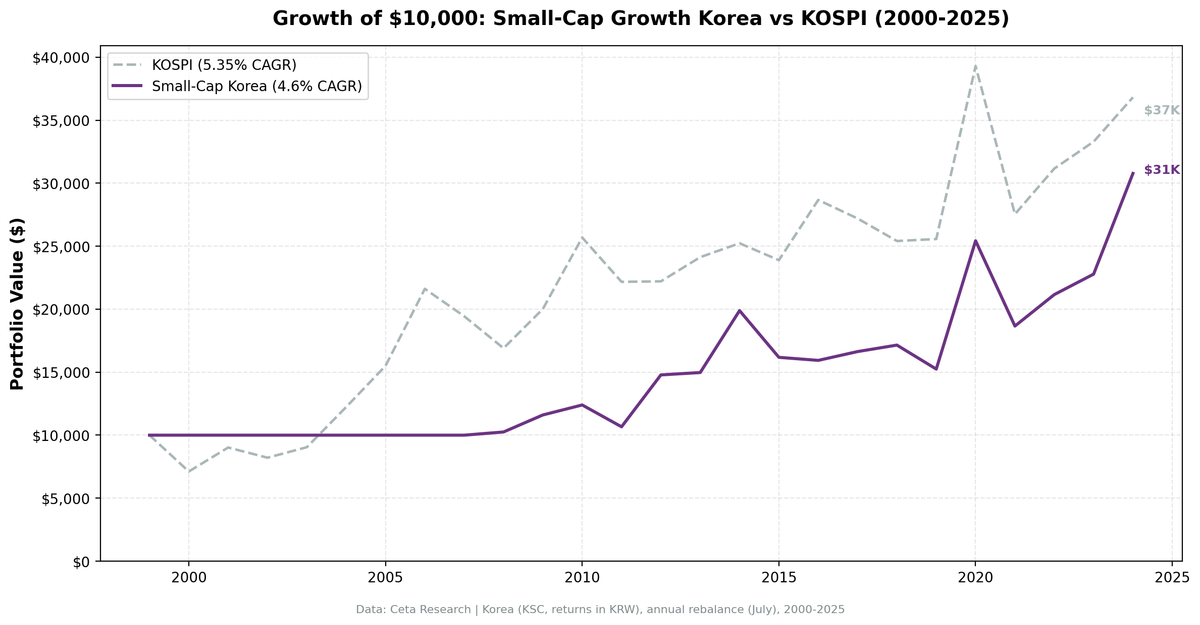
Korea's small-cap growth screen returned 4.60% CAGR over 25 years. The KOSPI returned 5.35%. The strategy trailed its local market by -0.75% a year.
Contents
- Executive Summary
- The Method
- What We Found
- The eight cash years are the whole story
- The risk profile is genuinely defensive
- 2012 and 2024 are the outliers
- Annual Returns
- When It Works and When It Fails
- Limitations
- Run It Yourself
- Takeaway
- References
The KOSPI's 5.35% CAGR is the second-strongest local benchmark in our 14-market study, behind only India's Sensex. Korean large-caps actually grew. Against that, small-cap growth produced no premium at all, and it did so while sitting in cash for the first eight years of the test.
Data: FMP financial data warehouse, 2000-2025. Updated August 2026.
Executive Summary
| Metric | Korea (KSC) | KOSPI Benchmark |
|---|---|---|
| CAGR | 4.60% | 5.35% |
| Excess Return | -0.75%/yr | |
| Sharpe Ratio | 0.082 | 0.114 |
| Sortino Ratio | 0.182 | 0.208 |
| Max Drawdown | -26.61% | -29.91% |
| Win Rate | 52% (13 of 25) | |
| $10,000 becomes | $30,778 | $36,818 |
| Up Capture | 67% | |
| Down Capture | 40% | |
| Average holdings | 25.2 |
$10,000 invested in 2000 became $30,778. The same money in the KOSPI became $36,818. The strategy won 52% of years but lost on the ones that mattered.
The Method
We screened the Korea Stock Exchange each July, with a 45-day filing lag and entry at the next-day close. The filter:
- Market cap between KRW 50B and KRW 2T (small-cap bounds for Korea)
- Revenue growth >15% year-over-year (fiscal year)
- Positive net income
- Debt-to-equity <2.0
Top 30 by revenue growth, equal weight, annual rebalance.
Eight cash years (2000-2007) held no positions. The Korean small-cap growth universe couldn't produce 10 qualifying companies in the early 2000s. The strategy deployed in 2008 and ran for 17 consecutive years through 2024, averaging 25.2 holdings, the highest fill rate of any market we tested.
Full methodology: METHODOLOGY.md
For the US flagship results, see our US small-cap growth backtest.
What We Found
The eight cash years are the whole story
From 2000 to 2007 the strategy held nothing while the KOSPI compounded. Five of those eight years were positive for the index, including +26.76% in 2001, +35.25% in 2004, +26.71% in 2005 and +39.46% in 2006. Sitting out those four years alone cost 128 percentage points of relative return.
The strategy has actually been good since it deployed. From 2008 to 2024, it beat the KOSPI in 10 of 17 years, and the 2018-2024 stretch is its best: 6 wins in 7 years with an average excess of +5.7 points. The 25-year headline of -0.75% is almost entirely a story about not being able to invest.
The risk profile is genuinely defensive
40% down capture against 67% up capture. In the 9 years the KOSPI was negative, the index averaged -13.51% while the portfolio averaged -5.47%. The maximum drawdown of -26.61% is the shallowest of any market in our study, and it's shallower than the KOSPI's own -29.91%.
That's the trade the strategy makes in Korea: it gives up a third of the upside to avoid 60% of the downside. Over this particular 25 years, with a benchmark that rose more than it fell, that trade lost.
2012 and 2024 are the outliers
The best relative year was 2012: +38.61% against the KOSPI's +0.18%, a 38.4 point excess. 2024 was next at +35.08% against +10.58%. 2014 (+28.28%) and 2020 (+13.09%) round out the good years.
With 25.2 average holdings this is less concentrated than most markets in the study, so these aren't single-stock effects. But four years supply nearly all the positive excess, and the other thirteen invested years are mostly small losses.
Annual Returns
| Year | Korea | KOSPI | Excess |
|---|---|---|---|
| 2000 | 0.00% | -28.84% | +28.84% |
| 2001 | 0.00% | +26.76% | -26.76% |
| 2002 | 0.00% | -8.97% | +8.97% |
| 2003 | 0.00% | +10.15% | -10.15% |
| 2004 | 0.00% | +35.25% | -35.25% |
| 2005 | 0.00% | +26.71% | -26.71% |
| 2006 | 0.00% | +39.46% | -39.46% |
| 2007 | 0.00% | -10.07% | +10.07% |
| 2008 | +2.53% | -13.06% | +15.59% |
| 2009 | +13.18% | +18.44% | -5.27% |
| 2010 | +6.83% | +28.32% | -21.49% |
| 2011 | -13.97% | -13.69% | -0.28% |
| 2012 | +38.61% | +0.18% | +38.43% |
| 2013 | +1.27% | +8.64% | -7.36% |
| 2014 | +32.84% | +4.57% | +28.28% |
| 2015 | -18.65% | -5.32% | -13.33% |
| 2016 | -1.50% | +20.01% | -21.50% |
| 2017 | +4.39% | -5.13% | +9.52% |
| 2018 | +3.09% | -6.58% | +9.67% |
| 2019 | -11.10% | +0.63% | -11.73% |
| 2020 | +66.78% | +53.69% | +13.09% |
| 2021 | -26.61% | -29.91% | +3.30% |
| 2022 | +13.38% | +13.13% | +0.25% |
| 2023 | +7.68% | +6.85% | +0.83% |
| 2024 | +35.08% | +10.58% | +24.50% |
Return years run July to July, matching the rebalance date. The 0.00% rows are cash years. Best year: 2020 (+66.78%). Worst year: 2021 (-26.61%). Best excess: 2012 (+38.43%). Worst excess: 2006 (-39.46%, a cash year while the KOSPI rallied 39%).
Only 5 of 25 years were negative in absolute terms, the fewest of any market we tested. This strategy rarely loses money in Korea. It just doesn't gain as fast as the index.
When It Works and When It Fails
When it works: years when the KOSPI is flat or falling and Korean small-cap growth rallies independently. 2012, 2014, 2017, 2018 and 2024 all fit. The 2018-2024 record is genuinely strong.
When it fails: KOSPI bull markets. 2010 (+28.32% for the index, +6.83% for the strategy) and 2016 (+20.01% against -1.50%) are the pattern. With 67% up capture, a strong year for Korean large caps is a losing year in relative terms.
The universe problem is structural. Eight cash years is the second-worst fill record in the study, behind only Japan and Taiwan on a proportional basis. A screen that can't find ten profitable, growing, low-leverage small companies for eight consecutive years is telling you something about the market it's applied to.
Limitations
Eight cash years. The strategy held nothing from 2000 to 2007, which makes the 25-year figures a poor guide to what the screen actually does. The 17-year record since deployment is more informative and considerably better.
Currency. Returns are in Korean won. KRW/USD moves add volatility for non-Korean investors that isn't captured here.
Data completeness. KSC has fewer companies reporting in formats compatible with FMP's pipeline than the larger exchanges. Universe gaps likely contribute to the early cash years.
Fund contamination. Excluding closed-end funds and ETFs moves the Korean result by -0.07pp of CAGR. Korea is clean on this measure. See the US post, where the effect is 3.6 points.
Data revisions. FMP restates and backfills financial history. The identical code run in March 2026 produced 5.54% CAGR and a +0.19% excess. This run produces 4.60% and -0.75%, a sign flip driven purely by data revisions on an already marginal number.
Run It Yourself
Full backtest code is in our public repository: ceta-research/backtests.
The Korean screen uses KRW-denominated market cap bounds. The key constraint is the exchange filter, WHERE exchange = 'KSC' on the profile table. Revenue growth is computed from income_statement, and the leverage filter uses debtToEquityRatio from financial_ratios.
Takeaway
Korea's small-cap growth screen trailed the KOSPI by 0.75 percentage points a year over 25 years. On a straight reading, the size premium doesn't exist here.
The straight reading is misleading in both directions. The strategy spent eight years unable to invest while the index rose, which accounts for the entire deficit. Since 2008 it has beaten the KOSPI in 10 of 17 years, and since 2018 in 6 of 7. It also has the shallowest drawdown in our study at -26.61%, and it lost money in only 5 of 25 years.
What Korea offers is a low-drawdown, low-up-capture profile against the strongest local benchmark in the study. That's a defensive substitute for the KOSPI, not a source of alpha, and the 25-year excess of -0.75% is close enough to zero that transaction costs decide the outcome.
References
- Banz, R. (1981). "The Relationship Between Return and Market Value of Common Stocks." Journal of Financial Economics, 9(1), 3-18.
- Fama, E. & French, K. (1992). "The Cross-Section of Expected Stock Returns." Journal of Finance, 47(2), 427-465.
- Fama, E. & French, K. (1993). "Common Risk Factors in the Returns on Stocks and Bonds." Journal of Financial Economics, 33(1), 3-56.
- Van Dijk, M. (2011). "Is size dead? A review of the size effect in equity returns." Journal of Banking & Finance, 35(12), 3263-3274.
Data: Ceta Research (FMP financial data warehouse), 2000-2025. Full methodology: METHODOLOGY.md. Past performance does not guarantee future results. This is educational content, not investment advice.

