
Small-Cap Growth Sweden: +2.86%/yr Over the OMX, and One Year That Nearly Took It All
Sweden's small-cap growth screen returned 5.41% CAGR against an OMX Stockholm 30 that did 2.55%. Then 2021 gave back 27.7 points of relative performance in a single year.

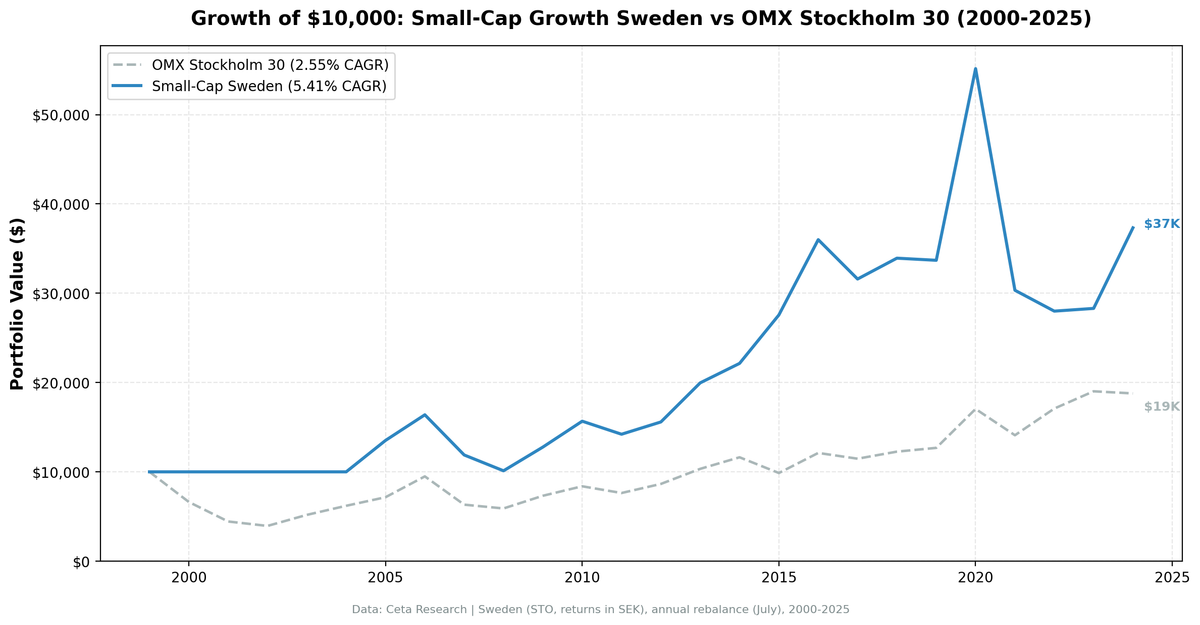
Sweden's small-cap growth screen returned 5.41% CAGR over 25 years against an OMX Stockholm 30 that managed 2.55%. That's +2.86 percentage points a year of local excess, with a 31% down capture and a shallower drawdown than the index itself.
Contents
- Executive Summary
- The Method
- What We Found
- The asymmetry is real
- 2021 is the year that defines the record
- The good years
- The win rate is a coin flip
- Annual Returns
- When It Works and When It Fails
- Limitations
- Run It Yourself
- Takeaway
- References
The OMX's 2.55% CAGR is the context that makes the excess possible. Swedish large-caps barely grew for two decades. And the strategy's own record has a hole in it: 2021, when it fell 45.00% while the index fell 17.27%, a 27.7 point loss in a single year that erased most of the alpha built up over the previous decade.
Data: FMP financial data warehouse, 2000-2025. Updated August 2026.
Executive Summary
| Metric | Sweden (STO) | OMX Stockholm 30 |
|---|---|---|
| CAGR | 5.41% | 2.55% |
| Excess Return | +2.86%/yr | |
| Sharpe Ratio | 0.150 | 0.027 |
| Sortino Ratio | 0.276 | 0.040 |
| Max Drawdown | -49.24% | -60.54% |
| Win Rate | 52% (13 of 25) | |
| $10,000 becomes | $37,321 | $18,785 |
| Up Capture | 88% | |
| Down Capture | 32% | |
| Average holdings | 19.1 |
The Method
We screened Stockholm-listed stocks each July, with a 45-day filing lag and entry at the next-day close. The filter:
- Market cap between SEK 250M and SEK 10B (small-cap bounds for Sweden)
- Revenue growth >15% year-over-year (fiscal year)
- Positive net income
- Debt-to-equity <2.0
Top 30 by revenue growth, equal weight, rebalanced annually.
Five years (2000-2004) held cash because fewer than 10 stocks passed the screen. The dot-com bust suppressed revenue growth across the board, and the Swedish universe was too thin to fill a portfolio.
Full methodology: METHODOLOGY.md
For the US flagship results, see our US small-cap growth backtest.
What We Found
The asymmetry is real
32% down capture against 88% up capture is a good combination. In the 10 years the OMX was negative, the index averaged -16.59% while the portfolio averaged -5.25%. The maximum drawdown of -49.24% is 11 points shallower than the index's -60.54%, which is unusual for a small-cap portfolio against a blue-chip index.
The Sortino ratio of 0.276 against the OMX's 0.040 says the strategy delivered more return per unit of downside risk. The Sharpe of 0.150 against 0.027 says the same thing less flatteringly.
2021 is the year that defines the record
The strategy fell 45.00% in the year to July 2022 while the OMX fell 17.27%. That's a -27.73 point excess, and it came directly after 2020's +63.70%, the best year in the backtest.
Swedish growth stocks were repriced hard as interest rates rose and valuation multiples compressed. The strategy holds high-revenue-growth names by construction and has no mechanism to de-risk when those names get expensive, so it took the full force of the repricing. 2022 (-28.88% excess) made it worse.
Add 2021 and 2022 together and you have -56.6 points of excess return in two years, against a 25-year cumulative excess of 78.8 points. Two years gave back roughly 70% of what a quarter century had built.
The good years
2020: +63.70% against the OMX's +34.34%. The pandemic rebound hit growth stocks hard on the upside.
2015: +24.51% against the OMX's -15.14%, a +39.65 point excess and the best relative year in the sample.
2024: +31.89% against the OMX's -1.24%, a +33.14 point excess. Two strong recovery years in the last four suggest the 2021-2023 stretch may have been a repricing rather than a regime change, though two observations don't settle it.
The win rate is a coin flip
52%, 13 of 25 years. The strategy's edge comes from the size of the wins, not their frequency: four invested years cleared +19 points of excess (2005, 2015, 2020, 2024) against a worst year of -28.9. That's the skewed distribution typical of concentrated growth portfolios, and it means the average understates how uncomfortable the path was.
Annual Returns
| Year | Sweden | OMX Stockholm 30 | Excess |
|---|---|---|---|
| 2000 | 0.00% | -33.73% | +33.73% |
| 2001 | 0.00% | -32.98% | +32.98% |
| 2002 | 0.00% | -11.15% | +11.15% |
| 2003 | 0.00% | +31.32% | -31.32% |
| 2004 | 0.00% | +19.62% | -19.62% |
| 2005 | +35.17% | +15.49% | +19.69% |
| 2006 | +21.24% | +32.59% | -11.35% |
| 2007 | -27.45% | -33.35% | +5.90% |
| 2008 | -14.89% | -6.72% | -8.17% |
| 2009 | +26.23% | +24.08% | +2.14% |
| 2010 | +22.69% | +14.50% | +8.18% |
| 2011 | -9.31% | -8.98% | -0.34% |
| 2012 | +9.67% | +13.32% | -3.65% |
| 2013 | +28.09% | +19.52% | +8.57% |
| 2014 | +10.91% | +12.53% | -1.62% |
| 2015 | +24.51% | -15.14% | +39.65% |
| 2016 | +30.56% | +22.77% | +7.79% |
| 2017 | -12.24% | -5.32% | -6.93% |
| 2018 | +7.39% | +6.89% | +0.50% |
| 2019 | -0.70% | +3.45% | -4.15% |
| 2020 | +63.70% | +34.34% | +29.36% |
| 2021 | -45.00% | -17.27% | -27.73% |
| 2022 | -7.70% | +21.18% | -28.88% |
| 2023 | +1.09% | +11.31% | -10.22% |
| 2024 | +31.89% | -1.24% | +33.14% |
Return years run July to July, matching the rebalance date. The 0.00% rows are cash years. Best year: 2020 (+63.70%). Worst year: 2021 (-45.00%). Best excess: 2015 (+39.65%). Worst excess: 2003 (-31.32%, a cash year while the OMX rallied).
When It Works and When It Fails
When it works: early in a recovery cycle, when Swedish small-caps are cheap and revenue growth is accelerating. 2005, 2009-2010, 2013 and 2015-2016 show the pattern. Also when the OMX is falling and small-cap growth provides genuine differentiation, as in 2015 and 2024.
When it fails: rate-rising environments where growth stocks trade on rich multiples. 2021-2022 is the textbook case. The strategy always holds growth stocks, so it has no way to de-risk when valuations get extended.
The cash years cut both ways. The 2000-2002 rows score as large positive excess without the strategy owning a single share, and 2003-2004 score as large negatives for the same reason. Nine of the 25 rows in the table above are either cash years or years adjacent to them, which is worth remembering before reading too much into the 25-year average.
Limitations
Currency exposure. Returns are in Swedish krona. SEK/USD moves add volatility for non-Swedish investors that isn't captured here.
Transaction costs. Swedish small-caps have wider spreads than large-caps. The backtest applies size-tiered costs and end-of-day pricing without modelling market impact.
Thin universe. Five cash years and an average of 19.1 holdings against a 30-stock target mean the portfolio is concentrated in most years.
2021 as regime change. Whether the 2021-2023 underperformance was a repricing or a structural shift isn't determinable yet. 2024's +33.1 point excess is encouraging but it's one year.
Fund contamination. Excluding closed-end funds and ETFs from the universe moves the Swedish result by +0.15pp of CAGR. Sweden is clean on this measure. The effect is 3.6 points in the US; see that post for the analysis.
Data revisions. FMP restates and backfills financial history. The identical code run in March 2026 produced 6.56% CAGR and a +4.01% excess. This run produces 5.41% and +2.86%, purely from data revisions.
Run It Yourself
The full backtest code is in our public repository: ceta-research/backtests.
You can query the underlying data via the Ceta Research data explorer. The screen uses income_statement, financial_ratios and key_metrics from the FMP warehouse, with market cap bounds in SEK.
Takeaway
Sweden's small-cap growth screen beat the OMX Stockholm 30 by 2.86 percentage points a year over 25 years, with a 32% down capture and a drawdown 11 points shallower than the index. As local strategies go, that's a working one.
The context is that the OMX returned 2.55% a year. The strategy's absolute return of 5.41% is modest, and the path to it included a single year that gave back 27.7 points of relative performance and a five-year opening stretch where the screen couldn't find enough companies to buy.
For an investor who wants Swedish small-cap exposure and would otherwise hold the OMX, the case is defensible. Just size the position for 2021, not for the 25-year average.
References
- Banz, R. (1981). "The Relationship Between Return and Market Value of Common Stocks." Journal of Financial Economics, 9(1), 3-18.
- Fama, E. & French, K. (1992). "The Cross-Section of Expected Stock Returns." Journal of Finance, 47(2), 427-465.
- Fama, E. & French, K. (1993). "Common Risk Factors in the Returns on Stocks and Bonds." Journal of Financial Economics, 33(1), 3-56.
- Van Dijk, M. (2011). "Is size dead? A review of the size effect in equity returns." Journal of Banking & Finance, 35(12), 3263-3274.
Data: Ceta Research (FMP financial data warehouse), 2000-2025. Full methodology: METHODOLOGY.md. Past performance does not guarantee future results. This is educational content, not investment advice.

