
Small-Cap Growth Taiwan: Level With the TAIEX After 25 Years
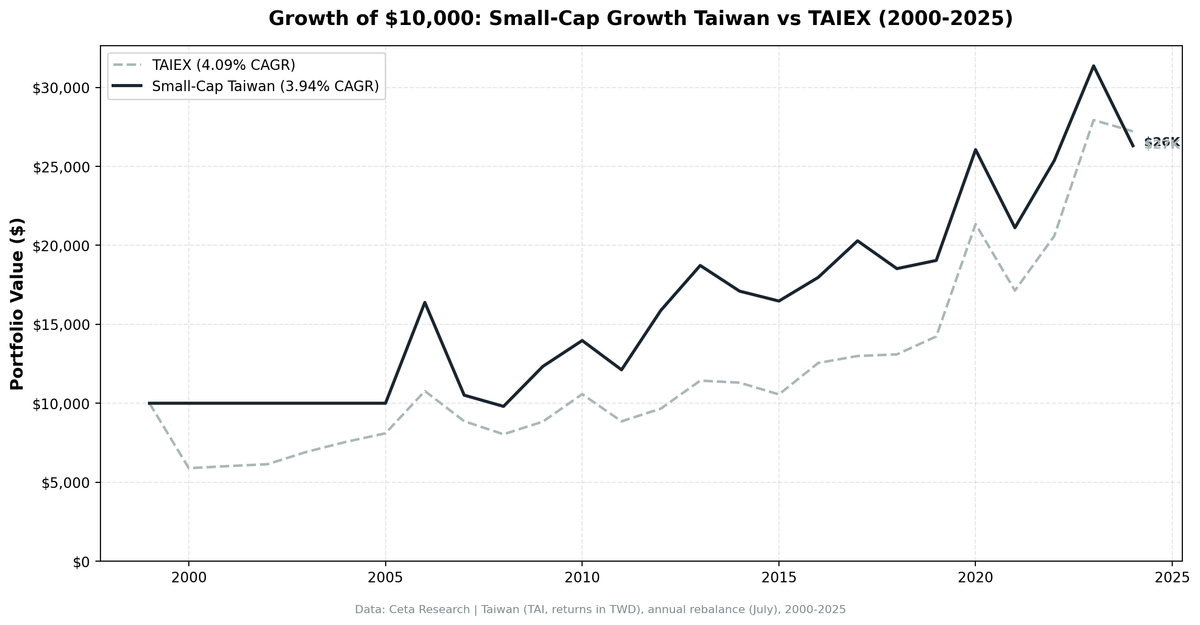
Taiwan's small-cap growth screen returned 3.94% CAGR against a TAIEX that did 4.09%. With 95% up capture and 90% down capture, it tracked the index instead of beating it.

Taiwan has TSMC. It has a world-class semiconductor ecosystem and decades of export-driven growth. The assumption going in is that a small-cap growth screen here should capture upstream and downstream beneficiaries of that engine.
Contents
- Executive Summary
- The Method
- What We Found
- Annual Returns
- Why the Semiconductor Thesis Doesn't Show Up
- Limitations
- Run It Yourself
- Takeaway
- References
The data says otherwise. 3.94% CAGR over 25 years against a TAIEX that returned 4.09%, an excess of -0.14% a year. $10,000 became $26,306; the index turned it into $27,209. The strategy beat the TAIEX in 9 of 25 years, a 36% win rate, the joint-lowest in our 14-market study.
Data: FMP financial data warehouse, 2000-2025. Updated August 2026.
Executive Summary
| Metric | Taiwan (TAI) | TAIEX Benchmark |
|---|---|---|
| CAGR | 3.94% | 4.09% |
| Excess Return | -0.14%/yr | |
| Sharpe Ratio | 0.143 | 0.161 |
| Sortino Ratio | 0.293 | 0.280 |
| Max Drawdown | -40.17% | -41.11% |
| Win Rate | 36% (9 of 25) | |
| $10,000 becomes | $26,306 | $27,209 |
| Up Capture | 95% | |
| Down Capture | 90% | |
| Average holdings | 23.2 |
The Method
We screened TAI-listed stocks each July, with a 45-day filing lag and entry at the next-day close:
- Market cap between TWD 1.5B and TWD 60B (small-cap bounds for Taiwan)
- Revenue growth >15% year-over-year (fiscal year)
- Positive net income
- Debt/equity ratio below 2.0
Top 30 by revenue growth, equal weight, annual rebalance. Six cash years (2000-2005) held no positions because the universe couldn't produce 10 qualifying companies. Active years: 19 (2006-2024), averaging 23.2 holdings.
Full methodology: METHODOLOGY.md
For the US flagship results, see our US small-cap growth backtest.
What We Found
The strategy tracks the index instead of beating it. 95% up capture against 90% down capture is the tightest pairing in the study. The portfolio moved with the TAIEX in both directions, which is exactly what you don't want from a concentrated 23-stock screen: index-like returns with single-stock risk on top. Beta is 0.80 and Jensen's alpha is +0.48%, both close enough to neutral that the screen adds nothing measurable.
The maximum drawdown is no better than the index. -40.17% against the TAIEX's -41.11%. There's no defensive benefit to offset the concentration.
It has gotten worse recently. From 2000 to 2009 the average excess was +3.9 points, from 2010 to 2017 it was +1.6, and from 2018 to 2024 it was -7.6 with a single winning year. 2024 was the worst of that stretch: -16.12% against a TAIEX that fell only 2.57%.
Two years carry the positive side. 2006 (+30.76% excess) and 2012 (+21.95%) are the only invested years above 20 points. 2009 (+15.89%) is the only other double-digit win. Strip those three and the strategy is clearly behind.
Annual Returns
| Year | Taiwan | TAIEX | Excess |
|---|---|---|---|
| 2000 | 0.00% | -41.11% | +41.11% |
| 2001 | 0.00% | +2.21% | -2.21% |
| 2002 | 0.00% | +2.01% | -2.01% |
| 2003 | 0.00% | +12.79% | -12.79% |
| 2004 | 0.00% | +9.13% | -9.13% |
| 2005 | 0.00% | +7.13% | -7.13% |
| 2006 | +63.82% | +33.06% | +30.76% |
| 2007 | -35.84% | -17.74% | -18.10% |
| 2008 | -6.75% | -9.33% | +2.58% |
| 2009 | +25.84% | +9.95% | +15.89% |
| 2010 | +13.27% | +19.70% | -6.43% |
| 2011 | -13.27% | -16.29% | +3.02% |
| 2012 | +31.09% | +9.13% | +21.95% |
| 2013 | +17.88% | +18.33% | -0.45% |
| 2014 | -8.68% | -1.11% | -7.56% |
| 2015 | -3.67% | -6.60% | +2.93% |
| 2016 | +9.10% | +18.86% | -9.76% |
| 2017 | +12.88% | +3.51% | +9.37% |
| 2018 | -8.68% | +0.81% | -9.49% |
| 2019 | +2.80% | +8.65% | -5.85% |
| 2020 | +36.82% | +50.02% | -13.20% |
| 2021 | -18.95% | -19.72% | +0.77% |
| 2022 | +20.13% | +20.17% | -0.04% |
| 2023 | +23.63% | +35.64% | -12.01% |
| 2024 | -16.12% | -2.57% | -13.55% |
Return years run July to July, matching the rebalance date. The 0.00% rows are cash years. Best year: 2006 (+63.82%). Worst year: 2007 (-35.84%). Best excess: 2000 (+41.11%, a cash year during the dot-com crash). Worst excess: 2007 (-18.10%).
The 2000 row is worth noting: the entire +41.1 point excess came from holding nothing while the TAIEX fell 41%. It's the largest single-year excess in the record and the strategy didn't own a share.
Why the Semiconductor Thesis Doesn't Show Up
The winners aren't small. Taiwan's semiconductor value chain concentrates enormous profit in a handful of very large companies. TSMC, MediaTek, Hon Hai and their peers sit far above the TWD 1.5B-60B small-cap band. A screen that excludes them by construction excludes most of what made Taiwan's market work.
Small Taiwanese suppliers are cyclical, not compounding. The companies inside the band are often component makers and contract assemblers whose revenue swings with a customer's product cycle. Revenue growth above 15% in one year frequently reverses the next, and the profitability filter can't distinguish a structural share gain from a single large order.
2020 and 2023 make the point. The TAIEX gained 50.02% and 35.64% in those years, driven by the AI and semiconductor cycle. The strategy captured 36.82% and 23.63%. When Taiwan's defining industry rallied hardest, a small-cap screen was in the wrong part of the market.
Six cash years. The universe couldn't fill a portfolio until 2006. That's a market where profitable, growing, low-leverage small companies were genuinely scarce for the first quarter of the test.
Limitations
Six cash years make the 25-year figures a weak guide to the screen's behaviour. The 19-year invested record is 3.94% CAGR against a benchmark that did roughly the same.
Currency. Returns are in Taiwan dollars. TWD/USD moves add volatility for foreign investors that isn't captured here.
Universe scope. This run uses TAI (Taiwan Stock Exchange) only. The over-the-counter TWO market, where many smaller Taiwanese growth companies list, is excluded. A broader universe might change the result, and we haven't tested it.
Fund contamination. Excluding closed-end funds and ETFs changes the Taiwanese result by 0.00pp. Taiwan is clean on this measure. See the US post, where the effect is 3.6 points.
Data revisions. FMP restates and backfills financial history. The identical code run in March 2026 produced 4.38% CAGR and a +0.29% excess. This run produces 3.94% and -0.14%, a sign flip on an already marginal number, driven purely by data revisions.
Run It Yourself
The screen definition and SQL are in our US flagship post. The Taiwan version uses a TAI exchange filter with TWD 1.5B-60B bounds.
Query the underlying data at Ceta Research.
Takeaway
Taiwan's small-cap growth screen finished 0.14 percentage points a year behind the TAIEX over 25 years, with 95% up capture, 90% down capture and a drawdown no shallower than the index. That's a portfolio doing an expensive impression of an index fund.
The intuition that Taiwan's semiconductor strength should reward a growth screen fails for a simple structural reason: the companies that captured that growth are large-cap, and the small-cap suppliers below them are cyclical rather than compounding. In 2020 and 2023, the two years the TAIEX ran hardest on the chip cycle, the strategy lagged by 13.2 and 12.0 points.
If you want exposure to Taiwan's growth story, this screen is the wrong instrument. The evidence from 25 years is that it buys the volatility of small Taiwanese companies without the returns of the industry that makes Taiwan interesting.
References
- Banz, R. (1981). "The Relationship Between Return and Market Value of Common Stocks." Journal of Financial Economics, 9(1), 3-18.
- Fama, E. & French, K. (1992). "The Cross-Section of Expected Stock Returns." Journal of Finance, 47(2), 427-465.
- Fama, E. & French, K. (1993). "Common Risk Factors in the Returns on Stocks and Bonds." Journal of Financial Economics, 33(1), 3-56.
- Van Dijk, M. (2011). "Is size dead? A review of the size effect in equity returns." Journal of Banking & Finance, 35(12), 3263-3274.
Data: Ceta Research (FMP financial data warehouse), 2000-2025. Full methodology: METHODOLOGY.md. Past performance does not guarantee future results. This is educational content, not investment advice.

