Stock Splits Signal Something, Just Not What You Think
We analyzed 1,968 forward stock splits on US exchanges from 2000 to 2025. The post-split drift has disappeared in aggregate. But the split ratio tells the real story: 2-for-1 splits still outperform (+2.6%), while 5-for-1+ splits underperform by -11.7%.

A stock split changes nothing about a company's fundamentals. A 4-for-1 split gives you four shares at a quarter of the price. Same market cap. Same ownership stake. Same business.
Contents
- Executive Summary
- Method
- The Academic Case for Post-Split Drift
- Screening for Stock Splits
- Simple screen
- Advanced screen: $500M+ companies with meaningful splits
- Event Study Results
- Overall CAR by Window
- By Split Ratio
- The Split Ratio Effect
- Split Frequency Over Time
- Run It Yourself
- Limitations
- Takeaway
- References
And yet, the conventional wisdom says stocks that announce forward splits outperform in the months after. Academic papers from the 1960s and 1990s documented this. Finance blogs repeat it. The actual 2000-2025 data tells a more nuanced story.
We analyzed 1,968 forward stock splits on US exchanges to measure the effect, test whether it's statistically significant, and find out where it's strongest.
Executive Summary
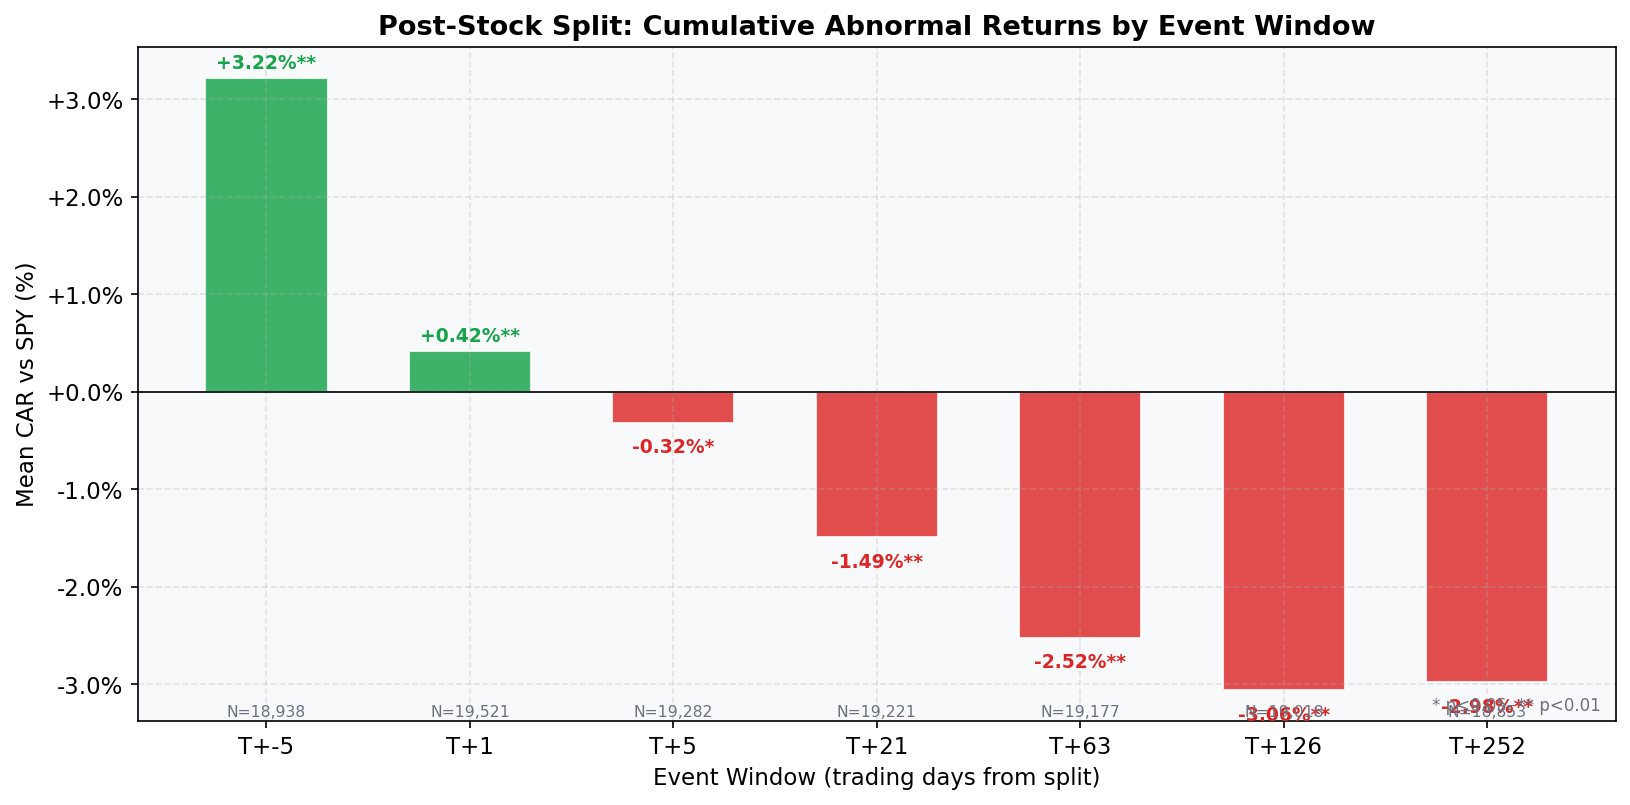
Forward stock splits show a modest pre-split run-up: +1.31% vs SPY in the 5 trading days before the effective date (t-stat 3.81, significant at p<0.01). After the split, there is no statistically significant drift in either direction. The overall one-year CAR is +0.58%, with a t-stat of 0.72, far from significant.
The ratio tells a different story. Standard 2-for-1 splits show +2.58% at one year (t=2.45, significant at p<0.05). Extreme ratio splits (5-for-1 and above) show -11.67% at one year (t=-4.00, highly significant). The net cancels to approximately zero.
The practical implication: the post-split drift from Ikenberry (1996) hasn't reversed. It has disappeared in aggregate, because the positive drift from standard splits is offset by the negative drift from extreme ratio splits.
Method
Data source: Ceta Research (FMP splits data, 70K+ stocks) Event table: splits_calendar (symbol, date, numerator, denominator) Universe: US stocks (NYSE, NASDAQ, AMEX), market cap > $500M at time of split Period: 2000-2025 (1,968 events with complete price data) Benchmark: SPY Execution: MOC (returns measured from next-day close after event) Event filter: Forward splits only (numerator > denominator, ratio >= 1.5x) Price data: adjClose (already split-adjusted)
Event windows: T-5, T+5, T+21, T+63, T+126, T+252 trading days. Abnormal return (CAR) = stock return minus SPY return over the same window. Stratification: by split ratio (2-for-1, 3-for-1, 4-for-1, 5-for-1+, other).
The Academic Case for Post-Split Drift
Stock splits are voluntary. Management chooses to split. They choose the timing and ratio.
The standard signaling story: management splits because the stock price is high due to fundamental strength, not a temporary blip. They're saying, implicitly, that this price level is sustainable.
Fama, Fisher, Jensen, and Roll studied stock splits in 1969 in one of the earliest event studies in finance. They found that stock prices rise in the months before a split but show no abnormal returns after, evidence of market efficiency. Decades later, Ikenberry, Rankine, and Stice challenged that conclusion in 1996. Studying 2-for-1 splits, they documented abnormal returns of roughly 7.9% in the first year and 12.1% over three years. Their conclusion: the market systematically underreacts to split information.
Three mechanisms were proposed. Attention effects: splits make headlines (NVDA's 10-for-1 in 2024, AAPL's 4-for-1 in 2020), driving gradual retail buying. Liquidity improvement: lower per-share prices tighten bid-ask spreads, increasing price discovery over weeks. Institutional constraints: some funds have minimum share price rules, so splits create new eligible buyers.
All three mechanisms predict the same thing: positive drift after the split. The 2000-2025 data partially confirms this for standard splits, but tells a very different story for extreme ratios.
Screening for Stock Splits
Simple screen
Run this query on Ceta Research
SELECT symbol,
    CAST(date AS DATE) AS split_date,
    numerator,
    denominator,
    ROUND(CAST(numerator AS FLOAT) / denominator, 1) AS split_ratio
FROM splits_calendar
WHERE CAST(date AS DATE) >= CURRENT_DATE - INTERVAL '90' DAY
  AND numerator > denominator
ORDER BY split_date DESC
The numerator > denominator filter excludes reverse splits (which signal the opposite: weakness, delisting risk). The split ratio tells you the magnitude: 2-for-1 is standard, 10-for-1 is rare.
Advanced screen: $500M+ companies with meaningful splits
Run this query on Ceta Research
WITH splits AS (
    SELECT symbol,
        CAST(date AS DATE) AS split_date,
        numerator, denominator,
        ROUND(CAST(numerator AS FLOAT) / denominator, 1) AS split_ratio
    FROM splits_calendar
    WHERE CAST(date AS DATE) >= CURRENT_DATE - INTERVAL '180' DAY
      AND numerator > denominator
      AND CAST(numerator AS FLOAT) / denominator >= 2
)
SELECT s.symbol, s.split_date, s.split_ratio,
    ROUND(k.marketCap / 1e9, 1) AS mktcap_bn
FROM splits s
JOIN key_metrics k ON s.symbol = k.symbol AND k.period = 'FY'
WHERE k.marketCap > 500000000
QUALIFY ROW_NUMBER() OVER (PARTITION BY s.symbol ORDER BY k.date DESC) = 1
ORDER BY s.split_date DESC
Adds a $500M market cap floor and requires at least a 2-for-1 ratio. Micro-cap companies split for reasons unrelated to signaling (meeting exchange listing requirements, for example). The $500M filter focuses on companies where the split is a genuine signal.
Event Study Results
Overall CAR by Window
| Window | Mean CAR | t-stat | N | Hit Rate |
|---|---|---|---|---|
| T-5 | +1.31% | +3.81 | 1,953 | 48.4% |
| T+5 | -0.25% | -1.76 | 1,965 | 49.1% |
| T+21 | -0.42% | -1.47 | 1,965 | 47.0% |
| T+63 | -0.64% | -1.54 | 1,958 | 48.0% |
| T+126 | +0.38% | +0.66 | 1,932 | 48.2% |
| T+252 | +0.58% | +0.72 | 1,918 | 48.0% |
The pre-split window (T-5) captures the run-up in the days before the effective date. Stocks appreciate as the announcement (which typically precedes the effective date by weeks) drives attention. By T+5, the CAR is slightly negative but not significant. No post-event window reaches statistical significance. The one-year CAR of +0.58% has a t-stat of just 0.72. Post-split, the data is consistent with zero abnormal returns.
By Split Ratio
2-for-1 splits (N=1,046):
| Window | Mean CAR | t-stat | Hit Rate |
|---|---|---|---|
| T+21 | +0.01% | +0.03 | 47.3% |
| T+63 | +0.35% | +0.66 | 49.6% |
| T+252 | +2.58% | +2.45 | 49.9% |
2-for-1 splits show a modest positive drift that reaches significance at one year (t=2.45, p<0.05). This is roughly consistent with Ikenberry's 1996 finding, though much weaker than the 7.9% they documented. The standard forward split still carries a mild positive signal.
3-for-1 splits (N=195):
| Window | Mean CAR | t-stat | Hit Rate |
|---|---|---|---|
| T+21 | -2.06% | -1.94 | 44.1% |
| T+63 | -2.85% | -2.53 | 41.1% |
| T+252 | +1.01% | +0.37 | 44.2% |
3-for-1 splits show short-term underperformance at T+63 (significant at 5%), but the one-year result is close to zero.
4-for-1 splits (N=117):
| Window | Mean CAR | t-stat | Hit Rate |
|---|---|---|---|
| T+63 | -2.33% | -1.19 | 52.1% |
| T+252 | -8.35% | -2.87 | 41.8% |
5-for-1+ splits (N=207):
| Window | Mean CAR | t-stat | Hit Rate |
|---|---|---|---|
| T+63 | -4.49% | -2.19 | 36.3% |
| T+126 | -7.02% | -2.91 | 38.7% |
| T+252 | -11.67% | -4.00 | 31.3% |
Higher split ratios correlate with worse post-split returns. 4-for-1 splits underperform by -8.35% at one year. 5-for-1+ splits underperform by -11.67%, highly significant (t=-4.00). Only 31% of 5-for-1+ split stocks beat SPY at one year.
One interpretation: extreme split ratios signal overheated retail interest rather than management confidence. NVIDIA's 10-for-1 split in June 2024 happened after a 730% run. That's management making the stock "accessible" at the peak of retail enthusiasm, not signaling that fair value is higher.
The Split Ratio Effect
The data shows something more interesting than a blanket reversal. The drift has split in two:
- Standard splits (2-for-1): Modest positive drift (+2.58% at one year, significant). Consistent with the signaling hypothesis. These companies typically split at reasonable valuations after steady appreciation.
- Extreme splits (5-for-1+): Significant negative drift (-11.67% at one year). These tend to happen at momentum peaks when retail attention is highest.
The overall zero result is the average of these opposing forces. A blanket "buy after split" strategy returns nothing because the standard split winners are canceled by the extreme split losers.
Split Frequency Over Time
Forward splits have become less common since 2000. Peak years were 2013-2018. Many companies now let share prices run high. Berkshire Hathaway Class A trades above $600,000. Before its 20-for-1 split in 2022, Google traded above $2,800.
When a company does split in this environment, it stands out more. But the data suggests this increased salience doesn't translate into post-split alpha for extreme ratios.
Run It Yourself
# Clone the repo and set your API key
git clone https://github.com/ceta-research/backtests
cd backtests
export CR_API_KEY="your-key-here"  # get at cetaresearch.com

# Run the event study (US, MOC execution)
python3 stock-split/backtest.py --preset us --output stock-split/results --verbose

# Legacy same-day execution (for comparison with old academic studies)
python3 stock-split/backtest.py --preset us --no-next-day --output stock-split/results --verbose

# Screen for recent splits
python3 stock-split/screen.py --days 90

# $500M+ companies, 2-for-1 and above
python3 stock-split/screen.py --days 180 --min-mktcap 500000000 --min-ratio 2.0
Limitations
Announcement vs effective date. Our data uses the effective split date, not the announcement date. The announcement typically occurs weeks earlier. Some of the pre-split (T-5) return likely captures announcement-period drift, making the true pre-announcement window longer than we measure.
Selection bias. Companies that split tend to be recent outperformers. Part of any post-split return may be mean reversion from a momentum run-up, not a split-specific effect. Our CAR calculation (stock minus SPY) controls for market-wide moves but not for company-specific momentum.
MOC execution. Post-event returns are measured from the next trading day close (market-on-close execution). This models realistic execution but means the immediate post-split day return is absorbed into the base price.
Small sample for extreme ratios. The 4-for-1 category has 117 events and 5-for-1+ has 207. These are sufficient for statistical tests but more sensitive to outliers than the 2-for-1 category (1,046 events).
Transaction costs. These are gross abnormal returns. Capturing the pre-split window requires knowing the effective date in advance, which means monitoring the announcement.
Takeaway
The pre-split window is real but modest: +1.31% vs SPY in 5 trading days, t-stat of 3.81. The post-split drift documented in 1969 and 1996 has not reversed in 2000-2025 US data. It has disappeared in aggregate.
The split ratio tells the real story. Standard 2-for-1 splits still show mild outperformance (+2.58% at one year). Extreme ratio splits (5-for-1+) significantly underperform (-11.67% at one year, t=-4.00). The blanket "buy after split" signal is dead. The ratio-specific signal is alive.
Screening for recent splits is easy and worth monitoring. The edge, if it exists, is in distinguishing standard splits from momentum-peak splits, and in the pre-split window.
Data: Ceta Research (FMP splits data, 2000-2025). Event study uses splits_calendar + stock_eod + key_metrics tables. US stocks (NYSE, NASDAQ, AMEX), market cap > $500M. Abnormal returns computed vs SPY benchmark with MOC execution. Full methodology: github.com/ceta-research/backtests. Past performance does not guarantee future results. This is educational content, not investment advice.
References
- Fama, E., Fisher, L., Jensen, M. & Roll, R. (1969). "The Adjustment of Stock Prices to New Information." International Economic Review, 10(1), 1-21.
- Ikenberry, D., Rankine, G. & Stice, E. (1996). "What Do Stock Splits Really Signal?" Journal of Financial and Quantitative Analysis, 31(3), 357-375.
- Desai, H. & Jain, P. (1997). "Long-Run Common Stock Returns following Stock Splits and Reverse Splits." Journal of Business, 70(3), 409-433.