momentum investing
Quality Momentum on Swedish Stocks: 9.76% CAGR with Strong Upswings
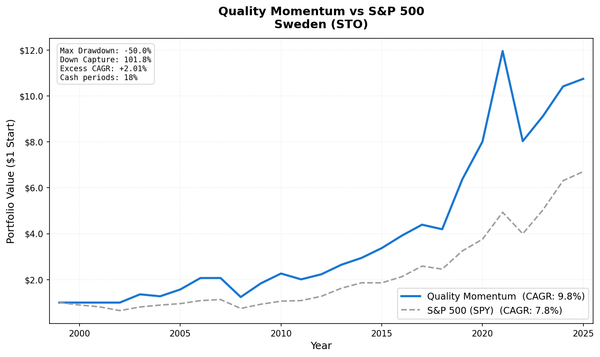
Quality + momentum on Stockholm Stock Exchange from 2003 to 2025. 9.76% CAGR vs 7.75% SPY. 2.01% annual alpha with strong momentum capture in bull markets.
momentum investing
Quality + momentum on Stockholm Stock Exchange from 2003 to 2025. 9.76% CAGR vs 7.75% SPY. 2.01% annual alpha with strong momentum capture in bull markets.
momentum investing
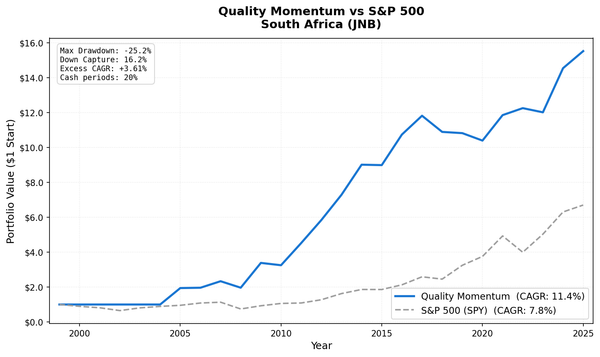
Quality + momentum on Johannesburg Stock Exchange from 2005 to 2025. 11.36% CAGR vs 7.75% SPY. The quality filter eliminates most commodity and mining stocks, leaving a concentrated portfolio of SA's financially sound companies.
momentum investing
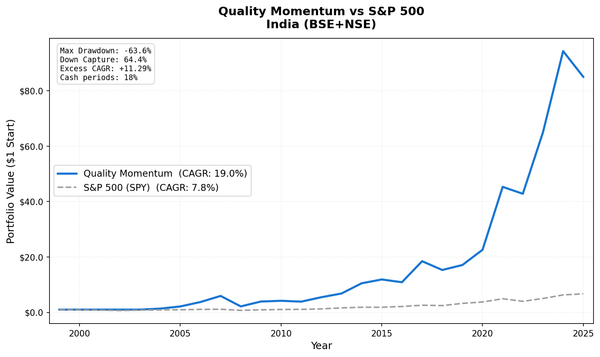
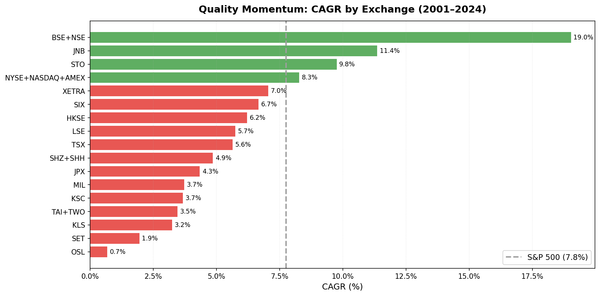
Quality + momentum on BSE+NSE from 2004 to 2025. 19.03% CAGR vs 7.75% SPY benchmark. 11.29% annual alpha, 64.4% down capture.
momentum investing
We backtested quality + momentum on 17 exchanges worldwide. India leads at 19% CAGR. South Africa surprises with 16.2% down capture. Most developed markets underperform the S&P 500 — momentum adds return but crashes harder in downturns.
quality investing
D/E < 0.5 + Piotroski F-Score >= 7 on the SIX Swiss Exchange produced the highest Sharpe ratio of any market tested (0.438), 8.08% CAGR vs 1.74% for SMI (+6.34% excess), 40.72% down capture, and just one cash period across 25 years.
quality investing
D/E < 0.5 + Piotroski F-Score >= 7 on the Stockholm exchange returned 9.39% CAGR vs 2.55% for OMX Stockholm 30 (+6.84% excess, the highest in the study), with 35.62% down capture and 7 protective cash periods. A thin but effective universe of 20 stocks.
quality investing
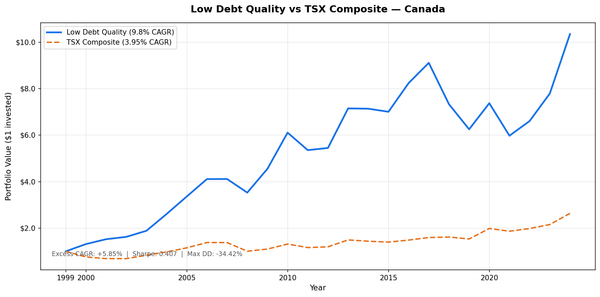
D/E < 0.5 + Piotroski F-Score >= 7 across the TSX returned 9.80% CAGR vs 3.95% for TSX Composite (+5.85% excess) over 25 years, with a 9.32% down capture, the lowest in the study. When the Canadian market fell, this portfolio barely moved.
quality investing
D/E < 0.5 + Piotroski F-Score >= 7 on TAI and TWO-listed stocks, backtested 2000-2025. 3.31% CAGR vs 4.09% TAIEX, trailing by 0.78% annually. Max drawdown -25.57% vs -41.11%, down capture 61.45%. Better Sharpe ratio (0.168 vs 0.127) through superior downside protection.
quality investing
D/E < 0.5 + Piotroski F-Score >= 7 on HKSE-listed stocks, backtested 2000-2025. 3.65% CAGR vs 1.64% Hang Seng. The strategy beat the local benchmark by 2.01% annually, with max drawdown of -34.07% vs -40.45%. Down capture of 91.36% through Hong Kong's volatile 25-year period.
quality investing
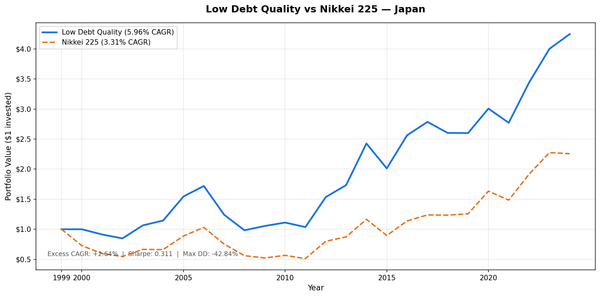
D/E < 0.5 and Piotroski F-Score >= 7 on JPX stocks across 25 years. 5.96% CAGR vs 3.31% Nikkei 225. +2.64% excess with 52.25% down capture. 116 avg qualifying stocks. Abenomics drove +48.2% in 2012 and +39.9% in 2014.
quality investing
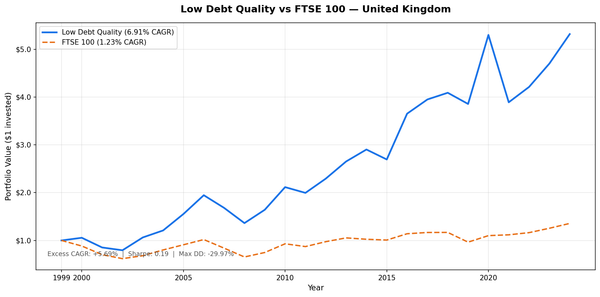
D/E < 0.5 and Piotroski F-Score >= 7 on LSE stocks across 25 years. 6.91% CAGR vs 1.23% FTSE 100. +5.69% excess with 55.66% down capture. 2016 Brexit rally was the standout. 0 cash periods, 55 avg stocks.
quality investing
D/E < 0.5 + Piotroski F-Score >= 7 on SET-listed stocks, backtested 2000-2025. 3.85% CAGR vs 5.13% SET Index, trailing by 1.28% annually. Down capture of 67.48%, max drawdown -32.25% vs -35.59%. Defensive characteristics with reasonable upside participation.