
FCF Growth Stocks: Lower Drawdowns, Lower Returns (25-Year Backtest)
We backtested FCF growth stocks across NYSE, NASDAQ, AMEX from 2000 to 2025. The strategy absorbs crashes at half the rate of SPY (50.6% down capture) but trails on absolute return (5.98% vs 7.83% CAGR). Honest results from a 25-year run.

The FCF growth screen produces a quality portfolio that survives crashes better than the index. From 2000 to 2025, it cut drawdowns nearly in half compared to SPY while staying fully invested throughout. The tradeoff is real: you give up meaningful absolute return to get that protection, and the strategy bleeds badly in late-cycle momentum regimes.
Contents
- Method
- The Screen
- Simple Screen
- Advanced Screen
- Results
- When It Works
- When It Fails
- Annual Returns
- Limitations
- Global Context
- Run It Yourself
Data: FMP financial data warehouse, 2000–2025. Updated March 2026.
Method
The strategy selects US stocks with genuine cash generation growth. FCF must grow more than 15% year-over-year, and operating cash flow must grow too. That second condition matters. Without it, a company can lift FCF simply by slashing capital expenditures, which looks like growth in the signal but isn't growth in the business.
Quality filters keep the portfolio away from leveraged, low-return companies: ROE above 10% and debt-to-equity below 1.5. The top 30 stocks by FCF growth rate get equal-weighted and held for a year.
| Parameter | Setting |
|---|---|
| Universe | NYSE, NASDAQ, AMEX |
| Market cap | >$500M |
| Signal | FCF growth YoY >15%, OCF growth YoY >0% |
| Quality | ROE >10%, D/E <1.5 |
| Selection | Top 30 by FCF growth, equal weight |
| Cash rule | Hold cash if <10 qualify |
| Rebalancing | Annual (July), 45-day data lag |
| Execution | MOC (next-day close after rebalance signal) |
| Costs | Size-tiered transaction costs |
| Benchmark | S&P 500 Total Return (SPY) |
| Period | 2000–2025 (25 periods) |
| Code | github.com/ceta-research/backtests |
The 45-day data lag after fiscal year-end prevents lookahead bias. Annual statements filed in June don't enter the July rebalance. Entry and exit prices use the next trading day's close after each rebalance date (MOC execution), which correctly models realistic order execution.
The academic grounding comes from Sloan (1996), who showed that cash-backed earnings outperform accrual-heavy earnings. Companies that report earnings mostly backed by actual cash tend to continue outperforming. The FCF growth signal is a direct application of that idea: filter for companies where cash generation is accelerating, not just earnings on paper.
The Screen
Simple Screen
Ranks US-listed stocks by year-over-year FCF growth, with a 15% minimum threshold and $500M market cap floor. Run it directly: cetaresearch.com/data-explorer?q=w3834QIr-y
SELECT cc.symbol,
    ROUND((cc.fcf - cp.fcf_prior) / ABS(cp.fcf_prior) * 100, 1) AS fcf_growth_pct,
    ROUND(cc.fcf / 1e6, 1) AS fcf_m,
    ROUND(k.marketCap / 1e9, 2) AS mktcap_bn
FROM (
    SELECT symbol, freeCashFlow AS fcf,
        ROW_NUMBER() OVER (PARTITION BY symbol ORDER BY dateEpoch DESC) AS rn
    FROM cash_flow_statement WHERE period = 'FY' AND freeCashFlow > 0
) cc
JOIN (
    SELECT symbol, freeCashFlow AS fcf_prior,
        ROW_NUMBER() OVER (PARTITION BY symbol ORDER BY dateEpoch DESC) AS rn
    FROM cash_flow_statement WHERE period = 'FY' AND freeCashFlow > 0
) cp ON cc.symbol = cp.symbol AND cp.rn = 2
JOIN key_metrics_ttm k ON cc.symbol = k.symbol
JOIN profile p ON cc.symbol = p.symbol
WHERE cc.rn = 1 AND cp.fcf_prior > 0
  AND (cc.fcf - cp.fcf_prior) / ABS(cp.fcf_prior) > 0.15
  AND k.marketCap > 500000000
  AND p.exchange IN ('NYSE', 'NASDAQ', 'AMEX')
ORDER BY fcf_growth_pct DESC
LIMIT 30
Advanced Screen
Adds the capex-cut guard (OCF must also grow), ROE quality filter, and leverage check. cetaresearch.com/data-explorer?q=FMelEOAY_v
WITH cf_current AS (
    SELECT symbol, freeCashFlow AS fcf, operatingCashFlow AS ocf,
        ROW_NUMBER() OVER (PARTITION BY symbol ORDER BY dateEpoch DESC) AS rn
    FROM cash_flow_statement WHERE period = 'FY' AND freeCashFlow > 0
),
cf_prior AS (
    SELECT symbol, freeCashFlow AS fcf_prior, operatingCashFlow AS ocf_prior,
        ROW_NUMBER() OVER (PARTITION BY symbol ORDER BY dateEpoch DESC) AS rn
    FROM cash_flow_statement WHERE period = 'FY' AND freeCashFlow > 0
)
SELECT cc.symbol,
    ROUND((cc.fcf - cp.fcf_prior) / ABS(cp.fcf_prior) * 100, 1) AS fcf_growth_pct,
    ROUND((cc.ocf - cp.ocf_prior) / ABS(cp.ocf_prior) * 100, 1) AS ocf_growth_pct,
    ROUND(k.returnOnEquityTTM * 100, 1) AS roe_pct,
    ROUND(f.debtToEquityRatioTTM, 2) AS debt_equity,
    ROUND(k.marketCap / 1e9, 2) AS mktcap_bn
FROM cf_current cc
JOIN cf_prior cp ON cc.symbol = cp.symbol AND cp.rn = 2
JOIN key_metrics_ttm k ON cc.symbol = k.symbol
JOIN financial_ratios_ttm f ON cc.symbol = f.symbol
JOIN profile p ON cc.symbol = p.symbol
WHERE cc.rn = 1 AND cp.fcf_prior > 0
  AND (cc.fcf - cp.fcf_prior) / ABS(cp.fcf_prior) > 0.15
  AND (cc.ocf - cp.ocf_prior) / ABS(cp.ocf_prior) > 0.0
  AND k.returnOnEquityTTM > 0.10
  AND f.debtToEquityRatioTTM < 1.5
  AND k.marketCap > 500000000
  AND p.exchange IN ('NYSE', 'NASDAQ', 'AMEX')
ORDER BY fcf_growth_pct DESC
LIMIT 30
Results
| Metric | FCF Growth | SPY |
|---|---|---|
| CAGR | 6.29% | 7.85% |
| Total Return | 359.7% | 561.7% |
| Max Drawdown | -32.01% | -38.01% |
| Volatility | 18.33% | — |
| Sharpe | 0.234 | — |
| Sortino | 0.402 | — |
| Beta | 0.784 | 1.00 |
| Up Capture | 76.5% | — |
| Down Capture | 51.6% | — |
| Win Rate vs SPY | 36% (9/25 years) | — |
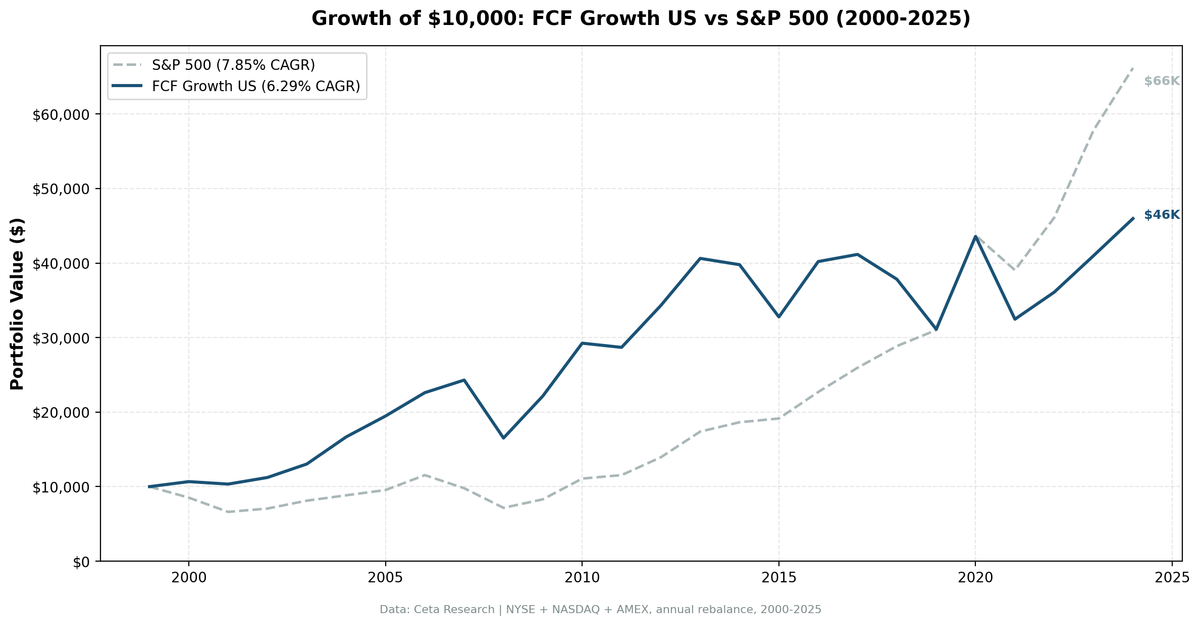
| $10,000 grew to | $45,970 | $66,170 |

The headline number is blunt. SPY returned 7.85% annually over 25 years; this portfolio returned 6.29%. On a dollar basis: $10,000 grew to $45,970 vs $66,170 in SPY. The strategy trails the index.
But the down capture ratio tells a different story. At 51.6%, the portfolio absorbed crashes at roughly half the rate of SPY. When markets fell, these stocks fell less. That asymmetry shows up in the drawdown numbers: -32.01% max drawdown versus SPY's -38.01%, and more meaningfully in how fast the portfolio recovered from stress years.
The Sortino ratio (0.402) is notably better than the Sharpe (0.234) relative to typical benchmarks, which tells you the volatility that does occur skews toward the upside more than the downside.
When It Works
The FCF growth screen earns its keep during market stress and economic transitions.
2000-2001 was the strategy's showcase. While the dot-com bust destroyed SPY by -14.8% then -22.4%, the portfolio returned +6.7% and -3.1%. Excess returns: +21.5% and +19.3% in consecutive years. Companies with real cash generation simply weren't in the sectors that imploded.
2007 was another standout: +7.5% portfolio return when SPY dropped -15.2%, a +22.7% excess return. The sub-prime unwind hit financial stocks hard. FCF-generating companies in other sectors mostly avoided direct exposure.
2004 (+19.0% excess) and 2009 (+18.2% excess) show the strategy also works in early recovery phases. After a crash, companies with durable cash generation tend to re-rate faster than speculative names. The portfolio caught the 2009 rebound while maintaining quality filters.
The pattern is consistent: the screen works when the market is punishing companies that can't back up their earnings with cash, whether that's dot-com era accounting games, 2007-2008 leverage, or post-crisis recovery.
When It Fails
The strategy has a clear failure mode: late-cycle momentum regimes when investors pay premium multiples for growth regardless of cash quality.
2019 was the worst single year: -17.7% portfolio return when SPY rose +7.4%, a -25.2% excess return. The 2019 market was driven by multiple expansion in high-growth, often FCF-negative technology names. The FCF quality filter systematically excluded the exact companies driving returns. You were holding the right businesses and watching the wrong ones win.
2018 was similar: -8.1% portfolio, +11.2% SPY. 2017 was quieter but still painful: +2.4% vs +14.3%.
The 2015 result (-20.3% excess) came during a mid-cycle rotation where energy sector companies, many of which had strong FCF histories, saw their cash generation collapse with oil prices. A backwards-looking FCF filter doesn't protect against a sudden shift in the underlying business environment.
2021 is instructive: -25.5% portfolio vs -10.7% SPY. Post-pandemic, markets rewarded story stocks over cash-flow machines. The companies that qualified under this screen in 2020 weren't positioned for the SPAC and speculative growth frenzy that dominated 2021.
2008 warrants a separate note. The portfolio lost -32.0% while SPY lost -26.9%. FCF-generating companies weren't immune to a credit crisis. When markets seize and correlations go to one, quality screens don't help. The "down capture" figure of 51.6% is a 25-year average that includes some years when the portfolio absorbed less. In the worst single year, it didn't.
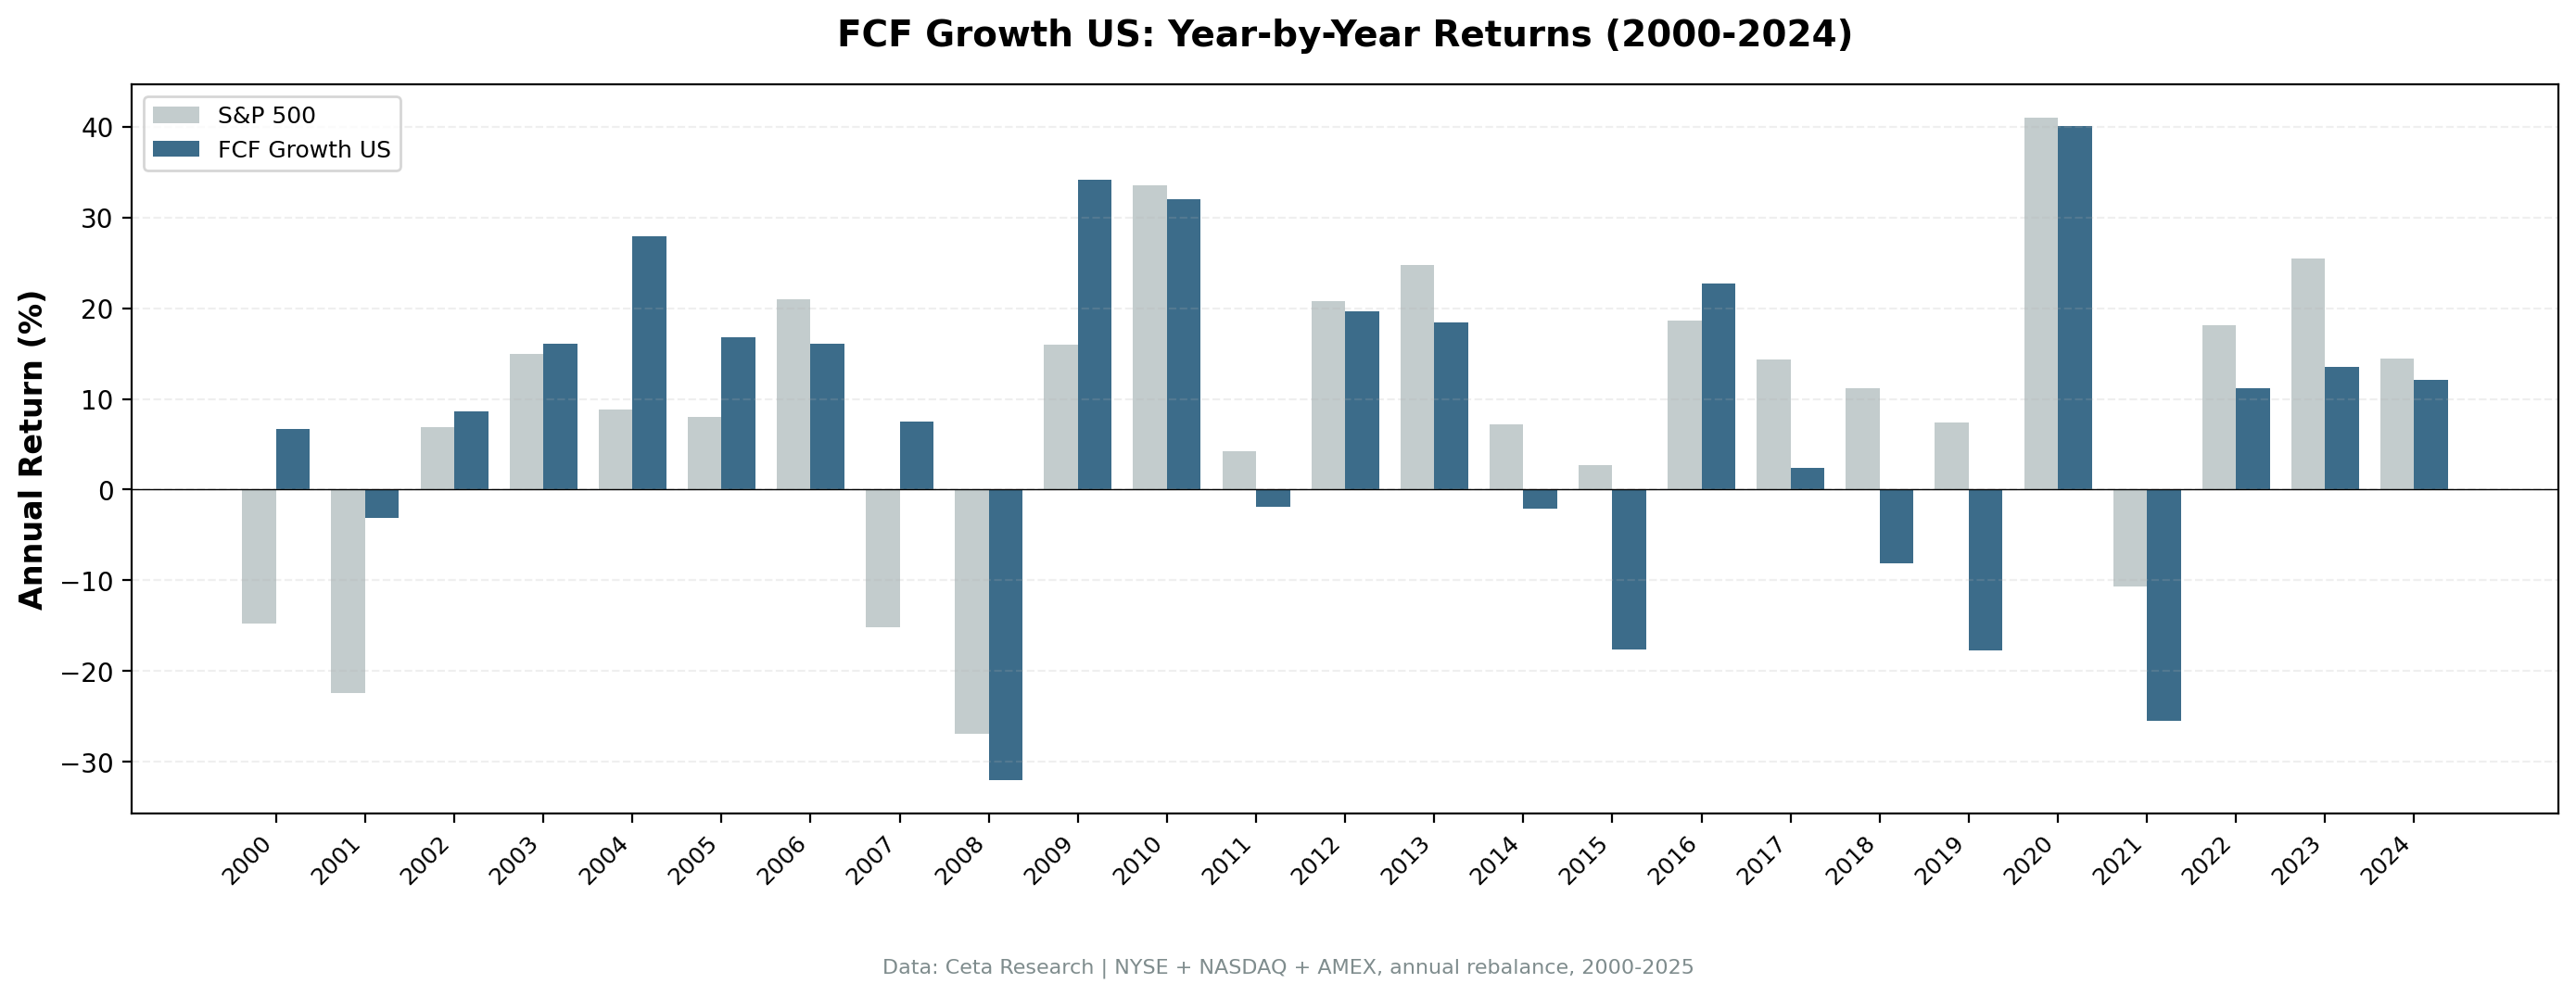
Annual Returns
| Year | Portfolio | SPY | Excess |
|---|---|---|---|
| 2000 | +6.7% | -14.8% | +21.5% |
| 2001 | -3.1% | -22.4% | +19.3% |
| 2002 | +8.6% | +6.9% | +1.7% |
| 2003 | +16.1% | +14.9% | +1.2% |
| 2004 | +27.9% | +8.9% | +19.0% |
| 2005 | +16.8% | +8.0% | +8.8% |
| 2006 | +16.1% | +20.9% | -4.8% |
| 2007 | +7.5% | -15.2% | +22.7% |
| 2008 | -32.0% | -26.9% | -5.1% |
| 2009 | +34.2% | +16.0% | +18.2% |
| 2010 | +32.0% | +33.5% | -1.6% |
| 2011 | -1.9% | +4.2% | -6.1% |
| 2012 | +19.6% | +20.7% | -1.1% |
| 2013 | +18.4% | +24.7% | -6.3% |
| 2014 | -2.1% | +7.2% | -9.3% |
| 2015 | -17.6% | +2.7% | -20.3% |
| 2016 | +22.7% | +18.6% | +4.1% |
| 2017 | +2.4% | +14.3% | -12.0% |
| 2018 | -8.1% | +11.2% | -19.3% |
| 2019 | -17.7% | +7.4% | -25.2% |
| 2020 | +40.0% | +41.0% | -0.9% |
| 2021 | -25.5% | -10.7% | -14.8% |
| 2022 | +11.2% | +18.1% | -6.9% |
| 2023 | +13.6% | +25.4% | -11.9% |
| 2024 | +12.1% | +14.4% | -2.3% |
The win rate against SPY is 36% (9 out of 25 years). The 9 outperforming years cluster in bear markets and early recoveries. The 16 underperforming years dominate bull runs.
Limitations
Backward-looking signal. FCF growth from the prior fiscal year doesn't predict FCF growth in the coming year. A company that generated strong cash last year may face margin compression, capex requirements, or industry headwinds this year. The screen captures past cash quality, not future cash quality.
No forward guidance. The strategy can't distinguish between FCF growth from genuine business expansion versus one-time working capital releases, asset sales, or deferred maintenance. The OCF growth guard helps, but it's imperfect.
25-year sample period. The strategy's best stretch was 2000-2009. That period included two major market dislocations where cash generation mattered acutely. Post-2010, the strategy has been largely underwater against SPY. Whether the post-2009 underperformance is regime-specific or structural isn't answerable from this data set.
Concentration. 30 stocks equal-weighted creates idiosyncratic risk. One sector or theme rotation can drive large single-year swings.
Transaction costs. The backtest uses size-tiered cost estimates. Real-world costs depend on position sizing, liquidity, and execution. For smaller portfolios, per-share commission structures change the math.
Point-in-time data. All rebalances use data available 45 days after fiscal year-end to prevent lookahead bias. Live implementation requires the same discipline, which means working with a data provider that offers verified point-in-time financial statements.
Global Context
This analysis covers US-listed stocks only. The FCF growth signal behaves differently across markets. A global comparison across exchanges is covered in the companion blog on the FCF growth strategy's international results.
Run It Yourself
Both screens query the Ceta Research FMP warehouse directly.
Today's FCF growth leaders (simple): cetaresearch.com/data-explorer?q=w3834QIr-y
With quality filters (advanced): cetaresearch.com/data-explorer?q=FMelEOAY_v
The full backtest code, including methodology, annual rebalance logic, and cost model, is on GitHub: github.com/ceta-research/backtests
Data: Ceta Research (FMP warehouse), TTM metrics. Backtest period: 2000–2025. Execution: MOC (next-day close).
Past performance does not guarantee future results. This is educational content, not investment advice.


