S&P 500
S&P 500 Additions: 25 Years of Index Effect Data
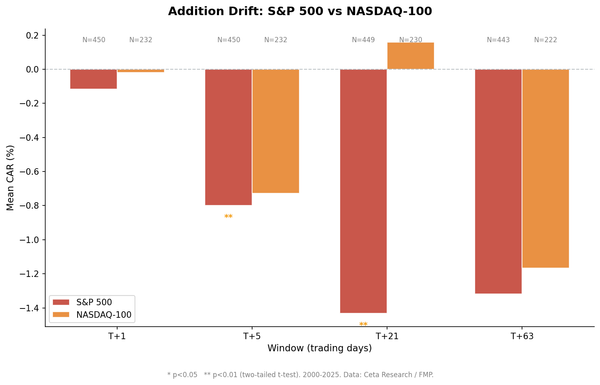
We measured the price impact of 537 S&P 500 additions from 2000 to 2025. Additions underperform the market by 0.86% at T+5 (t = -3.63). The classic academic finding has reversed.

S&P 500
We measured the price impact of 537 S&P 500 additions from 2000 to 2025. Additions underperform the market by 0.86% at T+5 (t = -3.63). The classic academic finding has reversed.
S&P 500
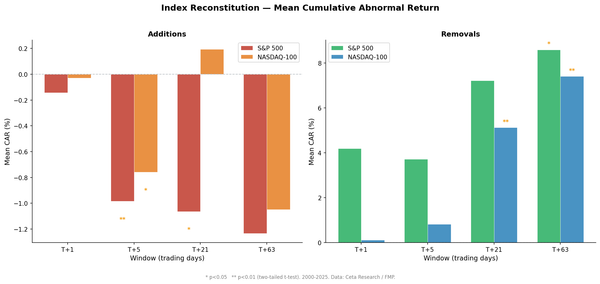
We measured cumulative abnormal returns for 196 S&P 500 removals from 2000 to 2025. The overall mean at T+63 is +8.6%, but five extreme events drive the entire result. In the 2020s, removals continue declining. The classic recovery pattern is dead.
survivorship bias
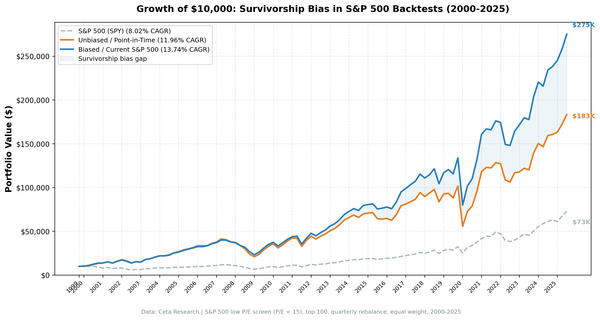
We ran the same value screen on the S&P 500 twice: once with today's members, once with historical membership. Survivorship bias inflated CAGR by 2.02% and hid 7.8 percentage points of drawdown over 25 years. The risk distortion is worse than the return distortion.
equity growth
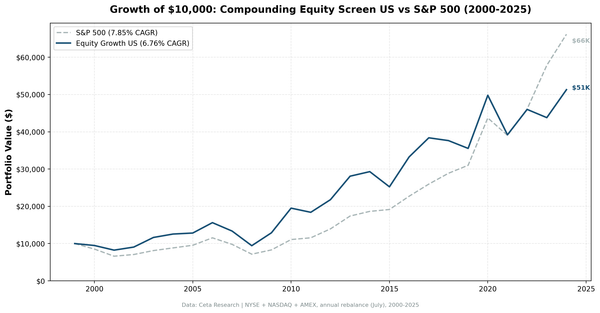
We ran the Compounding Equity Screen on all US exchanges from 2000 to 2025. 6.76% CAGR vs 7.85% for the S&P 500. The strategy underperforms by 1.09% annually. In 2023, it returned -4.8% while SPY gained 25.4%. Here is what the data shows and why it happens.