
S&P 500 Removals: 25 Years of Data on What Happens After Stocks Get Kicked Out
We measured cumulative abnormal returns for 196 S&P 500 removals from 2000 to 2025. The overall mean at T+63 is +8.6%, but five extreme events drive the entire result. In the 2020s, removals continue declining. The classic recovery pattern is dead.

We measured the price impact of every S&P 500 removal from 2000 to 2025. The textbook story says removals drop from forced selling, then fully recover. Our data tells a more complex story. The overall mean cumulative abnormal return at T+63 is +6.0%. But the median is -0.3%, and only 47.7% of removals recover. Five extreme events drive the positive result. A portfolio strategy of going long on removals produces 26.37% CAGR with +18.65% excess return vs SPY, but at the cost of a -74.91% maximum drawdown. The pattern works, but it's volatile, era-dependent, and requires stomach for crisis-level losses.
Contents
- Method
- The Academic Background
- The Screens
- Simple Screen: Recent Removals
- Advanced Screen: Tradeable Removals with Volume Confirmation
- What We Found
- The headline numbers are misleading
- Five events drive the result
- The decade breakdown reveals the real story
- Additions vs removals: the asymmetry is real but complex
- Can You Trade This?
- NASDAQ-100: A different story
- Verdict
- Limitations
- Takeaway
- References
Data: FMP financial data warehouse, 2000–2025. Updated April 2026.
Method
Data source: Ceta Research (FMP financial data warehouse) Universe: All S&P 500 removal events, 2000-2025 Events: 199 unique removals, 182 with price data at T+1, 174 at T+63 Exclusion: Events with no price data 30+ trading days post-removal (bankruptcies, immediate delistings) Benchmark: SPY (S&P 500 ETF) Return type: Cumulative abnormal return (CAR) = stock return minus SPY return over the same window Execution: MOC (market-on-close) for portfolio simulation. Entry at next-day close after event announcement.
Measurement windows: - T+1: One trading day after removal - T+5: One week - T+21: One month - T+63: Three months
Event dates are derived from the dateAdded field in the historical constituent table (the date the replacement was added, which is when the removal took effect). Full methodology: backtests/METHODOLOGY.md
The Academic Background
Chen, Noronha, and Singal studied S&P 500 index changes in the Journal of Finance (2004). They found an asymmetry: when stocks join the index, prices spike then partially revert. When stocks leave, prices drop then fully recover. The recovery for removals was more complete than the reversion for additions.
Lynch and Mendenhall (1997) documented similar patterns earlier, noting the temporary nature of index effects. The explanation: index funds are forced sellers on removal day. Once the selling pressure ends, value buyers step in and prices normalize.
That was the theory. We tested it on 25 years of modern data.
The Screens
Simple Screen: Recent Removals
SELECT DISTINCT
    removedTicker AS symbol,
    CAST(TRY_STRPTIME(dateAdded, '%B %d, %Y') AS DATE) AS removal_date
FROM historical_sp500_constituent
WHERE removedTicker IS NOT NULL
  AND LENGTH(TRIM(removedTicker)) > 0
  AND TRY_STRPTIME(dateAdded, '%B %d, %Y') IS NOT NULL
  AND CAST(TRY_STRPTIME(dateAdded, '%B %d, %Y') AS DATE) >= CURRENT_DATE - INTERVAL '365' DAY
ORDER BY removal_date DESC
LIMIT 30
This returns all S&P 500 removals in the last 12 months. Note: dateAdded is the event date for both additions and removals (the date the swap took effect).
Try this screen on Ceta Research →
Advanced Screen: Tradeable Removals with Volume Confirmation
WITH removals AS (
    SELECT DISTINCT
        removedTicker AS symbol,
        CAST(TRY_STRPTIME(dateAdded, '%B %d, %Y') AS DATE) AS removal_date
    FROM historical_sp500_constituent
    WHERE removedTicker IS NOT NULL
      AND LENGTH(TRIM(removedTicker)) > 0
      AND TRY_STRPTIME(dateAdded, '%B %d, %Y') IS NOT NULL
      AND CAST(TRY_STRPTIME(dateAdded, '%B %d, %Y') AS DATE) >= '2020-01-01'
),
still_trading AS (
    SELECT r.symbol, r.removal_date,
        COUNT(*) AS trade_days_after,
        MAX(CAST(p.date AS DATE)) AS last_trade
    FROM removals r
    JOIN stock_eod p ON r.symbol = p.symbol
        AND CAST(p.date AS DATE) > r.removal_date
        AND CAST(p.date AS DATE) <= r.removal_date + INTERVAL '90' DAY
    GROUP BY r.symbol, r.removal_date
)
SELECT r.symbol, r.removal_date, s.trade_days_after, s.last_trade
FROM removals r
JOIN still_trading s ON r.symbol = s.symbol AND r.removal_date = s.removal_date
WHERE s.last_trade > r.removal_date + INTERVAL '60' DAY
ORDER BY r.removal_date DESC
This filters for stocks that still traded 60+ days post-removal, excluding bankruptcies and immediate delistings.
Try this screen on Ceta Research →
What We Found
The headline numbers are misleading
| Window | Mean CAR | Median CAR | t-stat | N | Hit Rate |
|---|---|---|---|---|---|
| T+1 | +0.53% | -0.07% | 0.75 | 182 | 47.3% |
| T+5 | +0.77% | -0.25% | 0.70 | 179 | 48.0% |
| T+21 | +3.95% | +0.54% | 1.95 | 179 | 53.1% |
| T+63 | +6.00%* | -0.33% | 2.29 | 174 | 47.7% |
* significant at 5%
The T+63 mean of +6.0% is statistically significant at 5%. If you stopped there, you'd conclude removals recover. But look at the medians: near zero or negative at every window. The hit rate at T+63 is 47.7%, meaning more than half of removal events don't recover at all.
The mean and median diverge because a handful of extreme events pull the average up while the typical removal goes nowhere.
Five events drive the result
| Symbol | Date | T+1 CAR | T+63 CAR | Context |
|---|---|---|---|---|
| SOV | 2009-01-29 | +737.2% | +573.2% | Santander acquisition during crisis |
| PCG | 2019-01-17 | +12.4% | +219.4% | PG&E restructuring rebound |
| OI | 2000-12-08 | -10.9% | +174.1% | Post-dot-com recovery |
| NCR | 2007-09-28 | +100.6% | +114.1% | Pre-crisis rebound |
| SITC | 2009-03-27 | -8.1% | +121.7% | Financial crisis bottom |
SOV alone contributes roughly 3 percentage points to the overall T+1 mean. When we cap all CARs at +/-100%, the picture changes:
| Window | Raw Mean | Capped Mean | Difference |
|---|---|---|---|
| T+1 | +4.20% | +0.93% | -3.27% |
| T+5 | +3.72% | +0.18% | -3.54% |
| T+21 | +7.22% | +3.06% | -4.16% |
| T+63 | +8.60% | +4.39% | -4.21% |
After capping, T+1 and T+5 are essentially zero. T+21 and T+63 remain positive but halved.
The decade breakdown reveals the real story
| Period | Events (T+63) | T+5 CAR | T+21 CAR | T+63 CAR | T+63 Hit Rate |
|---|---|---|---|---|---|
| 2000s | 51 | +13.2% | +21.9% | +26.2%* | 72.5% |
| 2010s | 69 | +1.1% | +2.5% | +5.1% | 53.6% |
| 2020s | 61 | -1.4% | -2.0% | -2.8% | 24.6% |
The 2000s drive the entire overall result. Financial crisis-era removals (AIG, GM, Fannie Mae, Freddie Mac) saw extreme recoveries as panic subsided. These weren't typical removal events. They were crisis-distressed stocks bouncing off extreme lows.
In the 2010s, the effect weakened but remained positive. In the 2020s, it reversed completely. Removed stocks continue declining, with a -2.8% mean CAR at T+63 and only 25% recovering. The 2020s result is driven by 69 events with a T+1 CAR of -0.84% (significant at 5%). Modern removals reflect genuine fundamental deterioration, not temporary index mechanics.
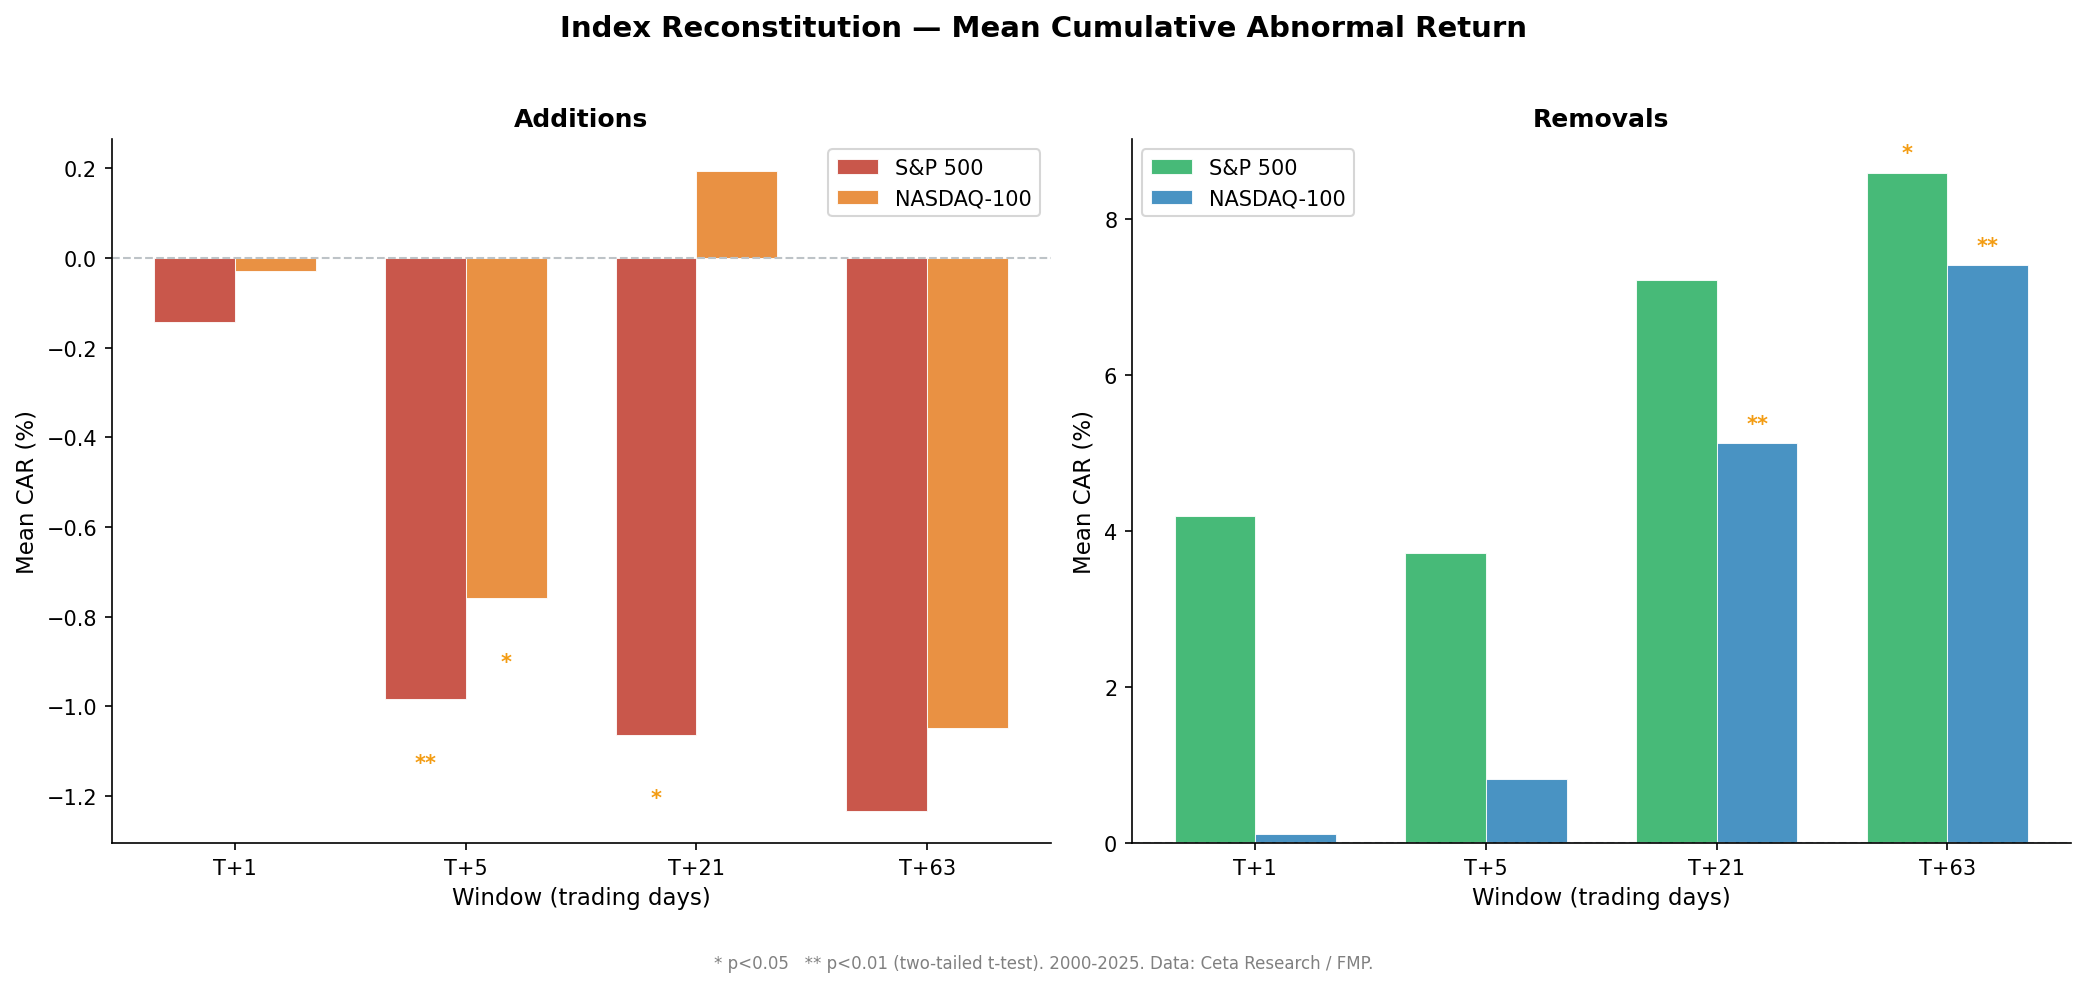
Additions vs removals: the asymmetry is real but complex
| Window | Additions CAR | Removals CAR | Gap |
|---|---|---|---|
| T+1 | -0.14% | +4.20% | +4.34% |
| T+5 | -0.98%** | +3.72% | +4.70% |
| T+21 | -1.06%* | +7.22% | +8.29% |
| T+63 | -1.23% | +8.60%* | +9.83% |
** significant at 1%, * significant at 5%
Additions consistently underperform after joining the index. This is the more robust finding: the "buy high, sell low" behavior of index funds creates negative abnormal returns for new members. The addition effect is statistically significant at T+5 and T+21.
The removal "recovery" is positive but driven by outliers. The real asymmetry: additions reliably underperform, removals don't reliably recover.
Can You Trade This?
We tested a simple portfolio strategy: go long every S&P 500 removal at the next-day close (MOC execution), hold for 21 trading days, equal-weight all positions in each calendar month. Results for 2000-2025:
| Metric | S&P 500 Removals | SPY Benchmark | Excess |
|---|---|---|---|
| CAGR | 26.37% | 7.71% | +18.65% |
| Max Drawdown | -74.91% | N/A | N/A |
| Sharpe Ratio | 0.267 | N/A | N/A |
| Sortino Ratio | 0.679 | N/A | N/A |
| Win Rate | 49.5% | N/A | N/A |
The strategy works. Over 25 years, it produces +18.65% excess return vs SPY. But there are severe caveats:
Drawdown of -74.91%. In 2008, the portfolio dropped -64.63% vs SPY's -27.01%. That's a -37.61% underperformance in a single year. You'd need to stomach crisis-level losses to capture the long-term excess.
Sharpe of 0.267 is mediocre. The risk-adjusted return is weak. You're getting paid for volatility and tail risk, not for a structural edge.
Win rate is 49.5%. You're wrong more often than you're right. The excess comes from a few extreme positive outliers, not from consistent wins.
Era dependence. As the event study shows, the 2000s produced +26.2% mean CAR at T+63 (72.5% hit rate). The 2020s show -2.8% (24.6% hit rate). If you started this strategy in 2020 based on the historical mean, you'd be underwater.
Extreme outlier dependence. Five events (SOV, PCG, OI, NCR, SITC) drive much of the result. These are crisis recoveries and restructuring rebounds, not repeatable patterns.
Fundamental risk. Stocks get removed for reasons. Sometimes that reason is temporary (market cap drift during a sell-off). Sometimes it's permanent (business in decline, competitive moat eroded). The portfolio can't distinguish the two in advance.
NASDAQ-100: A different story
For comparison, we tested the same strategy on NASDAQ-100 removals (long at T+1, hold 21 days):
| Metric | NASDAQ-100 Removals | QQQ Benchmark | Excess |
|---|---|---|---|
| CAGR | 98.95% | 13.59% | +85.36% |
| Max Drawdown | -23.5% | N/A | N/A |
| Sharpe Ratio | 2.027 | N/A | N/A |
The NASDAQ-100 strategy produces dramatically better results: +85.36% excess return with a Sharpe of 2.027 and only -23.5% max drawdown. The risk-adjusted performance is strong. But the sample size is smaller (166 removal events vs 199 for S&P 500), and the result is more concentrated in a few large winners.
Verdict
The S&P 500 removal strategy works historically (+18.65% excess), but it requires: - Tolerance for -74.91% drawdowns (worse than buy-and-hold SPY during 2008) - Discipline to hold through years where it underperforms badly - Acceptance that you're betting on rare extreme rebounds, not a reliable edge
The NASDAQ-100 variant is more compelling (+85.36% excess, Sharpe 2.027), but comes with execution challenges (smaller sample size, concentration risk, potential overfitting to tech recoveries).
If you can handle the volatility and have a multi-decade horizon, the portfolio simulation suggests the pattern is tradeable. But it's not a "safe" arbitrage. You're harvesting crisis premium and restructuring upside, which means you'll get hit hard during the very events that set up the opportunity.
Limitations
Bankruptcy identification is imperfect. We use price data availability as a proxy for whether a stock still trades. Stocks that moved to OTC markets may be misclassified.
Removal reason not coded. The data doesn't categorize why each stock was removed (M&A, market cap decline, bankruptcy). We can't perfectly filter by removal type.
Survivorship in price data. For stocks approaching zero, final prices may be imprecise or missing, potentially biasing results.
No transaction costs. Reported CARs are gross. The actual returns from trading this pattern would be lower after spread, commission, and market impact.
Single market. This study covers S&P 500 only. Results may differ for other indices (we also tested NASDAQ-100; see the event-index-recon backtest for comparison).
Takeaway
The S&P 500 removal recovery pattern is era-dependent and outlier-driven. In the 2000s, crisis-era removals produced extreme recoveries that inflate the overall mean. In the 2020s, the pattern has reversed: removed stocks continue declining, with only 25% recovering by three months.
The academic framework from Chen et al. (2004) described a real phenomenon, but markets have adapted. Front-running of predictable index changes has compressed the opportunity. And modern removals increasingly reflect genuine fundamental problems rather than temporary index mechanics.
Overall averages are misleading. The mean says recovery. The median says no. If you're thinking about trading this, the 2020s data is the relevant sample, not the full 25-year average.
References
- Chen, H., Noronha, G., & Singal, V. (2004). The Price Response to S&P 500 Index Additions and Deletions. Journal of Finance, 59(4), 1901-1929.
- Lynch, A. & Mendenhall, R. (1997). New Evidence on Stock Price Effects Associated with Changes in the S&P 500 Index. Journal of Business, 70(3), 351-383.
- Doeswijk, R. (2005). Index Arbitrage and the Pricing of Index Futures. Journal of Futures Markets, 25(3), 209-243.
Data: Ceta Research (FMP financial data warehouse). Event study: 2000-2025, 199 S&P 500 removals, 166 NASDAQ-100 removals. Portfolio simulation uses MOC (market-on-close) execution with entry at T+1 (next-day close). Not investment advice.


