
uk stocks
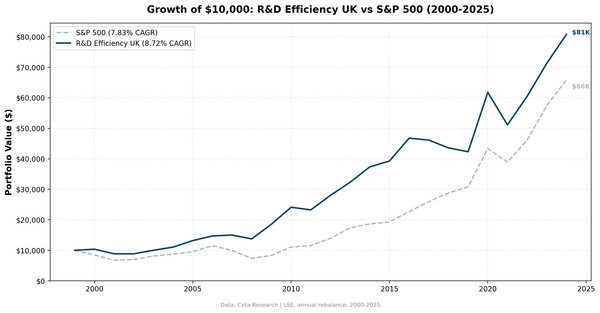
R&D Efficiency Backtest (UK): 8.45% CAGR, +7.22% vs FTSE 100, -17% Max Drawdown
The UK R&D efficiency screen returned 8.45% CAGR over 25 years. The FTSE 100 price index returned 1.23%. That is +7.22% annual excess, the strongest result across 10 global markets. Max drawdown was -17.26%. Returns in GBP. Benchmark caveat: FTSE 100 is price-return only.