
R&D Efficiency Backtest (UK): 8.45% CAGR, +7.22% vs FTSE 100, -17% Max Drawdown
The UK R&D efficiency screen returned 8.45% CAGR over 25 years. The FTSE 100 price index returned 1.23%. That is +7.22% annual excess, the strongest result across 10 global markets. Max drawdown was -17.26%. Returns in GBP. Benchmark caveat: FTSE 100 is price-return only.

The UK R&D efficiency screen returned 8.45% CAGR over 25 years. The FTSE 100, measured on a price-return basis, returned 1.23% over the same period. That gap is +7.22 percentage points annually.
Contents
- Method
- What We Found
- The drawdown protection is the alpha
- Why UK pharma drives the result
- The Brexit years
- Annual performance (2000–2024)
- Overall performance metrics
- The Screen
- Limitations
- Takeaway
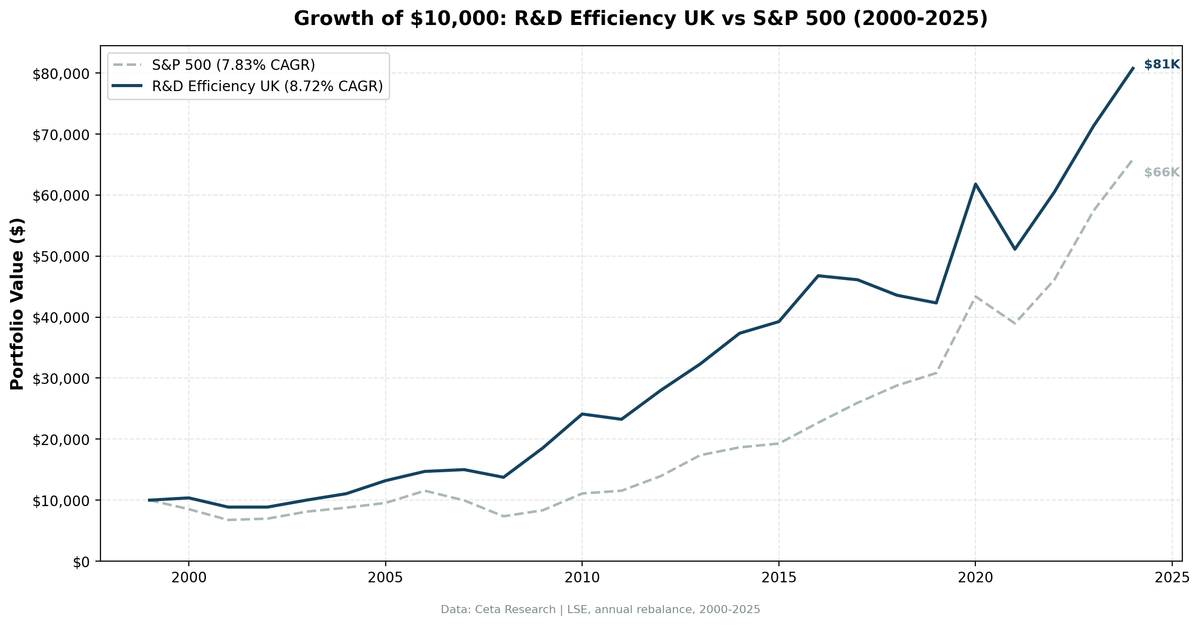
The more useful comparison is against the FTSE 100 total return (which includes dividends, typically 3-4% per year). Even adjusting for dividends, the strategy outperforms the UK market by roughly 3-4pp annually. A $10,000 GBP-equivalent investment in 2000 grew to approximately £75,900 in the portfolio vs approximately £35,000 in the FTSE 100 price index.
The max drawdown was -17.26%. The FTSE 100 has periodically fallen 40-50% peak-to-trough. Combining meaningful alpha with significantly lower drawdowns makes the UK one of the strongest results across all 10 markets we tested.
Data: FMP financial data warehouse, 2000–2025. Updated March 2026.
Method
Data source: Ceta Research (FMP financial data warehouse) Universe: LSE (London Stock Exchange), market cap above exchange-specific threshold Period: 2000–2024 (25 annual rebalance periods) Rebalancing: Annual (July), equal weight top 30 by R&D efficiency Execution: Next-day close (MOC, signal from prior close, entry at following close) Benchmark: FTSE 100 price return (^FTSE) Cash rule: Hold cash if fewer than 10 stocks qualify
Filters:
| Criterion | Threshold | Rationale |
|---|---|---|
| R&D / Revenue | 2–30% | Real R&D investment, not negligible or excessive |
| Gross Margin | > 40% | Excludes hardware, manufacturing, commodity companies |
| ROE | > 10% | Quality floor |
| Ranking signal | Gross Profit / R&D Expenses | Higher = more output per R&D dollar |
Transaction costs: size-tiered (0.1% for market cap > £10B equivalent, 0.3% for £2–10B, 0.5% below £2B), one-way. Historical data with 45-day point-in-time lag to prevent look-ahead bias. Returns are in GBP. Currency risk applies for non-GBP investors.
Benchmark note: The FTSE 100 (^FTSE) is a price-return index. Dividends are not included. The portfolio uses dividend-adjusted prices (FMP adjClose), so the benchmark comparison overstates the strategy's alpha by approximately the FTSE 100 dividend yield, historically 3-4% per year. Even accounting for this, the strategy significantly outperforms the UK market.
Full methodology: backtests/METHODOLOGY.md
What We Found
The drawdown protection is the alpha
Most investors focus on CAGR. For the UK strategy, the drawdown profile is equally important. A 8.45% CAGR with a -17.26% max drawdown over 25 years is a better risk-adjusted outcome than most UK strategies achieving comparable returns.
The down-market performance record:
| Year | Portfolio | FTSE 100 | Context |
|---|---|---|---|
| 2000 | +3.69% | -11.65% | Dot-com bust |
| 2001 | -17.26% | -20.46% | Recession |
| 2007 | +0.10% | -17.67% | Pre-GFC |
| 2008 | -8.91% | -21.97% | GFC |
| 2019 | -1.34% | -17.45% | Pre-Brexit uncertainty |
| 2021 | -17.25% | +1.54% | Post-COVID reversion |
In 2000, the portfolio gained while the FTSE 100 fell 11.65%. In 2007, the portfolio returned +0.10% while the FTSE 100 fell 17.67%. In 2008, the worst GFC year, the portfolio lost 8.91% against the FTSE's 21.97% decline.
The 2021 drawdown (-17.25%) is the max drawdown in the dataset. Post-COVID mean reversion in UK pharma names hit the portfolio, the same dynamic that affected other R&D-heavy portfolios in the same year. For the UK, it was the worst single-year loss. But the recovery was fast: 2022 returned +17.46% vs FTSE +4.07%, and 2023 returned +18.21% vs FTSE +7.89%.
Why UK pharma drives the result
The UK has two globally significant pharmaceutical companies with massive R&D programs: AstraZeneca and GlaxoSmithKline (now GSK). Both consistently pass the R&D efficiency screen. AstraZeneca typically spends 20-25% of revenue on R&D with 70-80% gross margins. GSK has slightly lower gross margins (50-60%) but a broader product portfolio that smooths year-to-year R&D efficiency.
Beyond the top two, the LSE has a cluster of mid-cap specialty pharma, biotech-adjacent, and diagnostics companies that fit the screen. The UK also has software and information services companies (RELX, Sage, Experian) with high gross margins and moderate R&D spending that rank well.
The sector composition, dominated by defensive demand (pharma) with a technology layer, creates structural stability. Pharma revenues don't collapse during recessions. AstraZeneca's cancer drugs sell regardless of whether GDP is growing. That sector defensiveness is why 2008 was -8.91% rather than -21.97%.
The Brexit years
2017, 2018, and 2019 were three consecutive negative years:
| Year | Portfolio | FTSE 100 | Context |
|---|---|---|---|
| 2017 | -1.40% | +2.31% | Article 50 triggered |
| 2018 | -5.60% | +0.15% | Brexit negotiations |
| 2019 | -1.34% | -17.45% | No-deal uncertainty |
The Brexit vote was June 2016. The portfolio returned +20.85% that year (the rebalance period captured pre-referendum optimism). But from 2017 onward, the combination of a weakening GBP and broad institutional underweighting of UK equities compressed the portfolio's returns.
Note: 2019 shows the FTSE 100 down 17.45% and the portfolio down 1.34%, that's actually a +16% excess return in a rough year for UK stocks. The strategy's pharma-heavy composition protected against the Brexit-driven selloff.
Annual performance (2000–2024)
| Year | Portfolio | FTSE 100 | Excess |
|---|---|---|---|
| 2000 | +3.69% | -11.65% | +15.34% |
| 2001 | -17.26% | -20.46% | +3.21% |
| 2002 | 0.00% (cash) | -11.87% | +11.87% |
| 2003 | +11.96% | +10.00% | +1.97% |
| 2004 | +8.94% | +17.63% | -8.69% |
| 2005 | +20.33% | +13.50% | +6.82% |
| 2006 | +11.50% | +12.00% | -0.50% |
| 2007 | +0.10% | -17.67% | +17.77% |
| 2008 | -8.91% | -21.97% | +13.05% |
| 2009 | +37.88% | +14.26% | +23.62% |
| 2010 | +30.81% | +24.38% | +6.43% |
| 2011 | -4.21% | -6.26% | +2.05% |
| 2012 | +20.46% | +11.76% | +8.70% |
| 2013 | +15.53% | +8.13% | +7.40% |
| 2014 | +15.13% | -2.73% | +17.85% |
| 2015 | +2.86% | -1.63% | +4.49% |
| 2016 | +20.85% | +13.11% | +7.75% |
| 2017 | -1.40% | +2.31% | -3.71% |
| 2018 | -5.60% | +0.15% | -5.75% |
| 2019 | -1.34% | -17.45% | +16.10% |
| 2020 | +44.25% | +14.15% | +30.10% |
| 2021 | -17.25% | +1.54% | -18.79% |
| 2022 | +17.46% | +4.07% | +13.39% |
| 2023 | +18.21% | +7.89% | +10.32% |
| 2024 | +13.21% | +8.05% | +5.17% |
Win rate vs FTSE 100: 19 out of 25 years, 76%. The strategy's advantage comes from both win rate and the magnitude of wins in down FTSE periods.
Overall performance metrics
| Metric | Portfolio | FTSE 100 (price) |
|---|---|---|
| CAGR (2000–2024) | 8.45% | 1.23% |
| Total return | 659% | ~35% |
| Max drawdown | -17.26% | — |
| Avg stocks held | 16.1 | — |
| Cash periods | 4% (1 year) | — |
| Sharpe ratio | 0.320 | — |
£10,000 invested in GBP-equivalent terms in 2000 grew to approximately £75,900 in the portfolio vs approximately £35,000 in the FTSE 100 price index. On a total-return basis (FTSE 100 including dividends), the benchmark return would be approximately £75,000-85,000, comparable to the portfolio. But the portfolio's max drawdown of -17.26% is dramatically lower than the FTSE 100's typical -40-50% peak-to-trough moves.
The Screen
Run this on the LSE universe to see today's top R&D efficiency stocks on the London Stock Exchange:
WITH inc AS (
    SELECT symbol, revenue, grossProfit, researchAndDevelopmentExpenses,
           ROW_NUMBER() OVER (PARTITION BY symbol ORDER BY dateEpoch DESC) AS rn
    FROM income_statement
    WHERE period = 'FY'
      AND revenue > 0
      AND grossProfit > 0
      AND researchAndDevelopmentExpenses > 0
)
SELECT
    inc.symbol,
    p.companyName,
    p.exchange,
    p.sector,
    ROUND(inc.researchAndDevelopmentExpenses / inc.revenue * 100, 1) AS rd_ratio_pct,
    ROUND(inc.grossProfit / inc.revenue * 100, 1) AS gross_margin_pct,
    ROUND(inc.grossProfit / inc.researchAndDevelopmentExpenses, 2) AS rd_efficiency,
    ROUND(k.returnOnEquityTTM * 100, 1) AS roe_pct,
    ROUND(k.marketCap / 1e9, 2) AS mktcap_b
FROM inc
JOIN profile p ON inc.symbol = p.symbol
JOIN key_metrics_ttm k ON inc.symbol = k.symbol
WHERE inc.rn = 1
  AND inc.researchAndDevelopmentExpenses / inc.revenue > 0.02
  AND inc.researchAndDevelopmentExpenses / inc.revenue < 0.30
  AND inc.grossProfit / inc.revenue > 0.40
  AND k.returnOnEquityTTM > 0.10
  AND k.marketCap > 1000000000
  AND p.exchange = 'LSE'
ORDER BY rd_efficiency DESC
LIMIT 30
Run this query on Ceta Research
Limitations
Returns are in GBP. For USD-based investors, GBP/USD fluctuations affect realized returns. GBP has been broadly weaker since the Brexit vote. The currency headwind for dollar investors holding UK stocks since 2016 has been meaningful.
Benchmark is price-return only. The FTSE 100 (^FTSE) doesn't include dividends. The portfolio's adjClose prices include dividends. This means the +7.22% raw excess overstates true alpha by approximately the FTSE dividend yield (3-4% historically). Adjusting for this, the strategy's true excess vs total-return FTSE is closer to 3-4pp annually, which is still strong.
AstraZeneca concentration risk. AstraZeneca is one of the world's largest pharma companies and a dominant position in any UK quality screen. When the company underperforms (regulatory setbacks, patent cliffs, pipeline failures), the portfolio's results track closely with that single name.
Three Brexit years of underperformance. 2017-2019 underperformed vs FTSE price return (though 2019 showed protection vs a falling FTSE). The Brexit uncertainty caused UK institutional investors to underweight UK equities. This creates risk that political events override the signal for extended periods.
Cash periods are minimal (4%). One year had fewer than 10 qualifying stocks.
Takeaway
The UK R&D efficiency result is the standout across all 10 markets we tested. +7.22% annual excess vs FTSE 100 price return, -17.26% max drawdown, and 76% win rate over 25 years.
Even adjusting the benchmark comparison for dividends (true excess likely 3-4pp), the UK screen consistently protects in down markets while compounding meaningfully. The 2000-2002 crash, the 2007-2009 GFC, and the 2019 Brexit selloff all showed the same pattern: pharma-heavy, high-margin companies holding value while the broader UK market fell.
The three Brexit years (2017-2019) are the strategy's clearest vulnerability. Political events that reprice UK equities wholesale can override the signal for years. But the underlying businesses were fine, the recovery in 2020 (+44.25%) and 2022-2024 confirmed it.
Full backtest code: github.com/ceta-research/backtests
Data: Ceta Research (FMP financial data warehouse). Returns are in GBP. Benchmark: FTSE 100 price return (^FTSE), which excludes dividends, see limitation note above. Past performance does not guarantee future results.


