
Volume-Confirmed Momentum on Canada Stocks: 8.87% CAGR, 34.8% Down Capture
Volume-confirmed momentum on Canadian equities from 2001 to 2025: 8.87% CAGR vs 4.75% for the TSX Composite, +4.12% annual excess return, Sharpe 0.404, and 34.8% down capture. The commodity-driven TSX provides natural decorrelation.

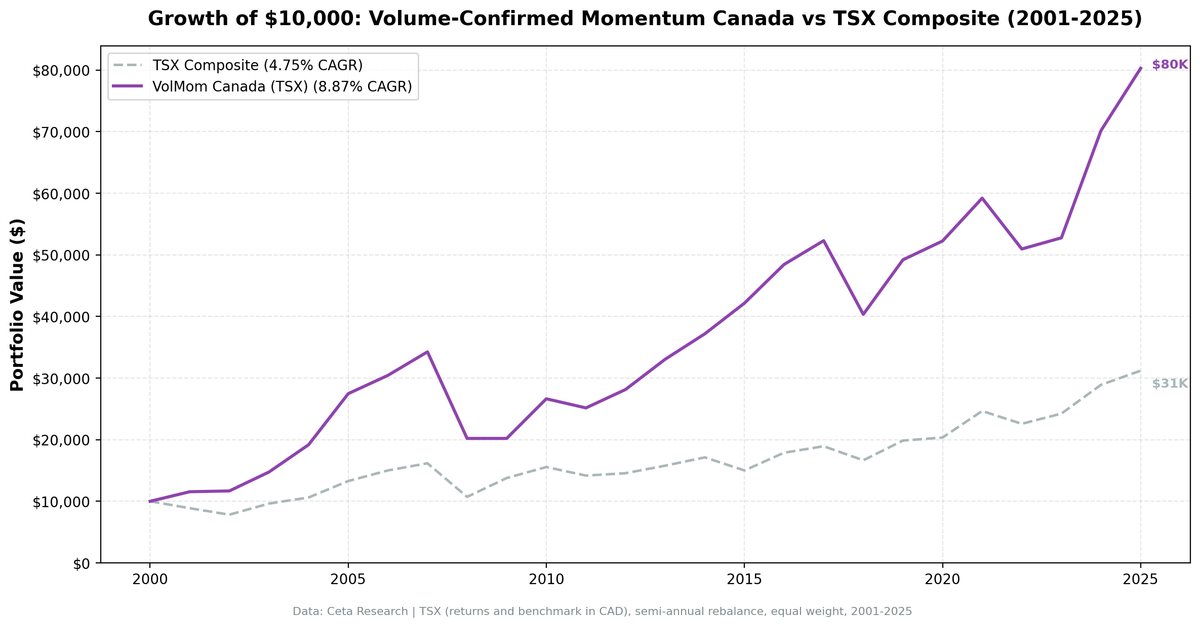
Canada produces one of the three best risk-adjusted results of the 17 markets we tested, and a down capture of 34.8% against the TSX Composite. When the TSX falls, this portfolio falls about a third as hard. Over 24.5 years, the strategy returned 8.87% annually against 4.75% for the TSX Composite, a +4.12% annual edge. The TSX Composite's relatively low long-term return makes the local comparison look better than the SPY comparison, but the factor genuinely adds value here.
Contents
Data: FMP financial data warehouse, 2000–2025. Rerun September 2026.
Method
| Parameter | Value |
|---|---|
| Universe | TSX (Canada) |
| Rebalancing | Semi-annual (January, July) |
| Signal | 12-month return, skip last month (T-1M to T-12M) |
| Volume filter | 3-month avg daily volume > 12-month avg (vol_ratio > 1.0) |
| Quality filter | netIncome > 0 AND operatingCashFlow > 0 (FY, 45-day lag) |
| Selection | Top 30 by momentum, equal weight |
| Min threshold | 10 qualifying stocks to deploy capital |
| Data source | FMP via Ceta Research warehouse |
| Benchmark | TSX Composite (^GSPTSE) |
| Period | 2001–2025 |
| Academic reference | Lee & Swaminathan (2000), Journal of Finance 55(5) |
That academic reference is usually cited in the wrong direction, so it is worth stating plainly. Lee & Swaminathan found that "high (low) volume winners (losers) experience faster reversals" and that "among winners, low volume stocks show greater persistence in price momentum." Their momentum life cycle classes a high-volume winner as late-stage momentum. This strategy buys high-volume winners, so the paper is not a case for it, and it is a US study of NYSE and AMEX stocks ranked on turnover rather than a finding about the TSX.
Canada's exchange is structurally different from the US. The TSX is heavily weighted toward energy, materials, and financials. During US equity crashes, these sectors often decorrelate. Energy and materials are commodity-driven, and commodity prices don't always fall with equities. That's the likely mechanism behind the exceptional down capture.
What We Found
This is a genuine alpha story and a risk management story. +4.12% annual excess return over 24.5 years against the TSX Composite is substantial. With 34.8% down capture and a Sharpe of 0.404, Canada delivers strong risk-adjusted returns. Only Sweden (0.487) and Switzerland (0.407) score higher on Sharpe across the 17 markets.
24.5-year summary (2001–2025):
| Metric | Volume-Confirmed Momentum | TSX Composite |
|---|---|---|
| CAGR | 8.87% | 4.75% |
| Total Return | 702.9% | 212.0% |
| Sharpe Ratio | 0.404 | n/a |
| Max Drawdown | -43.03% | -34.35% |
| Down Capture | 34.8% | 100% |
| Up Capture | 107.8% | 100% |
| Cash Periods | 2 of 49 (4%) | n/a |
| Avg Stocks Held (when invested) | 28.3 | n/a |
The 34.8% down capture vs the TSX Composite is the standout number. When the TSX falls, this portfolio falls about a third as hard. Combined with 107.8% up capture, the strategy takes more of the upside and far less of the downside. That asymmetry is what produces the 4.12% annual edge and the high Sharpe ratio.
Note that the TSX Composite had relatively modest returns (4.75% CAGR) over this period, which makes the comparison look favorable. A comparison vs SPY shows a much smaller 0.28% edge. But for a Canadian investor benchmarking against their home market, the 4.12% vs the TSX Composite is the relevant number.
Year-by-year standouts:
| Year | Portfolio | TSX Composite | Notes |
|---|---|---|---|
| 2001 | +15.5% | -11.2% | +26.7pp, commodity resilience vs crash |
| 2002 | +1.1% | -11.9% | +13.0pp, outperformed in down year |
| 2003 | +26.3% | +23.1% | Recovery plus commodity cycle |
| 2004 | +30.0% | +10.2% | +19.8pp, energy sector momentum |
| 2005 | +43.2% | +25.1% | +18.1pp, oil supercycle |
| 2006 | +10.8% | +13.0% | Slight miss |
| 2008 | -41.0% | -33.7% | -7.3pp in the worst year |
| 2009 | 0% (cash) | +28.5% | Cash, missed the recovery |
| 2010 | +31.8% | +12.9% | +18.9pp, commodity bounce |
| 2015 | +13.4% | -12.4% | +25.8pp, best relative year |
| 2018 | -22.9% | -12.0% | -10.8pp, worst relative year |
| 2022 | -13.9% | -8.4% | Underperformed in rate-hike year |
| 2024 | +33.0% | +19.3% | +13.7pp, energy and materials momentum |
| 2025 | +14.4% | +7.9% | +6.5pp, continued outperformance |
2001 and 2002 are the sharpest examples of the Canada thesis. During the US dot-com crash, the TSX Composite fell 11.2% in 2001 and 11.9% in 2002. The Canada portfolio returned +15.5% and +1.1%, outperforming the local index by 26.7pp and 13.0pp. The TSX's commodity-heavy composition meant the strategy held energy and materials stocks with genuine volume momentum, sectors that didn't participate in the tech bubble and didn't suffer its burst.
The oil supercycle years (2003-2007). Canada volume-confirmed momentum captured the commodity super-cycle almost perfectly. Energy and materials stocks with rising volume were exactly the stocks passing the screen. The 2005 result, +43.2% against the TSX Composite's +25.1%, is the clearest example: oil prices were rising, Canadian energy names were seeing institutional inflows, and the volume filter concentrated the portfolio there.
2018 was the worst relative year. The portfolio fell 22.9% against the TSX Composite's -12.0%. The US Federal Reserve's rate hiking cycle hit rate-sensitive sectors, and Canadian financials and REITs, often picked up by momentum screens, took the brunt. This is the exception rather than the rule for Canada, but it shows that the outperformance isn't unconditional.
2015 was the best relative year. The portfolio returned +13.4% against the TSX Composite's -12.4%, a 25.8pp gap. The Canadian oil price crash of 2015 hurt the broader TSX, but the momentum filter avoided energy companies that had already fallen. The volume screen concentrated the portfolio in sectors with rising institutional interest, which held up while the TSX's large commodity exposure dragged the index down.
What we can and can't attribute. The Canadian result is a sector story before it is a volume story. A momentum screen run on the TSX concentrates in energy and materials, and those sectors move with commodity cycles that are only loosely coupled to equity drawdowns. That is enough to explain a 34.8% down capture without invoking anything about who is trading. We did not measure institutional versus retail participation on the TSX, and we did not run a no-volume-filter control, so we cannot say how much of the +4.12% belongs to the volume filter rather than to the momentum ranking and the sector tilt underneath it.
Backtest Methodology
- Data: FMP financial data via Ceta Research warehouse. Price data from
stock_eod(adjusted closes). - Point-in-time: Quality filters use annual FY filings with 45-day reporting lag. No look-ahead bias.
- Signal: Price at T-12M to T-1M. Skip last month avoids short-term reversal contamination per Jegadeesh & Titman (1993).
- Volume ratio: 63-day avg daily volume divided by 252-day avg daily volume, computed at each rebalance date.
- Data quality: Stocks with an entry price under C$1 are excluded, and any single-period return above 200% is dropped as a price artifact. Phantom holiday rows and broken split adjustments are removed from the price series before any lookup.
- Equal weight: 30 positions, 3.33% each. No intraperiod rebalancing.
- Transaction costs: Modeled as size-tiered commissions. See methodology.
- Benchmark: TSX Composite (^GSPTSE), CAD-denominated. Strategy returns are also CAD-denominated. A secondary SPY comparison shows a +0.28% annual edge over the US index.
- Execution: Next-day close (market-on-close model). Entry prices use the trading day after the rebalance signal date.
Limitations
Currency risk. Strategy returns are in CAD. A USD-based investor faces CAD/USD exchange rate exposure. The CAD has fluctuated considerably vs the USD over this period, tracking oil prices. Currency effects can be meaningful in either direction.
Commodity concentration. The portfolio's low down capture likely depends on its energy and materials concentration. If the composition of Canadian momentum shifts away from commodities, as it might in a prolonged commodity bear market, the decorrelation benefit would shrink.
The SPY comparison is much thinner than the local one. Against the TSX Composite the edge is +4.12% a year. Against SPY it is +0.28%. A Canadian investor benchmarking at home sees a strong result; a US-dollar investor choosing between this and an S&P 500 tracker sees close to a tie, before any currency effect.
The two cash periods. The 4% cash rate (2 of 49 semi-annual periods) is low, but cash periods always represent missed upside. Those 2 periods weren't in consecutive years, so they didn't compound into a major drag.
TSX Composite had low returns. The TSX Composite's 4.75% CAGR over 2001-2025 is below the US S&P 500 (8.59%). This makes the strategy's 8.87% CAGR look better relative to the local benchmark. Vs SPY the excess is a far more modest 0.28%. The TSX Composite is also a price index, so it excludes dividends, while SPY is dividend-adjusted. Treat the local edge as overstated by roughly the Canadian dividend yield.
Takeaway
Canada volume-confirmed momentum delivers both alpha and risk reduction vs the local TSX Composite. The 4.12% annual excess return, Sharpe of 0.404, and 34.8% down capture describe a strategy that consistently outperforms the index while protecting capital during downturns.
The most likely mechanism is commodity exposure. Canadian momentum screens naturally concentrate in energy and materials, sectors that decorrelate from typical equity crashes. In Canada that concentration tends to land in sectors which hedge rather than amplify equity risk. How much the volume filter adds on top of the momentum ranking is untested here.
The 107.8% up capture means the strategy also participates in TSX bull markets. That asymmetry, capturing more of the upside and far less of the downside, is what produces the high Sharpe ratio and the 4.12% annual edge over the benchmark.
Part of a Series
This is part of a multi-exchange volume-confirmed momentum study:
- Volume-Confirmed Momentum: US Stocks
- Volume-Confirmed Momentum: UK Stocks
- Volume-Confirmed Momentum: India
- Volume-Confirmed Momentum: Canada
- Volume-Confirmed Momentum: Sweden
- Volume-Confirmed Momentum: 17-Exchange Comparison
References
- Lee, C. & Swaminathan, B. (2000). Price Momentum and Trading Volume. Journal of Finance, 55(5), 2017-2069.
- Jegadeesh, N. & Titman, S. (1993). Returns to Buying Winners and Selling Losers. Journal of Finance, 48(1), 65-91.
- Daniel, K. & Moskowitz, T. (2016). Momentum Crashes. Journal of Financial Economics.
Past performance does not guarantee future results. This is educational content, not investment advice.

