
KOSPI's 52-Week High Screen: 12.1% CAGR, 38% Down Capture
We tested the 52-week high proximity strategy on Korean stocks (KSC) from 2000 to 2025. 12.07% CAGR, +7.26% vs KOSPI, 37.9% down capture. 2024 returned +25.1% when KOSPI fell 10.2%.

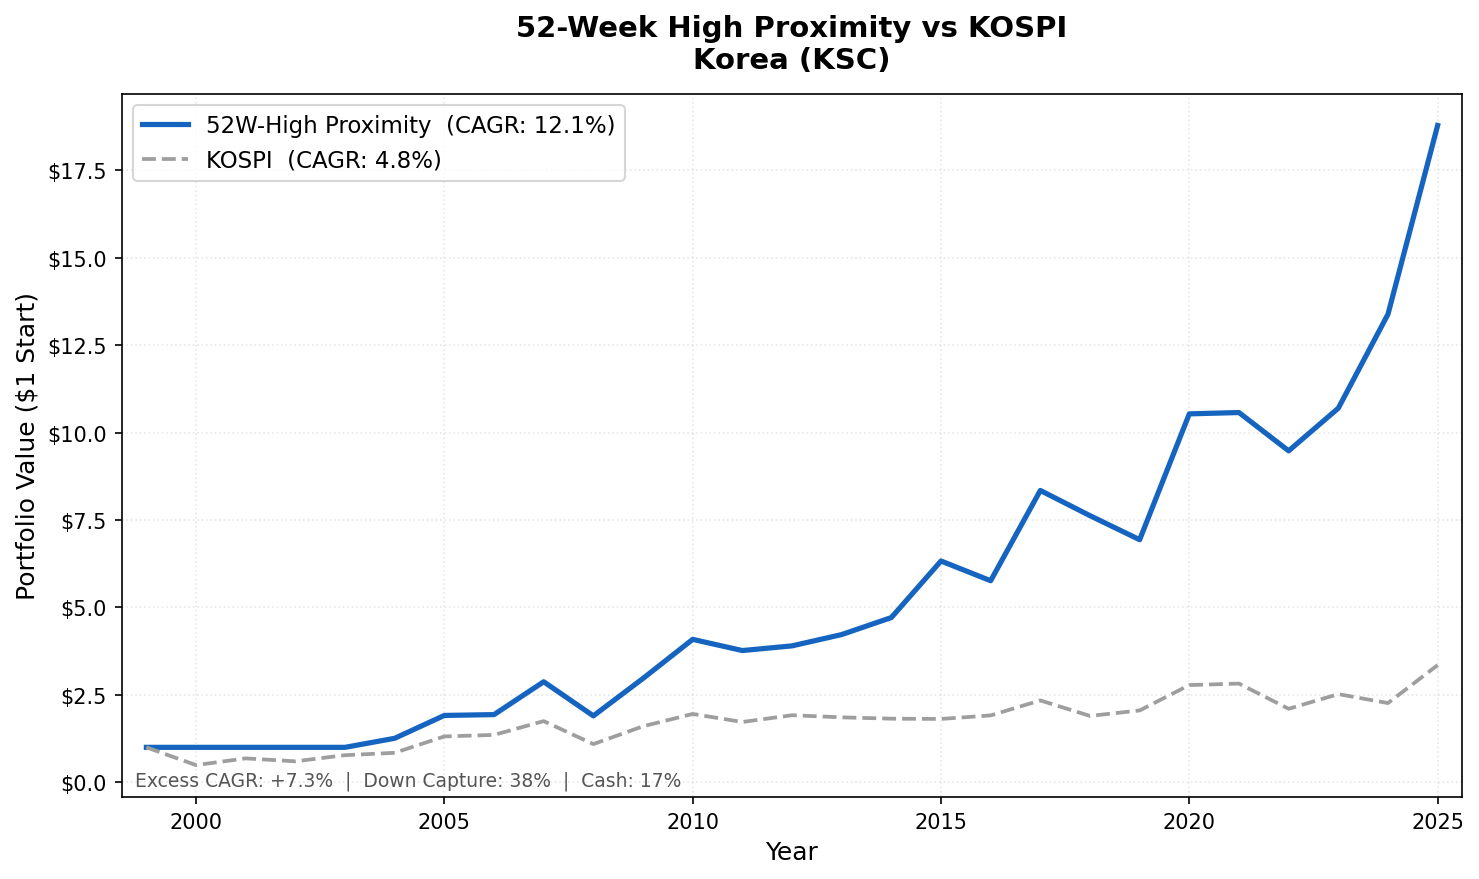
We ran the 52-week high proximity strategy on Korean stocks (KSC) from 2000 to 2025. The result: 12.07% annualized, +7.26% above the KOSPI, 37.9% down capture. A ₩1 investment grew to ₩18.79. The KOSPI grew to ₩3.35 over the same period. The strategy held cash for roughly a sixth of the 25 years, and those cash periods lined up well with Korea's worst market environments.
Contents
- Method
- What is the 52-Week High Proximity Strategy?
- What We Found
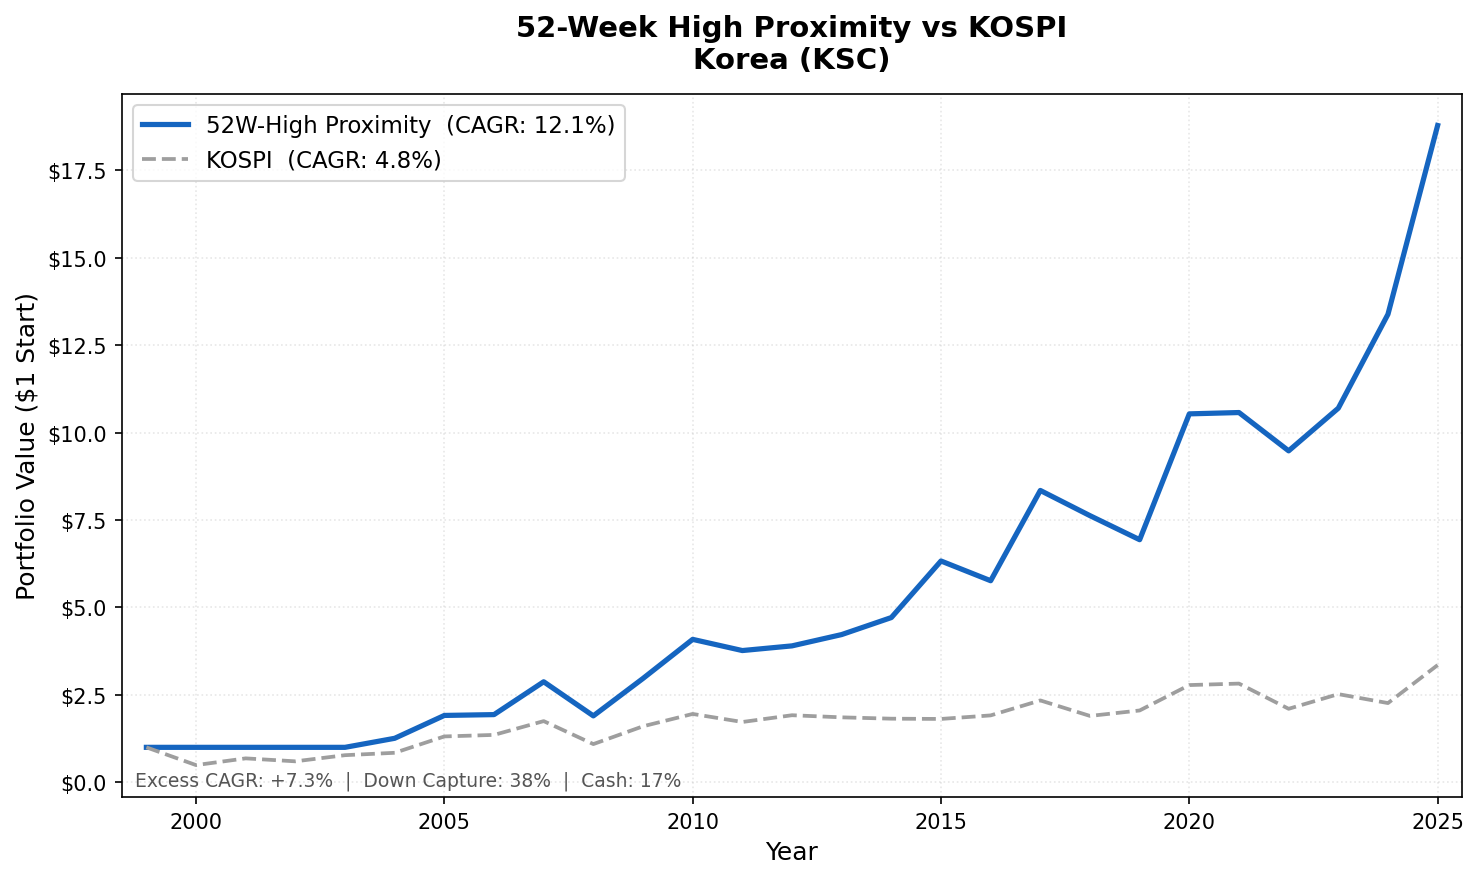
- 12.07% CAGR. +7.26% vs KOSPI. 37.9% down capture.
- Year-by-Year Returns
- 2000-2003: four years of cash
- 2004-2005: the signal fires
- 2008: better than KOSPI, faster recovery
- 2020: a standout upside year at +51.9%
- 2022, 2024, and 2025: the recent cycle
- Why Anchoring Works in Korea
- Limitations
- Run This Screen Yourself
- Part of a Series
- References
Korea's equity story is about downside discipline. The KOSPI is dominated by retail investors (over 60% of daily volume from individual accounts), which makes anchoring effects visible and persistent. The signal finds that. It pairs strong up years with unusually low down capture.
Data: FMP financial data warehouse, 2000-2025. Updated June 2026.
Method
Data source: Ceta Research (FMP financial data warehouse) Universe: KSC (Korea Stock Exchange), market cap > ₩500B Period: 2000–2025 (25 years, 103 quarterly periods) Rebalancing: Quarterly (January, April, July, October), equal weight Execution: Next-day close (MOC) Benchmark: KOSPI (KRW, local currency comparison) Returns: Calculated in KRW; benchmark in KRW Cash rule: Hold cash if fewer than 10 stocks qualify
The signal is the proximity ratio: current price divided by the 52-week high (rolling 252 trading days). Stocks are ranked by proximity ratio and the top 30 are held each quarter.
Note on benchmarking: Returns are in KRW, same currency as the portfolio. Comparing to the KOSPI enables an honest same-currency benchmark. Cross-currency comparison to SPY would include currency effects.
What is the 52-Week High Proximity Strategy?
George and Hwang (2004) showed that stocks trading near their 52-week high outperform stocks far from it. The mechanism is anchoring bias. Investors treat the 52-week high as a psychological ceiling. When a stock approaches it, selling pressure builds from investors who expect resistance. That pressure keeps the price below fundamental value temporarily. When news or earnings push the stock past the anchor, the discount corrects sharply.
Proximity ratio = adjClose / MAX(high over 252 trading days)
A ratio of 1.0 means the stock is at its 52-week high. We select the top 30 stocks by this ratio, closest to their annual peak, and hold them equal weight for one quarter.
What We Found
12.07% CAGR. +7.26% vs KOSPI. 37.9% down capture.
| Metric | 52-Week High Korea | KOSPI |
|---|---|---|
| CAGR | 12.07% | 4.81% |
| Excess Return | +7.26% | - |
| Total Return | ₩18.79 per ₩1 | ₩3.35 per ₩1 |
| Max Drawdown | -35.78% | -52.73% |
| Sharpe Ratio | 0.469 | 0.077 |
| Up Capture | 86.33% | - |
| Down Capture | 37.94% | - |
| Cash Periods | 17.5% of quarters | - |
| Avg Stocks (invested) | 28.3 | - |
| Win Rate | 62.1% | - |
The 37.9% down capture is the standout. When the KOSPI fell, this portfolio absorbed only 38% of the decline. Combined with a max drawdown of -35.78% (versus KOSPI's -52.73%), the strategy shows genuine downside management over a 25-year period that included two global crashes and multiple Korea-specific corrections.
The up capture of 86.33% means the strategy captures slightly less of up markets than down. This is the natural consequence of a signal that exits to cash when fewer stocks are near their highs. Bear markets reduce the qualifying universe, but so do slow sideways markets where nothing is near an annual peak.
The win rate of 62.1% means the strategy beat the KOSPI in nearly two-thirds of quarters. The edge comes from both sides: it wins more often and the asymmetry is favorable, with larger wins than losses when they happen.
Year-by-Year Returns
| Year | Korea Strategy | KOSPI | Excess |
|---|---|---|---|
| 2000 | 0.0% (cash) | -50.8% | n/a |
| 2001 | 0.0% (cash) | +39.2% | n/a |
| 2002 | 0.0% (cash) | -12.4% | n/a |
| 2003 | 0.0% (cash) | +29.3% | n/a |
| 2004 | +25.9% | +8.8% | +17.0% |
| 2005 | +51.9% | +55.5% | -3.5% |
| 2006 | +1.2% | +3.3% | -2.1% |
| 2007 | +48.6% | +29.1% | +19.4% |
| 2008 | -33.9% | -37.6% | +3.6% |
| 2009 | +56.3% | +46.6% | +9.8% |
| 2010 | +37.6% | +22.1% | +15.6% |
| 2011 | -7.8% | -11.8% | +3.9% |
| 2012 | +3.6% | +11.2% | -7.7% |
| 2013 | +8.3% | -3.2% | +11.4% |
| 2014 | +11.5% | -2.1% | +13.6% |
| 2015 | +34.3% | -0.4% | +34.7% |
| 2016 | -8.9% | +5.6% | -14.5% |
| 2017 | +44.8% | +22.4% | +22.4% |
| 2018 | -8.6% | -18.9% | +10.3% |
| 2019 | -9.0% | +8.2% | -17.2% |
| 2020 | +51.9% | +35.4% | +16.5% |
| 2021 | +0.4% | +1.5% | -1.1% |
| 2022 | -10.4% | -25.5% | +15.2% |
| 2023 | +12.9% | +20.0% | -7.1% |
| 2024 | +25.1% | -10.2% | +35.3% |
| 2025 | +40.3% | +48.0% | -7.6% |
2000-2003: four years of cash
The KOSPI didn't have enough stocks near their 52-week highs during these years for the signal to fire. Korea was recovering from the 1997-1998 Asian financial crisis. Corporate restructuring was ongoing. The market had low conviction periods where most stocks were well below annual peaks.
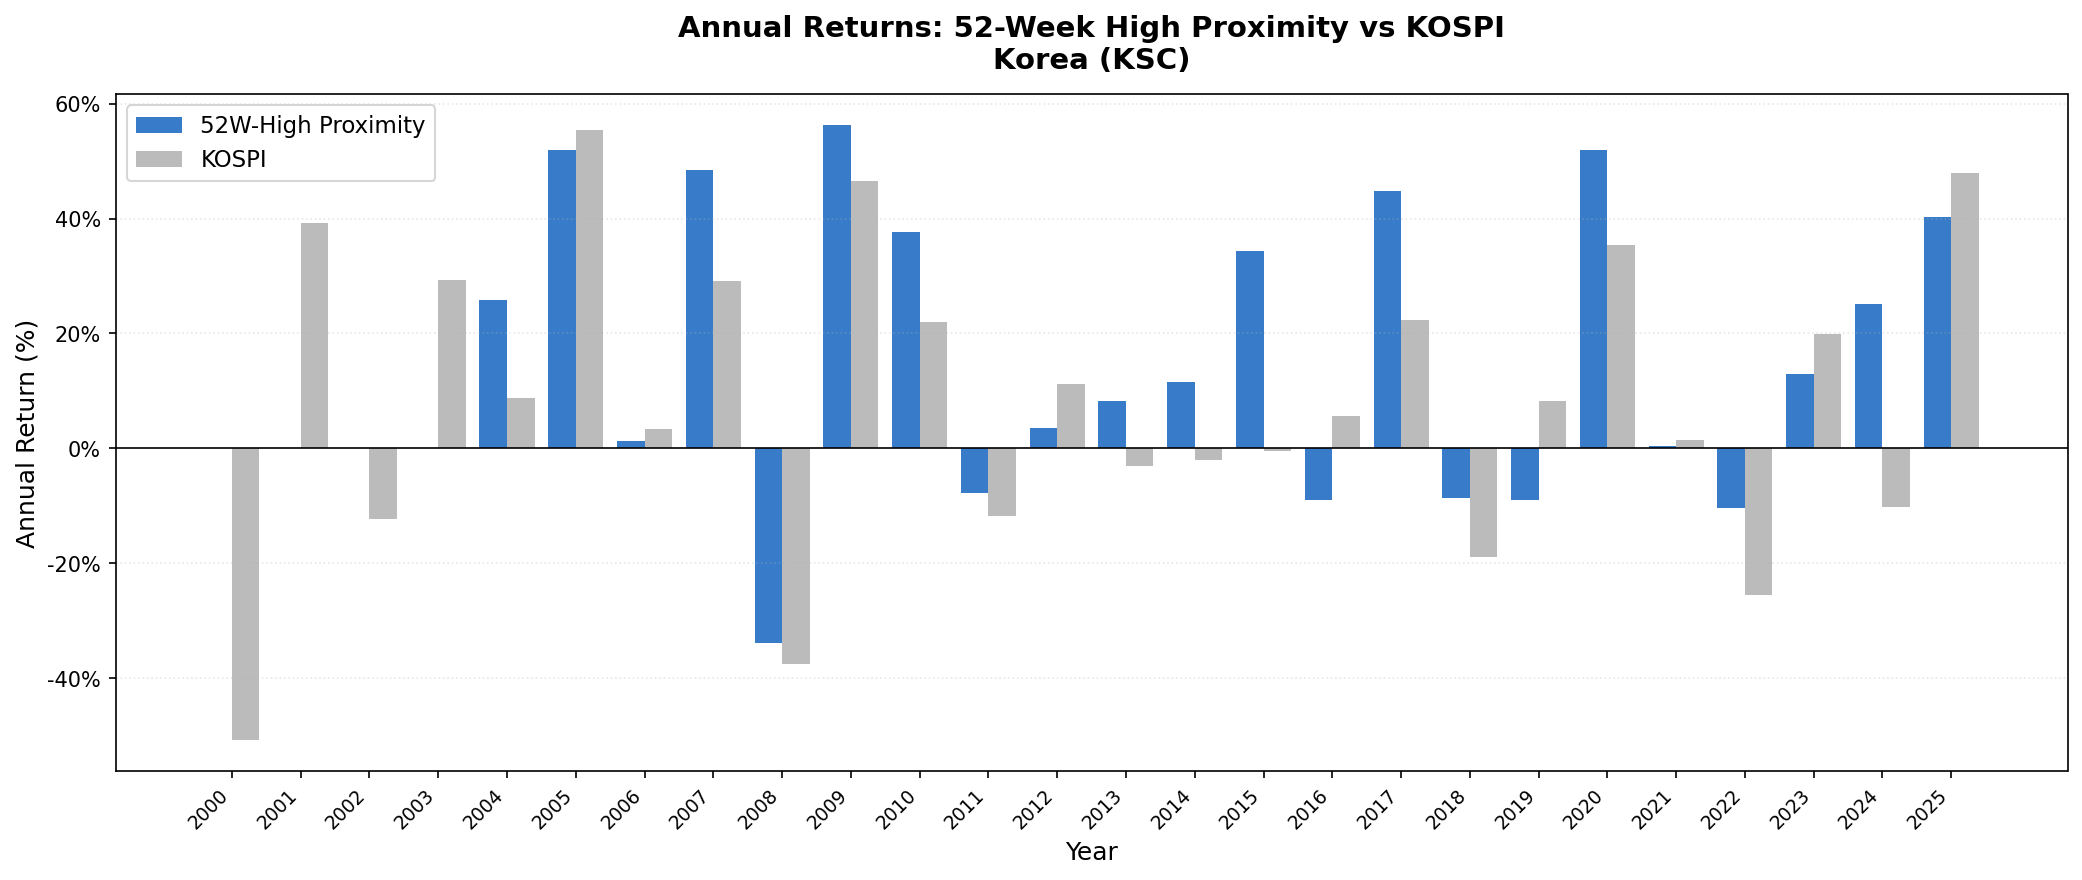
Four years of cash meant missing the KOSPI's 2001 rebound (+39.2%) and 2003 recovery (+29.3%). But it also meant sitting out the 2000 collapse (-50.8%) and the 2002 decline (-12.4%). On balance, the cash periods from 2000-2003 preserved the portfolio for a clean 2004 entry.
2004-2005: the signal fires
When the signal fired in 2004, it found exactly what it was designed to capture. +25.9% as the KOSPI rose 8.8% (+17.0% excess), then +51.9% in 2005 against the KOSPI's +55.5%. Korea's mid-cap industrial and technology companies were approaching annual highs on improving fundamentals. The proximity screen positioned in them as the broader market surged.
2008: better than KOSPI, faster recovery
2008 was -33.9% for the strategy, versus -37.6% for the KOSPI. The KOSPI fell hard in the global crisis. Korea's export-heavy economy is cyclically sensitive. The strategy lost less than the index in the crash year, then recovered strongly.
2009 returned +56.3% against the KOSPI's +46.6% (+9.8% excess). The recovery was faster than the drawdown, and by 2010 (+37.6% vs KOSPI +22.1%, +15.6% excess) the portfolio had rebuilt substantially.
2020: a standout upside year at +51.9%
2020 was one of the strongest single-year results. COVID crashed markets in March, but Korea's equity market recovered with unusual speed. The KOSPI was driven partly by retail investor participation (Korean retail investors became very active during the COVID period) and partly by Korea's early economic recovery relative to Western markets.
The proximity signal captured the strongest-recovering stocks within that environment. +51.9% against the KOSPI's +35.4% (+16.5% excess).
2022, 2024, and 2025: the recent cycle
2022 shows the signal working as designed during a genuine bear market. The KOSPI fell 25.5%, and the Korea strategy fell only 10.4%, absorbing well under half the decline (+15.2% excess). Korea's domestic-oriented sectors held up better than cyclicals in that environment.
2024 is a massive standout: +25.1% when the KOSPI fell 10.2%. A 35.3 percentage point outperformance. Korean semiconductor and technology stocks in 2024 showed strong relative strength while the broader index struggled, and the proximity signal was positioned there.
2025 followed with +40.3% against the KOSPI's +48.0%. The strategy slightly lagged as the broader market surged, but captured most of the upside.
Why Anchoring Works in Korea
Korea's equity market has one of the highest retail participation rates globally. Individual investors account for over 60% of daily KOSPI volume. Retail investors are particularly susceptible to anchoring. They watch 52-week highs and all-time highs as reference points for "expensive" and "cheap."
This creates predictable behavior around annual highs. Retail selling pressure builds as stocks approach the 52-week high level. The proximity signal positions the portfolio precisely in those stocks. When the anchor breaks to the upside, the retail sellers are proven wrong, and the repricing is sharp.
The 17.5% cash periods (roughly one in six quarters) reflect an important feature of the signal. When Korean markets are trending lower, fewer stocks are near their highs. The screen naturally reduces exposure. This isn't a deliberate market-timing mechanism. It's the signal being selective about what qualifies. The effect is a portfolio that's inherently less invested in bad environments.
Limitations
Currency risk. Returns are in KRW. KRW/USD fluctuations matter for international investors, though domestic investors wouldn't face this issue.
Cash periods miss up markets. The four cash years from 2000-2003 missed the KOSPI's 2001 (+39.2%) and 2003 (+29.3%) recoveries. In periods where the broader market rallies but individual stocks aren't near highs, the strategy sits out. This is protection in bad environments but a drag in uneven recoveries.
Max drawdown of 35.78%. Still a large single-event loss, concentrated in the 2008 crisis. The downside protection is relative (much better than KOSPI's 52.73%), not absolute.
Liquidity. Mid-cap Korean stocks have thinner order books outside the top-tier names. Real execution costs for larger positions could exceed the modeled transaction costs.
Survivorship bias. Companies that delisted or failed during the 25-year period aren't fully tracked. Drawdowns are likely understated somewhat.
Run This Screen Yourself
Current 52-week high proximity screen (Korean stocks):
WITH price_window AS (
    SELECT
        symbol,
        TRY_CAST(date AS DATE) AS trade_date,
        adjClose,
        high,
        dateEpoch,
        MAX(high) OVER (
            PARTITION BY symbol ORDER BY dateEpoch
            ROWS BETWEEN 251 PRECEDING AND CURRENT ROW
        ) AS high_52w,
        COUNT(*) OVER (
            PARTITION BY symbol ORDER BY dateEpoch
            ROWS BETWEEN 251 PRECEDING AND CURRENT ROW
        ) AS row_count
    FROM stock_eod
    WHERE TRY_CAST(date AS DATE) >= CURRENT_DATE - INTERVAL '14' MONTH
      AND adjClose > 0 AND high > 0
),
latest AS (
    SELECT symbol, adjClose, high_52w
    FROM price_window
    WHERE trade_date >= CURRENT_DATE - INTERVAL '10' DAY
      AND high_52w > 0 AND row_count >= 100
    QUALIFY ROW_NUMBER() OVER (PARTITION BY symbol ORDER BY dateEpoch DESC) = 1
)
SELECT
    l.symbol,
    p.companyName,
    p.sector,
    ROUND(l.adjClose / l.high_52w, 4) AS proximity_ratio,
    ROUND(p.marketCap / 1e9, 2) AS mktcap_bn_krw
FROM latest l
JOIN profile p ON l.symbol = p.symbol
WHERE p.exchange = 'KSC'
  AND p.marketCap > 500000000000
ORDER BY proximity_ratio DESC
LIMIT 30
Run this screen on Ceta Research
The full backtest code (Python + DuckDB) is on GitHub.
Part of a Series
This post is part of our 52-week high proximity global exchange comparison:
- India (NSE): 19.0% CAGR, +7.8% vs Sensex
- Thailand (SET): Anchoring Works in Emerging Markets Too
- Japan (JPX): Steady Alpha in a Flat Market
- Global Comparison: 52-Week High Proximity Across Exchanges
References
- George, T. & Hwang, C. (2004). "The 52-Week High and Momentum Investing." Journal of Finance, 59(5), 2145–2176.
- Jegadeesh, N. & Titman, S. (1993). "Returns to Buying Winners and Selling Losers: Implications for Stock Market Efficiency." Journal of Finance, 48(1), 65–91.
- Kaniel, R., Saar, G. & Titman, S. (2008). "Individual Investor Trading and Stock Returns." Journal of Finance, 63(1), 273–310. (Retail investor behavior and market impact)
Data: Ceta Research (FMP financial data warehouse). Universe: KSC, market cap > ₩500B. Quarterly rebalance, equal weight, next-day close execution, transaction costs included, 2000–2025. Returns in KRW, benchmark KOSPI.
Past performance does not guarantee future results. This is educational content, not investment advice.

