
NSE 52-Week High Proximity: 19.0% CAGR, +7.8% vs Sensex Over 25 Years
We tested the 52-week high proximity strategy on NSE stocks from 2000 to 2025 with next-day execution. 18.96% CAGR vs 11.12% Sensex, +7.84% excess return. ₹1 grew to ₹87.35 vs ₹15.11 for Sensex. The anchoring effect persists in India's retail-dominated market.


We ran the 52-week high proximity strategy on NSE stocks from 2000 to 2025 using next-day close execution. The result: 18.96% annualized vs 11.12% for the Sensex, +7.84% excess return. A ₹1 investment grew to ₹87.35. The Sensex returned ₹15.11 over the same period.
Contents
- Method
- What is the 52-Week High Proximity Strategy?
- What We Found
- 18.96% CAGR. +7.84% vs Sensex. ₹87.35 from ₹1.
- Year-by-Year Returns
- 2000–2003: cash during the Sensex recovery
- 2004-2007: the Sensex bull market, captured from 2004 onward
- 2008: the worst single year at -57.8%
- 2009 recovery: +62.4% vs Sensex +76.3%
- 2021-2024: consistent outperformance, +40% excess years
- Why India Specifically
- Limitations
- Run This Screen Yourself
- Part of a Series
- References
India outperforms the local benchmark consistently. The +7.84% excess return places the NSE above most developed markets when compared to their own indices. Understanding why requires looking at both the signal mechanics and the market structure that makes anchoring bias visible in India.
Data: FMP financial data warehouse, 2000-2025. Updated June 2026.
Method
Data source: Ceta Research (FMP financial data warehouse) Universe: NSE (National Stock Exchange of India), market cap > ₹20B Period: 2000–2025 (25 years, 103 quarterly periods) Execution: Next-day close (MOC, market-on-close) Rebalancing: Quarterly (January, April, July, October), equal weight Benchmark: Sensex (S&P BSE SENSEX, INR, local currency comparison) Returns: Calculated in INR; benchmark also in INR Cash rule: Hold cash if fewer than 10 stocks qualify
The signal is the proximity ratio: current price divided by the 52-week high (rolling 252 trading days). Stocks are ranked by proximity ratio and the top 30 are held each quarter. Financial data uses a 45-day lag on annual filings.
Benchmark note: The Sensex is the BSE SENSEX index, the 30-stock large-cap benchmark for Indian equities. Returns are in INR, same currency as the portfolio, enabling an honest same-currency comparison. The global comparison (vs SPY) would show different absolute numbers due to INR/USD exchange rate effects over 25 years.
What is the 52-Week High Proximity Strategy?
George and Hwang (2004) documented that stocks trading near their 52-week high outperform stocks far from it. Their paper, published in the Journal of Finance, showed the signal predicted 12-month forward returns across US stocks.
The mechanism is anchoring bias. Investors mentally treat the 52-week high as a ceiling. When a stock approaches that level, some investors sell preemptively, worried the price won't break through. This creates selling pressure that temporarily depresses the price below its fundamental value. When earnings or news push the stock past the anchor, the undervaluation corrects quickly.
The strategic implication: stocks near their 52-week high are not expensive. They're finishing their undervaluation period. The signal captures this before the correction closes.
Proximity ratio = adjClose / MAX(high over 252 trading days)
A ratio of 1.0 means the stock is exactly at its 52-week high. A ratio of 0.95 means it's 5% below. We select the top 30 stocks by this ratio: the ones closest to their annual peak.
What We Found
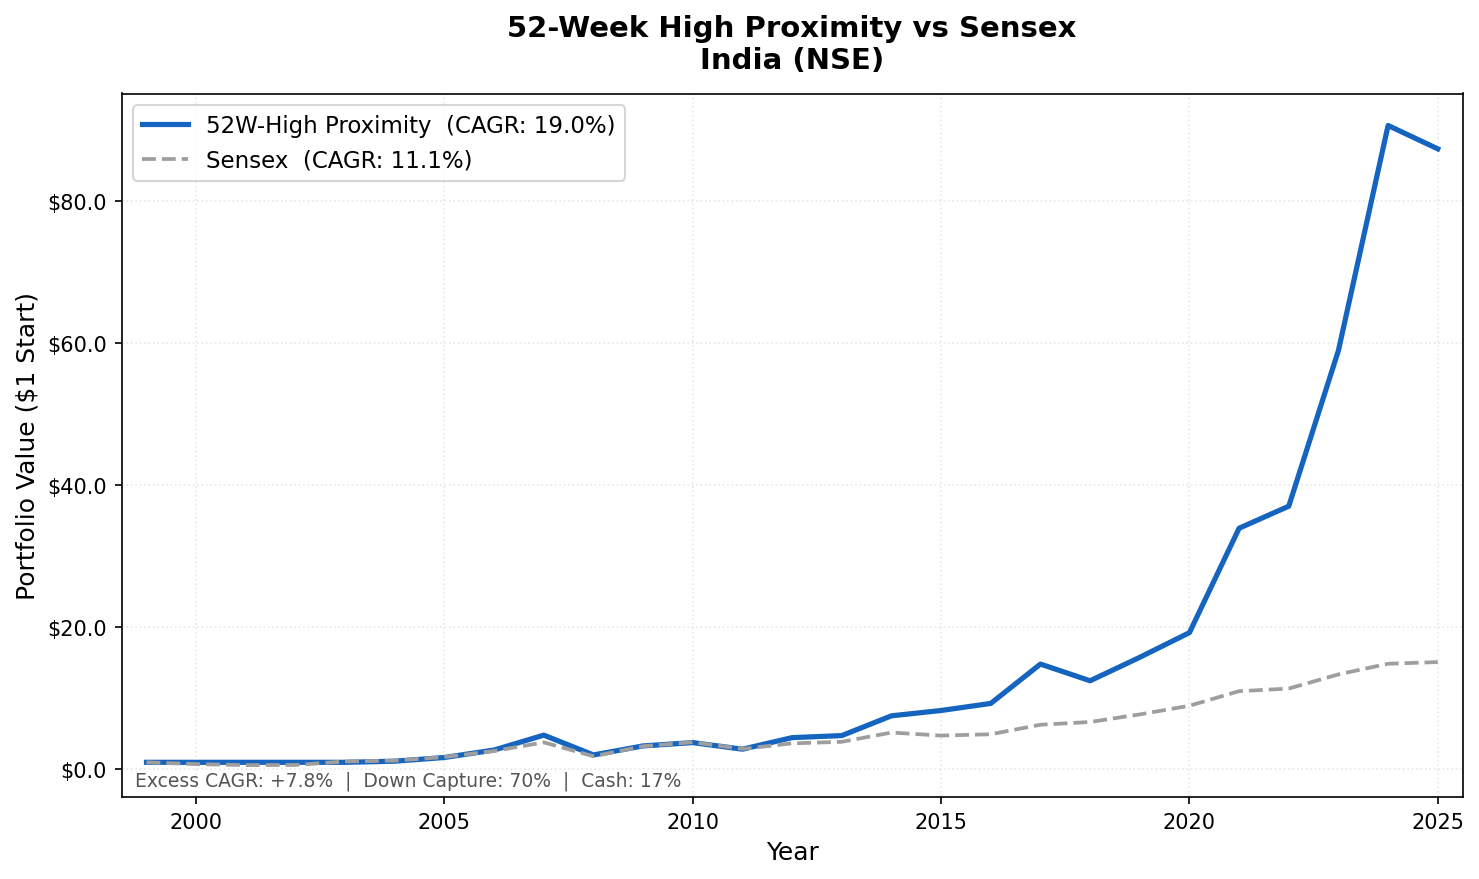
18.96% CAGR. +7.84% vs Sensex. ₹87.35 from ₹1.
| Metric | 52-Week High NSE | Sensex |
|---|---|---|
| CAGR | 18.96% | 11.12% |
| Excess Return | +7.84% | - |
| Total Return | ₹87.35 per ₹1 | ₹15.11 per ₹1 |
| Max Drawdown | -58.6% | -51.3% |
| Sharpe Ratio | 0.491 | 0.194 |
| Sortino Ratio | 0.87 | - |
| Calmar Ratio | 0.324 | - |
| Up Capture | 115.3% | - |
| Down Capture | 69.8% | - |
| Cash Periods | 16.5% of quarters | - |
| Avg Stocks (invested) | 29.5 | - |
| Win Rate | 66.0% | - |
The +7.84% excess return vs the Sensex over 25 years is meaningful alpha for a pure price signal. The Sensex itself returned 11.12% annually in INR terms. The proximity strategy beat it consistently by holding the subset of NSE stocks that were leading the index at each rebalance point.
The Sharpe of 0.491 vs Sensex's 0.194 shows the strategy generates more return per unit of risk than the benchmark. The win rate of 66.0%, outperforming in two-thirds of quarters, confirms the consistency of the edge.
Year-by-Year Returns
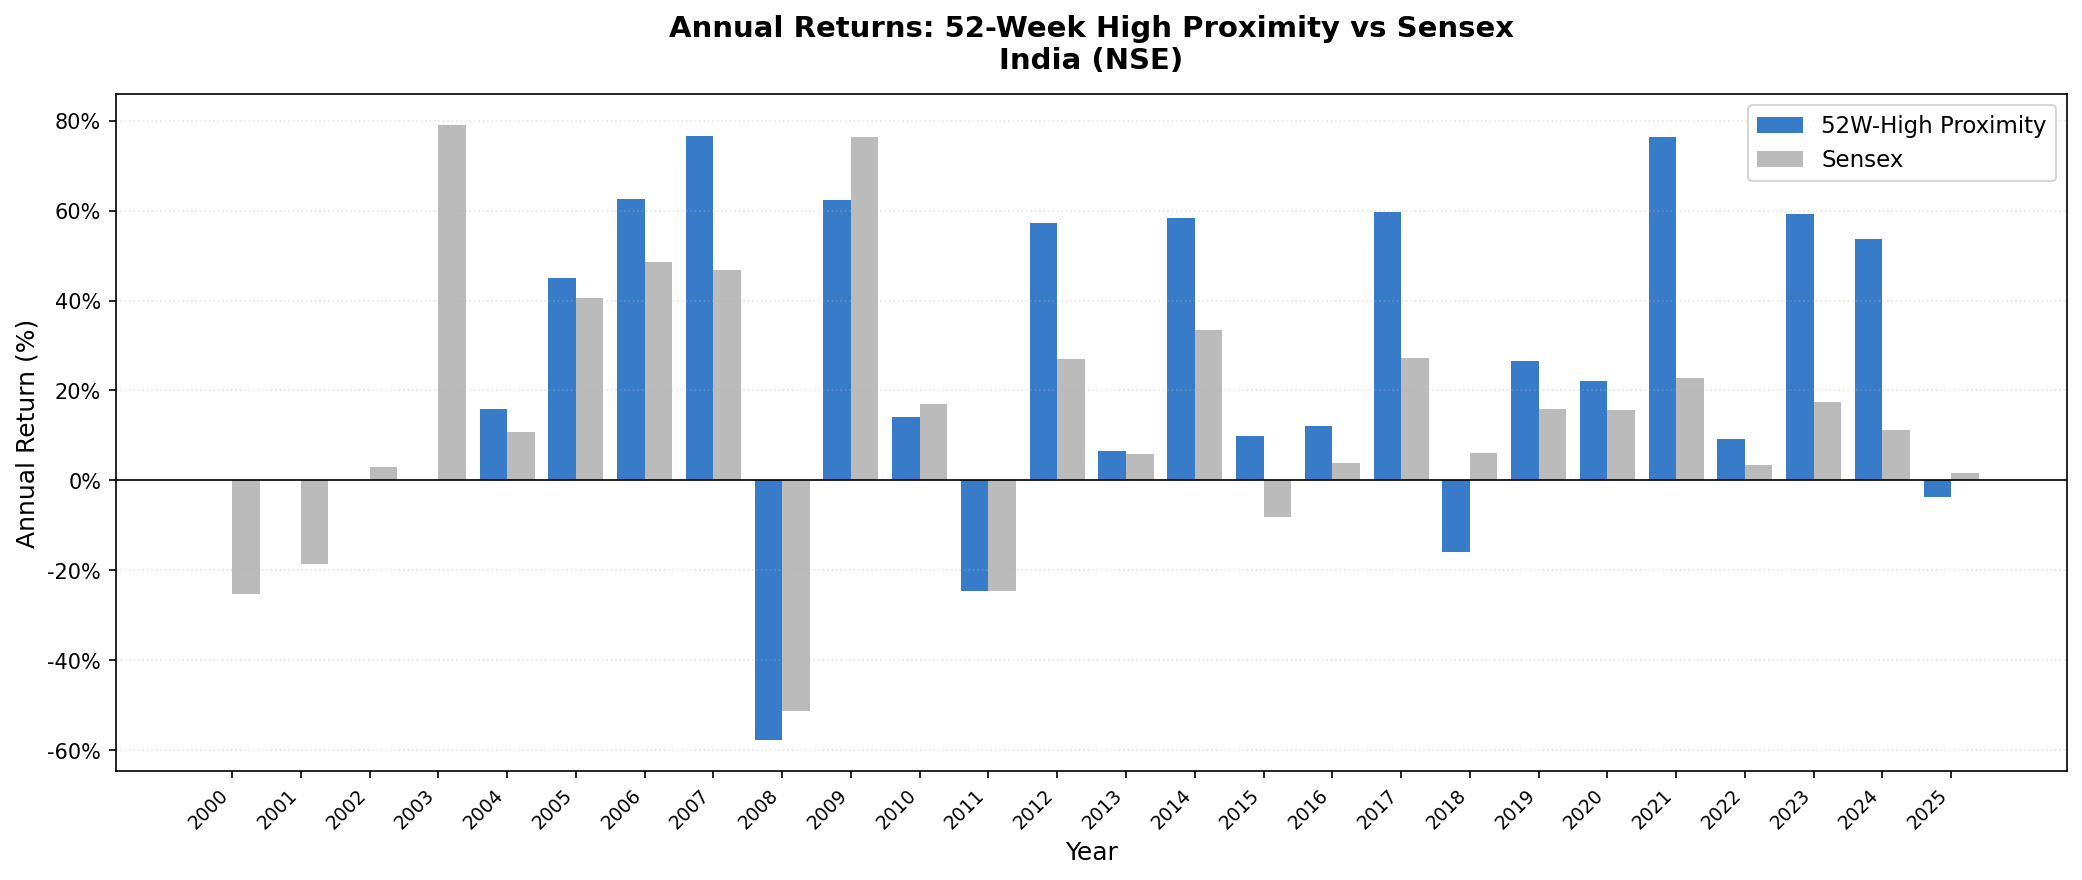
| Year | NSE Strategy | Sensex | Excess |
|---|---|---|---|
| 2000 | 0.0% (cash) | -25.2% | n/a |
| 2001 | 0.0% (cash) | -18.7% | n/a |
| 2002 | 0.0% (cash) | +2.9% | n/a |
| 2003 | 0.0% (cash) | +79.1% | n/a |
| 2004 | +15.8% | +10.8% | +5.0% |
| 2005 | +45.1% | +40.6% | +4.5% |
| 2006 | +62.6% | +48.5% | +14.2% |
| 2007 | +76.6% | +46.8% | +29.8% |
| 2008 | -57.8% | -51.3% | -6.4% |
| 2009 | +62.4% | +76.3% | -14.0% |
| 2010 | +14.0% | +17.1% | -3.1% |
| 2011 | -24.6% | -24.5% | -0.0% |
| 2012 | +57.1% | +27.0% | +30.1% |
| 2013 | +6.5% | +6.0% | +0.5% |
| 2014 | +58.4% | +33.5% | +24.9% |
| 2015 | +9.9% | -8.1% | +18.1% |
| 2016 | +12.0% | +3.8% | +8.2% |
| 2017 | +59.6% | +27.1% | +32.5% |
| 2018 | -15.9% | +6.2% | -22.0% |
| 2019 | +26.5% | +16.0% | +10.5% |
| 2020 | +22.0% | +15.7% | +6.3% |
| 2021 | +76.3% | +22.9% | +53.5% |
| 2022 | +9.1% | +3.4% | +5.8% |
| 2023 | +59.1% | +17.5% | +41.6% |
| 2024 | +53.7% | +11.2% | +42.5% |
| 2025 | -3.6% | +1.6% | -5.2% |
2000–2003: cash during the Sensex recovery
The NSE signal found insufficient qualifying stocks from 2000 through 2003. The NSE universe, with BSE excluded, was thinner than the combined exchange set. Stocks weren't near their 52-week highs during this recovery period from the dot-com crash. The screen held cash.
The Sensex fell 25.2% in 2000 and 18.7% in 2001 as India absorbed the global selloff. The NSE strategy sat out at 0.0%. That's downside protection through selectivity. But 2003 was the cost: the Sensex rebounded +79.1% as India's IT services sector and domestic economy recovered. The NSE proximity screen held cash, missing the entire year. This is the honest limitation: when recovery happens from deeply depressed levels, stocks are far from their 52-week highs, and the signal doesn't fire.
2004-2007: the Sensex bull market, captured from 2004 onward
The Sensex ran from roughly 5,600 in 2004 to over 21,000 by January 2008. The NSE 52-week high strategy entered in 2004 and captured the remainder: +15.8%, +45.1%, +62.6%, +76.6% across four consecutive years.
The 2007 gain of +76.6% vs Sensex +46.8% (+29.8% excess) is the standout year. India's momentum-driven retail market amplified the signal. When stocks broke to new annual highs, the buying pressure continued. The strategy was already positioned before the crowd arrived.
2008: the worst single year at -57.8%
The 2008 global financial crisis hit India hard. The Sensex fell from 21,000 to under 8,000 (-51.3%). The NSE proximity strategy fell 57.8%, worse than the benchmark by 6.4 percentage points. Concentrated emerging market stocks in a full-risk-on portfolio sell off faster in a global deleveraging event. Next-day execution meant buying at deteriorating prices through the worst quarters.
This is the strategy's honest weakness. When all correlations go to 1, the proximity filter can't protect you. Down capture of 69.8% averaged across all periods includes meaningful protection in ordinary corrections, but 2008 showed the limit.
2009 recovery: +62.4% vs Sensex +76.3%
The rebound was strong but trailed the Sensex. +62.4% vs Sensex +76.3% (-14.0% excess). This is the classic proximity signal weakness: deep-value crash recoveries are driven by stocks far from their 52-week highs. The proximity screen misses those and holds steadier names that didn't fall as hard and don't rebound as sharply.
2021-2024: consistent outperformance, +40% excess years
2021: +76.3% vs Sensex +22.9% (+53.5% excess). 2023: +59.1% vs Sensex +17.5% (+41.6% excess). 2024: +53.7% vs Sensex +11.2% (+42.5% excess).
Three of the four most recent full years show the signal working as designed. NSE stocks near their 52-week highs were leading the Sensex gains, and the strategy captured them ahead of the index's broader recognition.
Why India Specifically
The anchoring bias mechanism exists in every market. But the effect is strongest where retail investor participation is highest and where institutional arbitrage is slowest.
India checks both boxes. The NSE has unusually high retail participation. Individual investors account for a large share of daily volume, particularly in the mid-cap segment where this strategy operates. Retail investors anchor strongly to round numbers, 52-week highs, and all-time highs. They hesitate to buy through those levels.
Institutional investors in India, while growing, have historically been less concentrated in the mid-cap space where the signal fires best. Foreign institutional investors move in and out at the large-cap level. The mid-cap NSE universe the proximity screen targets is relatively less arbitraged.
The result: the proximity signal finds NSE stocks approaching their 52-week highs before the broader index reflects that strength. The +7.84% excess return vs Sensex over 25 years reflects that persistent edge.
Limitations
Max drawdown of 58.6%. The strategy is not a low-volatility approach. 2008 required holding through a -57.8% year, worse than the Sensex's -51.3%. Investors who couldn't stay the course would have locked in losses at the worst moment. Next-day execution amplified drawdowns in fast-moving crashes.
Cash periods 2000-2003. The NSE-only universe was too thin to generate 10 qualifying stocks in the early 2000s. The strategy held cash through the entire 2003 Sensex rally (+79.1%), missing one of India's best years. This is the structural cost of a selective signal: you miss recoveries that happen from deeply depressed levels.
Emerging market liquidity. India's mid-cap segment has thinner order books than US large-caps. Transaction costs are included (size-tiered) but may understate actual execution slippage for large positions in less liquid NSE names.
Survivorship bias. Profiles use current exchange listings. NSE companies that delisted or failed aren't fully tracked through failure. This likely understates historical drawdowns.
Run This Screen Yourself
Current 52-week high proximity screen (Indian stocks):
WITH price_window AS (
    SELECT
        symbol,
        TRY_CAST(date AS DATE) AS trade_date,
        adjClose,
        high,
        dateEpoch,
        MAX(high) OVER (
            PARTITION BY symbol ORDER BY dateEpoch
            ROWS BETWEEN 251 PRECEDING AND CURRENT ROW
        ) AS high_52w,
        COUNT(*) OVER (
            PARTITION BY symbol ORDER BY dateEpoch
            ROWS BETWEEN 251 PRECEDING AND CURRENT ROW
        ) AS row_count
    FROM stock_eod
    WHERE TRY_CAST(date AS DATE) >= CURRENT_DATE - INTERVAL '14' MONTH
      AND adjClose > 0 AND high > 0
),
latest AS (
    SELECT symbol, adjClose, high_52w
    FROM price_window
    WHERE trade_date >= CURRENT_DATE - INTERVAL '10' DAY
      AND high_52w > 0 AND row_count >= 100
    QUALIFY ROW_NUMBER() OVER (PARTITION BY symbol ORDER BY dateEpoch DESC) = 1
)
SELECT
    l.symbol,
    p.companyName,
    p.sector,
    ROUND(l.adjClose / l.high_52w, 4) AS proximity_ratio,
    ROUND(p.marketCap / 1e9, 2) AS mktcap_bn_inr
FROM latest l
JOIN profile p ON l.symbol = p.symbol
WHERE p.exchange = 'NSE'
  AND p.marketCap > 20000000000
ORDER BY proximity_ratio DESC
LIMIT 30
Run this screen on Ceta Research
The full backtest code (Python + DuckDB) is on GitHub.
Part of a Series
This post is part of our 52-week high proximity global exchange comparison:
- Korea (KSC): 12.1% CAGR, 38% Down Capture
- Thailand (SET): Anchoring Works in Emerging Markets Too
- Japan (JPX): Steady Alpha in a Flat Market
- Global Comparison: 52-Week High Proximity Across Exchanges
References
- George, T. & Hwang, C. (2004). "The 52-Week High and Momentum Investing." Journal of Finance, 59(5), 2145–2176.
- Jegadeesh, N. & Titman, S. (1993). "Returns to Buying Winners and Selling Losers: Implications for Stock Market Efficiency." Journal of Finance, 48(1), 65–91.
- Rouwenhorst, K. (1998). "International Momentum Strategies." Journal of Finance, 53(1), 267–284.
Data: Ceta Research (FMP financial data warehouse). Universe: NSE, market cap > ₹20B. Quarterly rebalance, equal weight, transaction costs included, next-day close execution, 2000–2025. Returns in INR, benchmark Sensex (INR).
Past performance does not guarantee future results. This is educational content, not investment advice.


