
52-Week High Proximity: One Signal, 18 Markets, Very Different Outcomes
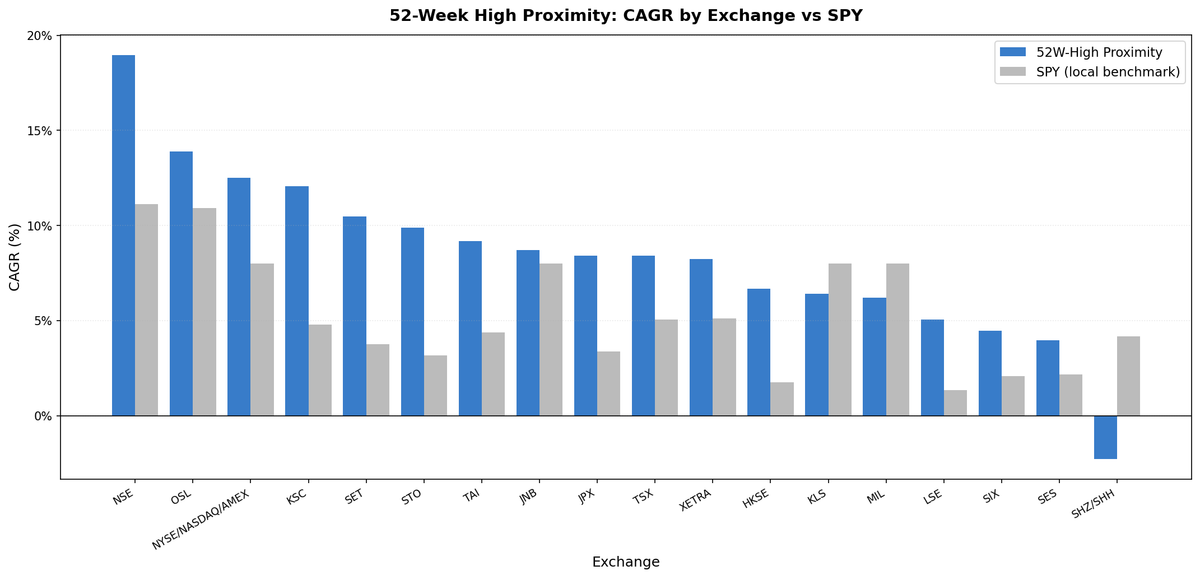
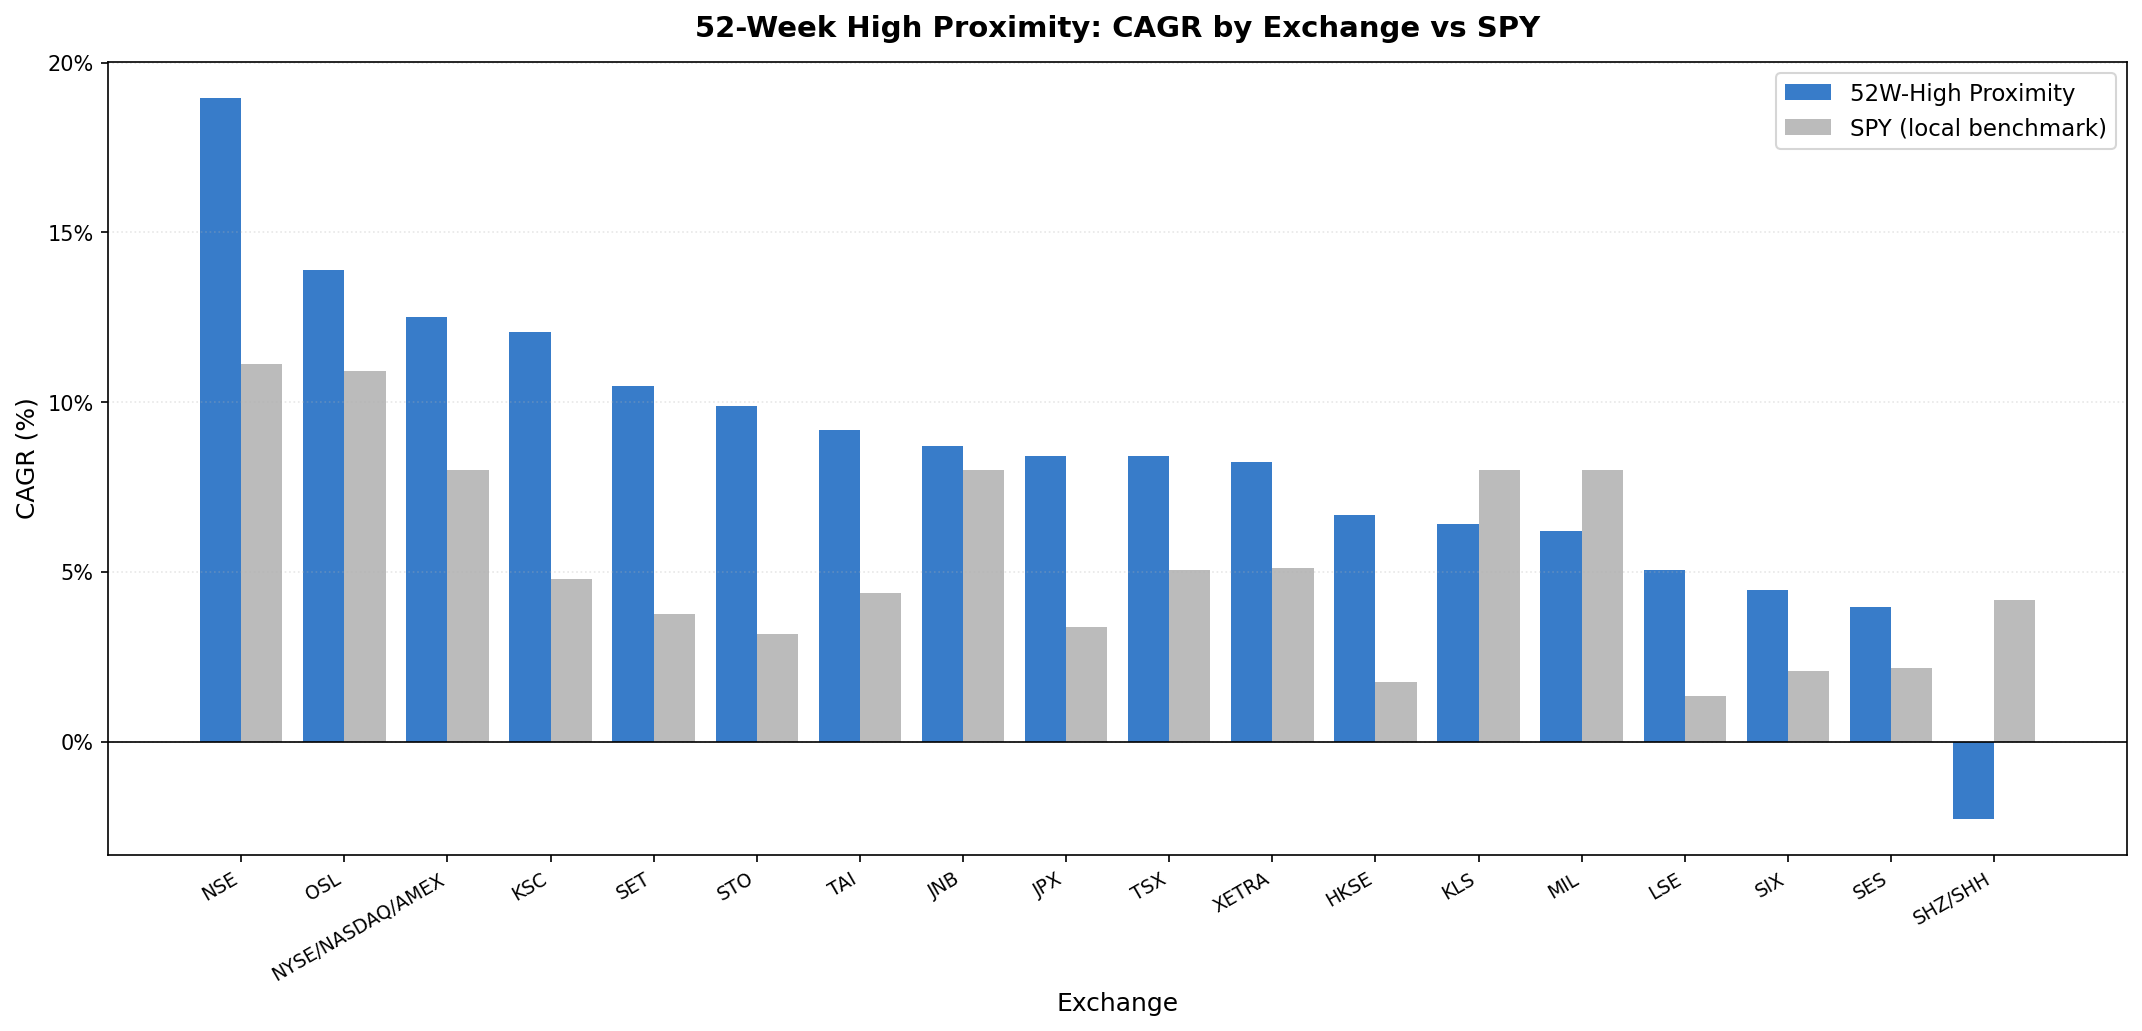
We ran the 52-week high proximity screen across 18 exchanges with local benchmark comparisons. 15 of 18 show positive alpha. India +7.84% vs Sensex, Korea +7.26% vs KOSPI, Japan +5.03% vs Nikkei. Even UK is positive (+3.71% vs FTSE). Local currency benchmarks reveal the real story.

52-Week High Proximity: One Signal, 18 Markets, Local Benchmarks Tell the Real Story
The 52-week high proximity strategy shows positive excess return in 15 of 18 global markets when compared to their local benchmarks. This is different from what cross-currency SPY comparisons suggested. India delivers +7.84% excess return vs the Sensex. Korea +7.26% vs the KOSPI. Even UK markets show +3.71% vs the FTSE 100. Only China, Italy, and Malaysia fail to beat their reference.
Contents
- Method
- Full Results
- Strongest Results: Asia-Pacific Retail Markets
- India (NSE): 18.96% CAGR, +7.84% vs Sensex, 69.8% down capture
- Korea (KSC): 12.07% CAGR, +7.26% vs KOSPI, 37.9% down capture
- Thailand (SET): 10.47% CAGR, +6.71% vs SET Index, 49.3% down capture
- Japan (JPX): 8.43% CAGR, +5.03% vs Nikkei, 41.3% down capture
- Taiwan (TAI): 9.18% CAGR, +4.80% vs TAIEX, 42.9% down capture
- Developed Markets: Positive Alpha vs Local Benchmarks
- Germany (XETRA): 8.23% CAGR, +3.11% vs DAX, 33.8% down capture
- Switzerland (SIX): 4.47% CAGR, +2.36% vs SMI
- UK (LSE): 5.07% CAGR, +3.71% vs FTSE 100, and Canada (TSX): 8.43% CAGR, +3.35% vs TSX
- The Sweden Anomaly Persists
- China: The Only Local-Benchmark Loser
- The Retail Gradient: Strength Varies, But Alpha Exists Broadly
- Down Capture: Protection Varies by Market
- What This Means for Portfolio Construction
- Part of a Series
- References
The signal works where anchoring matters. Individual investors treat the 52-week high as a psychological ceiling, hesitate to buy through it, and create systematic underreaction. That behavioral pattern exists across most markets. Comparing each market to its own local index, in the same currency, reveals the alpha that cross-currency SPY comparisons obscured.
The strongest results remain in retail-heavy Asia-Pacific markets. But developed European markets also beat their local indices, by smaller margins. The signal is real and broad. The question isn't whether it works, it's how strong the effect is in each market structure.
Data: FMP financial data warehouse, 2000-2025. Updated June 2026.
Method
| Parameter | Value |
|---|---|
| Signal | proximity_ratio = adjClose / MAX(high over trailing 252 trading days) |
| Selection | Top 30 by proximity ratio, equal weight |
| Cash rule | Hold cash if fewer than 10 stocks qualify |
| Execution | Next-day close (MOC, market-on-close) |
| Rebalancing | Quarterly (January, April, July, October) |
| Benchmarks | Local currency indices (Sensex for India, Nikkei for Japan, FTSE for UK, etc.) |
| Period | 2000-2025 (varies by exchange; some start later due to data availability) |
| Data | Point-in-time (45-day lag on financial data, FY key_metrics for market cap filters) |
| Market cap | Exchange-specific thresholds: $1B USD for US, ₹20B for India, ¥100B for Japan, calibrated for others |
Same screen across all 18 exchanges. The variables are stock universe, local market cap threshold, and local benchmark for performance comparison. Each exchange is compared to its own index in local currency, enabling an honest same-currency alpha measurement.
For methodology detail, SQL, and year-by-year breakdowns, see the regional posts linked below.
Full Results
| Exchange | CAGR | Local Benchmark | Excess | Sharpe | MaxDD | Down Capture |
|---|---|---|---|---|---|---|
| India (NSE) | 18.96% | Sensex 11.12% | +7.84% | 0.491 | -58.6% | 69.8% |
| Korea (KSC) | 12.07% | KOSPI 4.81% | +7.26% | 0.469 | -35.8% | 37.9% |
| Sweden (STO) | 9.89% | OMX S30 3.17% | +6.72%* | 0.355 | -50.5% | 85.8%* |
| Thailand (SET) | 10.47% | SET 3.76% | +6.71% | 0.387 | -55.7% | 49.3% |
| Japan (JPX) | 8.43% | Nikkei 3.40% | +5.03% | 0.509 | -42.8% | 41.3% |
| Hong Kong (HKSE) | 6.68% | Hang Seng 1.77% | +4.91% | 0.158 | -52.9% | 60.0% |
| Taiwan (TAI) | 9.18% | TAIEX 4.38% | +4.80% | 0.444 | -49.9% | 42.9% |
| US (NYSE+NASDAQ) | 12.52% | SPY 8.02% | +4.51% | 0.542 | -38.8% | 65.5% |
| UK (LSE) | 5.07% | FTSE 100 1.36% | +3.71% | 0.108 | -44.3% | 64.7% |
| Canada (TSX) | 8.43% | TSX 5.08% | +3.35% | 0.338 | -40.0% | 76.9% |
| Germany (XETRA) | 8.23% | DAX 5.12% | +3.11% | 0.420 | -41.9% | 33.8% |
| Norway (OSL)† | 13.89% | OSEAX 10.91% | +2.98% | 0.719 | -25.4% | 73.3% |
| Switzerland (SIX) | 4.47% | SMI 2.10% | +2.36% | 0.234 | -51.8% | 83.7% |
| Singapore (SES) | 3.97% | STI 2.17% | +1.80% | 0.071 | -55.7% | 83.6% |
| South Africa (JNB)‡ | 8.70% | SPY 8.02% | +0.68% | -0.021 | -42.2% | 34.8% |
| Malaysia (KLS)‡ | 6.42% | SPY 8.02% | -1.60% | 0.304 | -37.1% | 41.5% |
| Italy (MIL)‡ | 6.21% | SPY 8.02% | -1.80% | 0.161 | -66.8% | 92.5% |
| China (SHH+SHZ) | -2.25% | SSE 4.19% | -6.44% | -0.131 | -92.3% | 101.7% |
*Sweden: positive excess but 86% down capture means losses are amplified in bear markets. †Norway: 2013-2025 only (12.5 years), 58% cash periods. ‡Italy, Malaysia, and South Africa have no local index in the dataset, so they use SPY as a cross-currency proxy. Among the markets with a true local benchmark, only China underperforms.
Strongest Results: Asia-Pacific Retail Markets
India (NSE): 18.96% CAGR, +7.84% vs Sensex, 69.8% down capture
NSE-only universe (BSE excluded for deduplication). The +7.84% excess vs the Sensex over 25 years is meaningful alpha for a pure price signal. The Sensex itself returned 11.12% annually in INR.
2004-2007 captured the Indian equity boom after holding cash through 2000-2003 (NSE hadn't developed enough qualifying stocks yet). 2021-2024 shows sustained outperformance: +53.5%, +5.8%, +41.6%, +42.5% excess in four consecutive years.
Down capture of 69.8% vs the Sensex. Cash periods: 16.5% (17 of 103 quarters), concentrated 2000-2003. MaxDD -58.6% reflects India's high volatility, but the Sharpe of 0.491 vs the Sensex's 0.194 confirms better risk-adjusted returns.
Korea (KSC): 12.07% CAGR, +7.26% vs KOSPI, 37.9% down capture
Korea's retail-dominated KOSPI (60%+ individual investor volume) makes the anchoring effect visible. +7.26% excess vs the KOSPI with 37.9% down capture, the lowest of any market here, shows genuine asymmetry. Cash periods: 17.5% (18 of 103 quarters), concentrated 2000-2003.
2024 highlights the signal working: +25.1% vs KOSPI -10.2% (+35.3% excess). The win rate of 62.1% means the strategy beat the KOSPI in nearly two-thirds of quarters.
Thailand (SET): 10.47% CAGR, +6.71% vs SET Index, 49.3% down capture
Thailand's retail-heavy market produced solid results. The 2012 result (+72.8% vs SET +35.8%) shows the signal working: Thai mid-caps near their highs significantly outpaced the index. Cash periods (14% of history) concentrated in 2000-2002 after the 1997 Asian financial crisis.
One honest caveat: Thailand is the rare market where the strategy's peak-to-trough drawdown (-55.7%) was worse than the index's (-48.1%). The 2008 crash hit the high-proximity Thai names harder than the broad SET, even though the typical down quarter saw milder losses (49% down capture).
Japan (JPX): 8.43% CAGR, +5.03% vs Nikkei, 41.3% down capture
Japan improved from a near-zero excess vs SPY to +5.03% vs the Nikkei 225. The Nikkei returned 3.40% annually (JPY terms). The proximity strategy beat it consistently. Down capture of 41.3% shows strong protection vs the local benchmark.
2008: -22.5% vs Nikkei -38.5% (+16.0% excess). 2013: +60.1% vs Nikkei +48.9%. The signal finds the relative winners within Japan's structurally weak market, and the win rate of 56.3% is above half.
Taiwan (TAI): 9.18% CAGR, +4.80% vs TAIEX, 42.9% down capture
Taiwan is the cleanest of the second-tier results: +4.80% excess vs the TAIEX, Sharpe 0.444, and 42.9% down capture. 2022 was a standout protection year (-6.0% vs TAIEX -22.2%), and 2023 captured the AI-driven semiconductor rally (+56.8% vs +25.5%). Cash periods 20.4%, concentrated 2000-2004.
Developed Markets: Positive Alpha vs Local Benchmarks
Germany (XETRA): 8.23% CAGR, +3.11% vs DAX, 33.8% down capture
Germany shows the best down capture of any market at 33.8%, with +3.11% excess vs the DAX. Comparing to SPY in earlier tests showed a negative number because the DAX itself trailed US equities over the period. Against its own benchmark, the proximity signal works, and the protection is excellent.
Switzerland (SIX): 4.47% CAGR, +2.36% vs SMI
Switzerland shows +2.36% excess vs the SMI. The SMI is concentrated in global large-caps (Nestlé, Novartis, Roche). When these stocks approach 52-week highs, the signal positions there. Institutional dominance reduces magnitude vs retail-heavy markets, but the edge persists.
UK (LSE): 5.07% CAGR, +3.71% vs FTSE 100, and Canada (TSX): 8.43% CAGR, +3.35% vs TSX
Both beat their local benchmarks. The FTSE 100 returned 1.36%, the S&P/TSX 5.08%. The proximity signal beats both. Institutional dominance reduces alpha magnitude in the UK but doesn't eliminate it.
The Sweden Anomaly Persists
Sweden shows +6.72% excess vs the OMX Stockholm 30 but 85.8% down capture. The proximity strategy still amplifies losses vs the local benchmark in Swedish bear markets.
The nominal CAGR (9.89%) beats the OMX (3.17%) by a wide margin, but the down capture near 86% means drawdowns are severe. Sweden's market is concentrated in cyclical industrials and financials. When these stocks are near their 52-week highs before a downturn, they dominate the portfolio. When markets turn, they fall harder than the index.
The positive excess return comes from strong bull market years where up capture is also high. The pattern: amplify both directions, net positive over the full period. This is a different risk profile from Asia-Pacific markets where down capture is 38-49%.
China: The Only Local-Benchmark Loser
China (SHH+SHZ) returned -2.25% vs the Shanghai Composite (SSE) 4.19%, -6.44% excess.
China is the only market with a true local benchmark where the strategy significantly underperforms. The max drawdown of -92.3% and down capture of 101.7% show the strategy provides no protection vs the local market, and actually amplifies losses.
China's market structure is unusual: substantial retail participation (which should help) but also significant state influence, restricted capital flows, and A-share/H-share segmentation (which distort price signals). The behavioral edge that works elsewhere doesn't translate to Chinese markets, likely because fundamental signals are noisier and price discovery is less efficient.
Italy and Malaysia also show negative excess, but only against an SPY cross-currency proxy (no local index is available in the dataset), so those comparisons are less clean.
The Retail Gradient: Strength Varies, But Alpha Exists Broadly
The pattern across 18 markets is structural: retail participation correlates with alpha magnitude. But local benchmark comparisons reveal the signal works more broadly than cross-currency SPY comparisons suggested.
High retail participation (strongest alpha): - India, Korea, Thailand: +6.7% to +7.8% excess vs local benchmarks - Down capture: 38-70% vs local indices - The 52-week high functions as a powerful psychological anchor
Moderate retail and institutional mix (solid alpha): - Japan, Taiwan, Hong Kong, US, Canada: +3.4% to +5.0% excess - The signal works but institutional participation moderates the effect
Institutional-heavy but still positive (modest alpha): - UK (+3.71%), Germany (+3.11%), Switzerland (+2.36%), Singapore (+1.80%) - Professional money managers don't anchor as strongly, but local benchmark alpha persists - Previous SPY comparisons obscured this because local indices underperformed US equities
The anchoring bias exists across market structures. Magnitude varies. Among markets with a true local benchmark, only China shows negative excess.
Down Capture: Protection Varies by Market
Down capture vs local benchmarks ranges from excellent (Germany 33.8%, South Africa 34.8%, Korea 37.9%) to poor (China 101.7%, Italy 92.5%, Sweden 85.8%). The mechanism: as markets fall, fewer stocks stay near their 52-week highs, and the portfolio becomes selective.
| Exchange | Down Capture |
|---|---|
| Germany (DAX) | 33.8% |
| South Africa (JSE proxy) | 34.8% |
| Korea (KOSPI) | 37.9% |
| Japan (Nikkei) | 41.3% |
| Malaysia (proxy) | 41.5% |
| Taiwan (TAIEX) | 42.9% |
| Thailand (SET) | 49.3% |
| Hong Kong (HSI) | 60.0% |
| UK (FTSE) | 64.7% |
| US (SPY) | 65.5% |
| India (Sensex) | 69.8% |
| Norway (OSEAX) | 73.3% |
| Canada (TSX) | 76.9% |
| Singapore (STI) | 83.6% |
| Switzerland (SMI) | 83.7% |
| Sweden (OMX S30) | 85.8% |
| Italy (proxy) | 92.5% |
| China (SSE) | 101.7% |
Germany's 33.8% down capture with +3.11% excess shows the signal providing protection even in an institutional market.
What This Means for Portfolio Construction
The signal works broadly: 15 of 18 markets show positive excess vs local benchmarks. Magnitude varies by market structure.
Tier 1 (strongest alpha, 6-8% excess): India, Korea, Sweden, Thailand. Use these where you can tolerate the volatility and (for Sweden) the high down capture.
Tier 2 (solid alpha, 3-5% excess): Japan, Hong Kong, Taiwan, US, UK, Canada, Germany. Japan's +5.03% vs the Nikkei with 0.509 Sharpe, and Germany's +3.11% with 33.8% down capture, are particularly strong risk-adjusted.
Tier 3 (modest but positive alpha, 1-3% excess): Switzerland, Singapore. The signal still works but by smaller margins.
Avoid: China (-6.44% vs SSE). Italy and Malaysia also trail an SPY proxy.
Portfolio construction: Combine India, Korea, and Japan for diversified exposure to the strongest markets. All three have positive alpha vs their local indices, different economic cycles, and down capture below 70%. The combination captures the behavioral edge while reducing single-country risk.
Part of a Series
Individual market analyses with year-by-year breakdowns:
- 52-Week High Proximity on US Stocks - 12.52% CAGR, +4.51% vs SPY
- 52-Week High Proximity on Indian Stocks - 18.96% CAGR, +7.84% vs Sensex
- 52-Week High Proximity on Korean Stocks - 12.07% CAGR, +7.26% vs KOSPI
- 52-Week High Proximity on Thai Stocks - 10.47% CAGR, +6.71% vs SET
- 52-Week High Proximity on Japanese Stocks - 8.43% CAGR, +5.03% vs Nikkei
- 52-Week High Proximity on Taiwanese Stocks - 9.18% CAGR, +4.80% vs TAIEX
References
- George, T. J. & Hwang, C.-Y. (2004). "The 52-Week High and Momentum Investing." Journal of Finance, 59(5), 2145-2176.
Run the global screen: https://cetaresearch.com/data-explorer?q=JfyjnAI7cd
Data: Ceta Research (FMP financial data warehouse). 18 exchanges tested, quarterly rebalance, equal weight, next-day close execution, 2000-2025 (varies by exchange). Each market compared to its local currency index where available. Transaction costs included.
Past performance does not guarantee future results. This is educational content, not investment advice.


