
Asset Growth Screen Tested on 16 Global Exchanges: Where Capital Discipline Pays Off

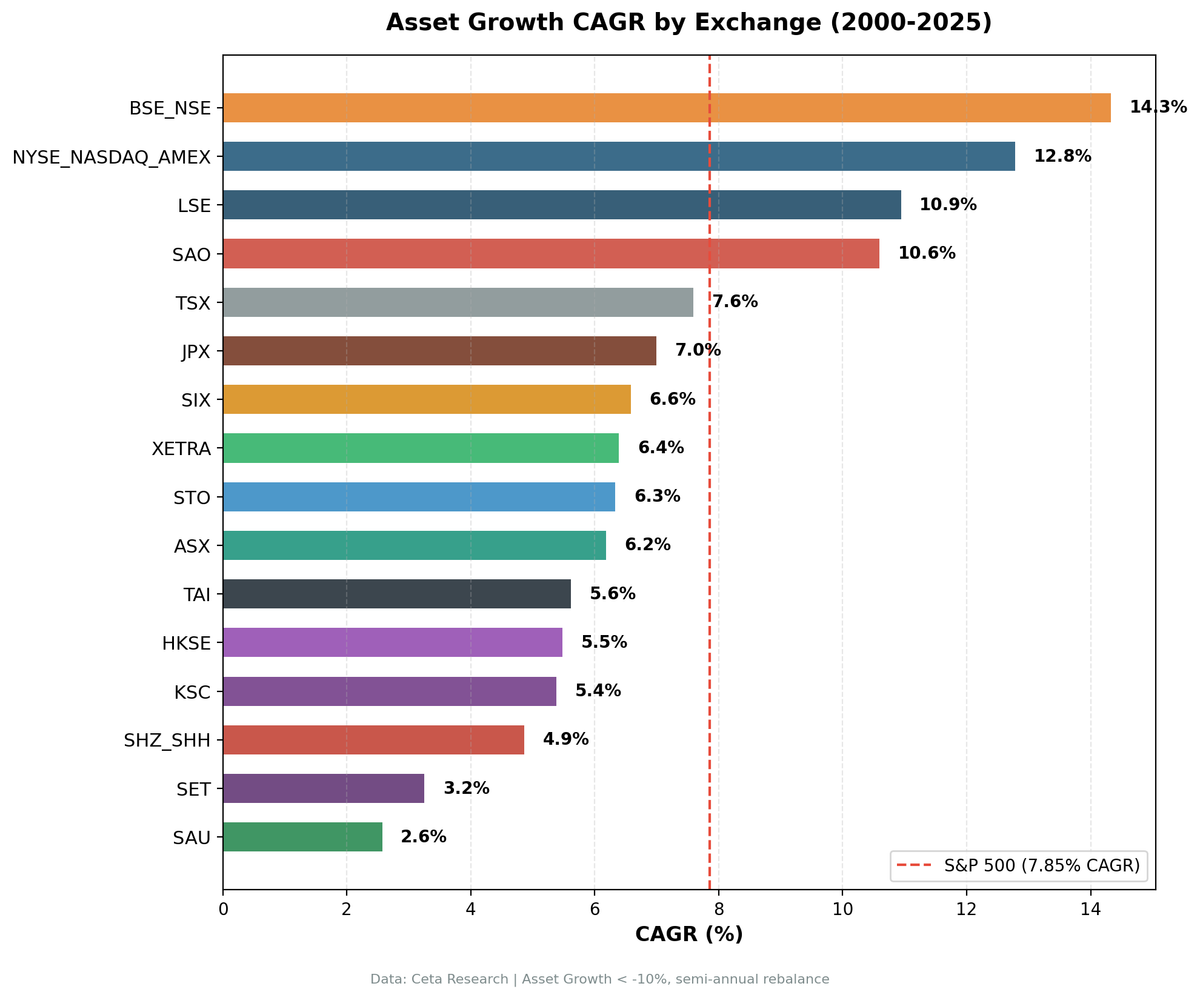
We ran the same asset growth screen on 16 exchanges across 14 countries, covering 25 years of annual data. The CAGR spread is nearly 12 points, from 14.33% (India) down to 2.57% (Saudi Arabia). When compared to each market's local benchmark, 12 of 16 exchanges show positive excess returns. The UK produced the strongest excess return (+9.71% vs FTSE 100), with a 96% win rate across 25 years. The US had the best risk-adjusted result (+4.93% vs SPY, 0.697 Sharpe). Japan (+3.68% vs Nikkei), Hong Kong (+3.84% vs Hang Seng), and Canada (+3.63% vs TSX Composite) rounded out the top performers.
Contents
- Method
- Results Summary
- Two Tiers of Performance
- Tier 1: Positive Excess vs Local Benchmark
- Tier 2: Negative Excess or No Local Benchmark
- What Explains the Spread?
- 1. The Benchmark Matters More Than We Expected
- 2. Universe Depth and Data Coverage
- 3. Complementary Pattern with Debt-Safety Signals
- Risk-Return Tradeoffs
- Excluded Exchange
- Limitations
- Takeaway
Method
Screen: Asset growth (YoY) between -20% and +10%, ROE > 8%, ROA > 5%, operating margin > 10%, market cap > local-currency equivalent threshold per exchange Period: 2000-2025 (25 annual rebalance periods) Benchmark: Local index for each exchange (Sensex for India, DAX for Germany, etc.). SPY used as fallback where no local index is available. Execution: Next-day close (MOC model). Signal generated at rebalance date, execution at next trading day's close. Portfolio: Top 30 by lowest asset growth, equal weight, annual rebalance (July) Transaction costs: Size-tiered model (0.1%-0.5% depending on market cap) Cash rule: Hold cash if fewer than 10 stocks qualify Data quality guards: Entry price > $1, single-period return capped at 200%, 45-day reporting lag
Same code, same filters, same methodology across all 16 exchanges. The only variable is the stock universe and the local benchmark.
Full methodology: backtests/METHODOLOGY.md
Results Summary
| Exchange | CAGR | Benchmark | Excess | Sharpe | Max DD | Vol | Cash % | Avg Stocks |
|---|---|---|---|---|---|---|---|---|
| India (BSE+NSE) | 14.33% | Sensex 12.06% | +2.27% | 0.300 | -19.8% | 26.1% | 20% | 24.1 |
| US (NYSE+NASDAQ+AMEX) | 12.78% | SPY 7.85% | +4.93% | 0.697 | -28.3% | 15.5% | 0% | 26.2 |
| UK (LSE) | 10.94% | FTSE 100 1.23% | +9.71% | 0.482 | -20.3% | 15.4% | 0% | 19.0 |
| Brazil (SAO) | 10.59% | Bovespa 8.70% | +1.89% | 0.005 | -9.5% | 16.6% | 16% | 20.8 |
| Canada (TSX) | 7.59% | TSX Comp 3.95% | +3.63% | 0.314 | -31.5% | 16.1% | 8% | 24.8 |
| Japan (JPX) | 6.99% | Nikkei 3.31% | +3.68% | 0.372 | -29.3% | 18.5% | 16% | 27.7 |
| Switzerland (SIX) | 6.58% | SPY 7.85% | -1.27% | 0.386 | -36.9% | 15.7% | 0% | 18.1 |
| Germany (XETRA) | 6.39% | DAX 5.04% | +1.35% | 0.269 | -46.6% | 16.3% | 0% | 20.6 |
| Sweden (STO) | 6.33% | SPY 7.85% | -1.52% | 0.260 | -35.7% | 16.6% | 28% | 22.6 |
| Australia (ASX) | 6.18% | ASX 200 3.89% | +2.28% | 0.166 | -46.1% | 16.1% | 12% | 19.5 |
| Taiwan (TAI) | 5.62% | TAIEX 4.09% | +1.53% | 0.401 | -10.9% | 11.5% | 32% | 28.8 |
| Hong Kong (HKSE) | 5.48% | Hang Seng 1.64% | +3.84% | 0.126 | -33.9% | 19.7% | 0% | 19.6 |
| Korea (KSC) | 5.38% | KOSPI 5.35% | +0.03% | 0.174 | -24.7% | 13.7% | 40% | 24.1 |
| China (SHZ+SHH) | 4.86% | SSEC 2.43% | +2.43% | 0.069 | -63.6% | 34.2% | 0% | 20.3 |
| Thailand (SET) | 3.25% | SPY 7.85% | -4.60% | 0.048 | -35.6% | 15.8% | 16% | 24.1 |
| Saudi Arabia (SAU) | 2.57% | SPY 7.85% | -5.28% | -0.058 | -39.2% | 16.0% | 36% | 23.6 |
Note: Exchanges without a local index benchmark (Sweden, Switzerland, Thailand, Saudi Arabia) use SPY as fallback. Sharpe ratios use local risk-free rates.
Two Tiers of Performance
With local benchmarks, the picture changes from what a pure SPY comparison showed. Twelve of 16 exchanges beat their local market. Four didn't.
Tier 1: Positive Excess vs Local Benchmark
UK (LSE): 10.94% CAGR, +9.71% vs FTSE 100 The UK is the standout. FMP's warehouse now includes FY data for LSE-listed companies, and the results are striking. The portfolio beat the FTSE 100 in 24 of 25 years, a 96% win rate. That's not a typo. The FTSE 100 returned just 1.23% annually over 25 years, one of the weakest major indices globally. Capital-disciplined UK companies delivered nearly 9x the benchmark's return. Down capture of 2.71% means the portfolio barely participated in FTSE drawdowns. Up capture of 185% means it amplified the upside. The -20.3% max drawdown is moderate, and the 0.482 Sharpe ranks second only to the US.
US (NYSE+NASDAQ+AMEX): 12.78% CAGR, +4.93% vs SPY The US produced the strongest risk-adjusted alpha. Best Sharpe (0.697), zero cash periods, 26+ qualifying stocks every year for 25 years. This is the cleanest test in the dataset. US companies have standardized, audited financials. When a company reports flat or declining total assets while maintaining 8%+ ROE, the signal is reliable. That's the core of why asset growth screening works here: the data means what it says.
Hong Kong (HKSE): 5.48% CAGR, +3.84% vs Hang Seng Hong Kong remains a strong outperformer against its own market. The Hang Seng returned just 1.64% annually over 25 years. The screen picked profitable, capital-disciplined HK companies that avoided the real estate and Chinese exposure that dragged the broader index down. Zero cash periods and 19.6 avg stocks.
Japan (JPX): 6.99% CAGR, +3.68% vs Nikkei Japan is the other newly-added exchange. Previously excluded due to lack of FY data, JPX now shows 25 years of results. The portfolio beat the Nikkei (3.31% CAGR) by 3.68 points annually with a 60% win rate and 0.372 Sharpe. Four early cash years (2000-2003) dragged CAGR. When invested, performance was strong: +49.6% in 2012, +40.0% in 2016, +37.9% in 2005. The 27.7 avg stocks per period shows Japan's large corporate universe fills the screen well. Beta of 0.727 and down capture of 39.67% provide meaningful downside protection.
Canada (TSX): 7.59% CAGR, +3.63% vs TSX Composite Against the TSX Composite (3.95% CAGR), the strategy comfortably outperformed. Canada's resource-heavy market makes asset growth screening effective: the screen avoids aggressive mining capex phases and picks up companies in their disciplined periods. 60% win rate, 8% cash.
China (SHZ+SHH): 4.86% CAGR, +2.43% vs Shanghai Composite China was previously compared to SPY (-2.99% excess), which painted a misleading picture. Against the Shanghai Composite (2.43% CAGR), the screen actually adds value. The worst volatility in the dataset at 34.2% and the deepest drawdown at -63.6% remain concerns. State-owned enterprises dominate, and the signal is noisy. But measured against the right benchmark, China is a positive-alpha exchange.
Australia (ASX): 6.18% CAGR, +2.28% vs ASX 200 The ASX 200 returned 3.89% annually. The screen delivered +2.28% excess. The -46.1% max drawdown remains deep, driven by the GFC's impact on Australian resource stocks. But the quality filters separated productive mining investment from wasteful expansion better than the ASX 200 did.
India (BSE+NSE): 14.33% CAGR, +2.27% vs Sensex India still produced the highest absolute CAGR. But the excess over Sensex (+2.27%) is much smaller than the old +6.76% over SPY. That gap was mostly currency: the INR depreciated roughly 49% against the USD from 2000 to 2025, inflating the apparent alpha when using a USD benchmark. Against Sensex, the signal still works, but the alpha is modest. Volatility of 26.1% is high, cash at 20%, max drawdown at -19.8%.
Brazil (SAO): 10.59% CAGR, +1.89% vs Bovespa The Bovespa returned 8.70% annually. The screen added +1.89% with dramatically lower risk: -9.5% max drawdown vs -38.5% for the Bovespa. Brazil's high risk-free rate (10.5%) explains the near-zero Sharpe despite the solid CAGR. Cash at 16%.
Taiwan (TAI): 5.62% CAGR, +1.53% vs TAIEX Against the TAIEX (4.09% CAGR), the screen generated modest alpha. Cash periods at 32% reflect Taiwan's semiconductor-heavy market, where the filter combination is too strict for most companies. When invested, the Sharpe of 0.401 is competitive, and the -10.9% max drawdown is the shallowest in the dataset.
Germany (XETRA): 6.39% CAGR, +1.35% vs DAX The DAX returned 5.04% annually. The screen added +1.35% with lower volatility (16.3% vs 21.1% for DAX) and shallower drawdowns (-46.6% vs -53.4%). The screen's value in Germany is defensive: it doesn't beat the DAX in bull markets, but it limits losses during corrections. Beta of 0.455 means the portfolio moves at less than half the DAX's intensity.
Korea (KSC): 5.38% CAGR, +0.03% vs KOSPI Essentially flat vs KOSPI (5.35%). Cash periods at 40% mean the portfolio was uninvested more than a third of the time. Korea's chaebol-dominated market doesn't produce enough independent, capital-disciplined mid-caps to fill the screen consistently. When invested, the -24.7% max drawdown was relatively tame.
Tier 2: Negative Excess or No Local Benchmark
Four exchanges trail their benchmark (SPY used as fallback where no local index is available).
Switzerland (SIX): 6.58% CAGR, -1.27% vs SPY. Below SPY by return, but the Sharpe (0.386) is competitive. Only 18.1 stocks on average qualified, making this the smallest portfolio. Swiss companies are famously conservative with capital. When most of the market already practices capital discipline, the screen can't separate winners from the pack. Zero cash periods.
Sweden (STO): 6.33% CAGR, -1.52% vs SPY. Negative excess with a 28% cash period rate. The local-currency threshold narrows the qualifying universe. Sweden's export-driven industrials tend to be well-governed, so the screening signal has less room to differentiate.
Thailand (SET): 3.25% CAGR, -4.60% vs SPY. This is a stark contrast to interest coverage screening, where Thailand was a top performer. Debt safety matters in Thailand. Capital discipline doesn't generate the same edge. The market rewards companies that can service debt, not companies that grow slowly.
Saudi Arabia (SAU): 2.57% CAGR, -5.28% vs SPY. Cash at 36%. The Saudi market is young, and the universe of companies meeting all quality thresholds simultaneously is thin. The Sharpe of -0.058 confirms the screen doesn't generate useful signal here.
What Explains the Spread?
The nearly 12-point gap from India (14.33%) to Saudi Arabia (2.57%) has three structural drivers.
1. The Benchmark Matters More Than We Expected
The biggest lesson from switching to local benchmarks: most of the "underperformance" in the old analysis was benchmark selection, not signal failure. The UK went from all-cash (excluded) to +9.71% (vs FTSE). Canada went from -0.37% (vs SPY) to +3.63% (vs TSX). Hong Kong went from -2.80% to +3.84%. China flipped from -2.99% (vs SPY) to +2.43% (vs SSEC). SPY was one of the best-performing indices globally from 2000 to 2025. Comparing every exchange to SPY made the strategy look worse than it was. The signal generates alpha against local markets in 12 of 16 exchanges.
2. Universe Depth and Data Coverage
Exchanges with high cash percentages (Korea 40%, Saudi Arabia 36%, Taiwan 32%, Sweden 28%) had fewer qualifying stocks. This isn't just a data issue. It means the filter combination is too strict for those universes, or the companies in those markets don't naturally segment along asset growth lines. When you can't fill a 30-stock portfolio, the screen's statistical power drops. The US had zero cash periods and averaged 26.2 stocks. That consistency matters.
3. Complementary Pattern with Debt-Safety Signals
Interest coverage screening worked best in emerging markets: Thailand (25.7%), Hong Kong (21.5%), India (32.7%). Asset growth screening generates positive alpha more broadly, but the strongest risk-adjusted result is in the US (+4.93% excess, 0.697 Sharpe). The signals reward different things. Interest coverage identifies companies that can survive in credit-risky environments. Asset growth identifies companies that allocate capital wisely. India appears in both top groups. The UK, which was previously excluded for data reasons, turned out to be the strongest excess return in the entire dataset (+9.71%).
Risk-Return Tradeoffs
CAGR alone doesn't tell the full story. Here's the risk-adjusted picture, sorted by Sharpe ratio.
| Exchange | CAGR | Sharpe | Max DD | Vol |
|---|---|---|---|---|
| US | 12.78% | 0.697 | -28.3% | 15.5% |
| LSE | 10.94% | 0.482 | -20.3% | 15.4% |
| TAI | 5.62% | 0.401 | -10.9% | 11.5% |
| SIX | 6.58% | 0.386 | -36.9% | 15.7% |
| JPX | 6.99% | 0.372 | -29.3% | 18.5% |
| TSX | 7.59% | 0.314 | -31.5% | 16.1% |
| India | 14.33% | 0.300 | -19.8% | 26.1% |
| XETRA | 6.39% | 0.269 | -46.6% | 16.3% |
| STO | 6.33% | 0.260 | -35.7% | 16.6% |
| KSC | 5.38% | 0.174 | -24.7% | 13.7% |
| ASX | 6.18% | 0.166 | -46.1% | 16.1% |
| HKSE | 5.48% | 0.126 | -33.9% | 19.7% |
| China | 4.86% | 0.069 | -63.6% | 34.2% |
| SET | 3.25% | 0.048 | -35.6% | 15.8% |
| SAO | 10.59% | 0.005 | -9.5% | 16.6% |
| SAU | 2.57% | -0.058 | -39.2% | 16.0% |
The US dominates risk-adjusted returns. Highest Sharpe (0.697), second-highest CAGR (12.78%), and a moderate drawdown (-28.3%). No other exchange comes close on all three dimensions.
The UK is the runner-up by Sharpe (0.482) with the highest excess return of any exchange (+9.71% vs FTSE). The combination of strong absolute CAGR (10.94%), low volatility (15.4%), and shallow drawdown (-20.3%) makes LSE the second-best risk-adjusted result.
Taiwan's high Sharpe (0.401) is deceptive given the low volatility (11.5%) and high cash rate (32%). The -10.9% max drawdown looks great, but much of it is the cash buffer dampening losses.
Japan (JPX) at 0.372 Sharpe is a solid addition. Four early cash years held back the headline CAGR, but when invested, the portfolio delivered consistently. 27.7 stocks per period shows Japan's deep corporate universe fills the screen well.
India's high CAGR (14.33%) comes with high volatility (26.1%). The Sharpe of 0.300 is decent but not top-tier. Investors would experience large swings for those returns. But the -19.8% max drawdown is the shallowest of any fully-invested exchange.
Brazil's near-zero Sharpe (0.005) despite 10.59% CAGR reflects Brazil's high risk-free rate (10.5%). The very low drawdown (-9.5%) suggests the return came in concentrated bursts rather than steady compounding.
China looks different with the right benchmark. 34.2% volatility and -63.6% max drawdown remain concerning. But measured against the Shanghai Composite (2.43% CAGR), the screen adds +2.43% excess. State-owned enterprise dominance makes the signal noisy, but it's no longer a negative-alpha exchange.
Excluded Exchange
One exchange was excluded from this comparison due to data limitations.
| Exchange | Issue |
|---|---|
| SGX (Singapore) | No symbols in exchange profile. Data pipeline doesn't cover this exchange. |
JPX (Japan) and LSE (UK) were previously excluded because the FMP warehouse lacked annual (FY) financial data. That data is now available, and both exchanges are included in this comparison. Japan produced 6.99% CAGR (+3.68% vs Nikkei), and the UK produced 10.94% CAGR (+9.71% vs FTSE 100).
Limitations
Local benchmarks unavailable for some exchanges. Sweden, Switzerland, Thailand, and Saudi Arabia use SPY as fallback because their local index symbols aren't covered in our price data. This means those four exchanges are still being compared to a USD benchmark, which likely overstates their underperformance.
Currency effects. Returns are in local currency terms as stored in the database. Cross-exchange CAGR comparisons mix currencies. India's 14.30% is in INR, Brazil's 10.57% is in BRL. Neither is directly comparable to the US 12.78% in USD without currency conversion. The local benchmark comparison eliminates this issue for alpha measurement.
Cash periods reduce comparability. Exchanges with 16-40% cash periods (India, Brazil, Korea, Saudi Arabia, Taiwan, Sweden, Thailand) had less time invested. Their CAGR reflects a blend of cash holding and screen returns, not pure strategy performance.
Survivorship bias. FMP data includes delisted stocks in most exchanges, but coverage varies. Some emerging market data may have more survivorship bias than US data.
Data quality guards needed. Entry price floors and return caps mitigate bad data, but some exchanges may still contain pricing anomalies (especially around stock splits and corporate actions) that affect results.
Financial reporting standards vary. Asset growth calculated from IFRS balance sheets isn't identical to US GAAP. The definition of "total assets" and how revaluations, goodwill, and leases are treated differs across jurisdictions. This introduces noise into cross-exchange comparisons.
Takeaway
The asset growth anomaly beats local benchmarks in 12 of 16 exchanges tested. The UK has the strongest excess return (+9.71% vs FTSE 100, 96% win rate). The US has the strongest risk-adjusted alpha (+4.93% excess, 0.697 Sharpe). Hong Kong (+3.84% vs Hang Seng), Japan (+3.68% vs Nikkei), Canada (+3.63% vs TSX), and India (+2.27% vs Sensex) follow. China, Australia, Brazil, Taiwan, Germany, and Korea also show positive excess against their local markets.
The old SPY-only comparison painted a misleading picture. Adding the UK and Japan, and switching China to a local benchmark, changed the conclusion from "works in 9 of 14 markets" to "works in 12 of 16." SPY was one of the best-performing indices globally from 2000 to 2025. Comparing everything to SPY set an artificially high bar.
The signal still fails in some markets. Thailand and Saudi Arabia show negative excess even with generous benchmark choices. Sweden and Switzerland trail SPY but lack local benchmarks for a fair test. In those markets, a debt-safety screen like interest coverage is likely to generate more alpha.
Capital discipline compounds in most markets. The key is measuring alpha against the right benchmark.
Data: Ceta Research (FMP financial data warehouse), 2000-2025. Full methodology: METHODOLOGY.md. For academic references, see the flagship blog post. Past performance does not guarantee future results. This is educational content, not investment advice.


