
Beat Streaks in Taiwan: +1.79% T+21 in a Tech-Heavy Market
Taiwan drift builds to +1.79% by day 21, streak 3 to +2.60% T+21. 3,721 events from 2012-2025. Corrected August 2026: measured against SPY, so these are a Taiwan-minus-US spread. Update: a paired ^TWII run now shows beats +2.05% and miss streaks -0.92% at T+21. Local, and passes its inverse.

Correction, August 2026. Two caveats belong at the top of this post, not buried in Limitations. First, every CAR here is measured against SPY, the S&P 500 ETF, because the framework had no Taiwan benchmark. So "+1.79% abnormal return" means Taiwanese beat-streak stocks beat the US market by 1.79% in dollars over 21 trading days. It does not mean they beat the Taiwanese market. Second, at the time of this correction we had never computed the inverse leg: we had measured what happens when a streak extends and nothing else, so this result had not been tested against its own mirror image. The numbers below are unchanged. Update, 2026-08-29: a fresh paired run against ^TWII, the Taiwan Weighted Index, addresses both defects: beat streaks drift +2.05% at T+21 (t=+12.5, n=4,138) and consecutive-miss streaks, the mirror image of the extending-beat event, drift -0.92% (t=-7.6, n=5,975). Measured against its own market, the Taiwanese signal survives its own direction test. (Returns after a streak breaks, as distinct from consecutive misses, are measured only for the US.) Details in Limitations.ContentsMethodWhat We FoundStreak Length BreakdownThe SQL ScreenWhy It WorksLimitationsTakeawayReferences
Taiwan beats analyst EPS estimates and then keeps beating them. When you track what happens to stock prices after the 2nd, 3rd, and 4th consecutive beat on TWSE and TPEX, you find a market that barely reacts on day 1 but builds a +1.79% return over SPY by day 21. The drift is large and statistically strong, it's concentrated in the streaks that matter most, and it's measured against the wrong market. All three are true at once.
Data: FMP financial data warehouse, 2000–2025. Updated March 2026.
Method
Data source: TradingStudio (FMP earnings data) Universe: TWSE + TPEX (TAI + TWO exchanges), market cap > TWD 10B (historical key_metrics) Period: 2012–2025 Benchmark: SPY (S&P 500 ETF, see Limitations) Beat definition: epsActual > epsEstimated, with ABS(epsEstimated) > 0.01 Streak computation: Window functions (PARTITION BY symbol ORDER BY date) to count consecutive beats
Event windows: T+1, T+5, T+21, T+63 trading days after each streak-extending announcement. Abnormal return = stock return minus SPY return over the same window.
Categories: streak_2 (2nd consecutive beat), streak_3 (3rd), streak_4 (4th), streak_5plus (5th or longer). Total events: 3,721 across all streak categories.
What We Found
Taiwan's beat-streak signal is almost entirely in the drift, not the announcement reaction.
The T+1 return is +0.49%. That's meaningful (t-stat 8.67), but it's one of the more muted day-1 reactions globally. Then something interesting happens. By T+21, the cumulative abnormal return has built to +1.79%, the second-highest T+21 result of any exchange in this study, behind only India. The market is slowly processing information that the announcement itself didn't fully price.
By T+63, the CAR slips back to +1.20%. Some of the drift reverses. This pattern, strong accumulation through 21 days followed by partial reversal, fits a market where initial under-reaction gives way to correction but overshoots slightly in the other direction.
Taiwan's tech and semiconductor concentration amplifies this dynamic. Beat streaks cluster in companies where estimate uncertainty is high, semiconductor equipment, IC design, and electronics manufacturers where quarterly results depend on order cycles that analysts struggle to model precisely.
| Window | Mean CAR | t-stat | N |
|---|---|---|---|
| T+1 | +0.49% | 8.67 | 3,721 |
| T+21 | +1.79% | 9.43 | ~3,710 |
| T+63 | +1.20% | 3.70 | ~3,680 |
All three windows are statistically significant. The t-stats don't degrade dramatically as the window extends, which means the drift is broad-based, not driven by a handful of outlier events.
Streak Length Breakdown
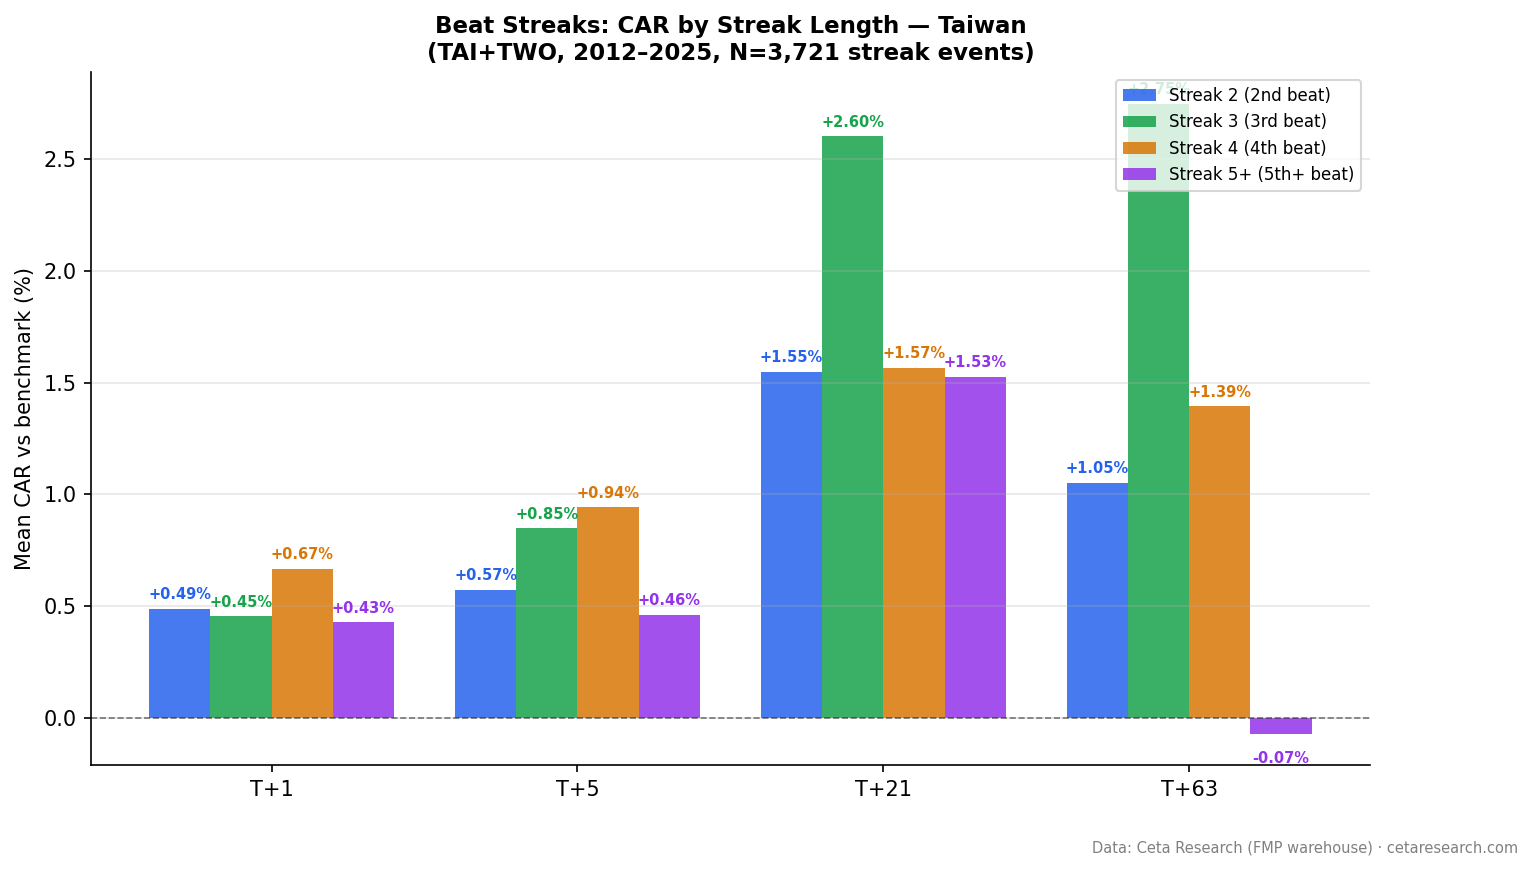
The streak_3 result stands out immediately.
| Streak | N | T+1 | T+21 | T+63 |
|---|---|---|---|---|
| Streak 2 | 1,618 | +0.49% | +1.55% | +1.05% |
| Streak 3 | 818 | +0.45% | +2.60% | +2.75% |
| Streak 4 | 443 | +0.67% | +1.57% | +1.39% |
| Streak 5+ | 670 | +0.43% | +1.53% | -0.07% |
Streak_3 T+21 at +2.60% is the highest third-consecutive-beat result of any major developed market in this study. The T+63 of +2.75% is similarly strong. Something about a company's third consecutive beat in Taiwan signals durable performance that the market underprices.
Streak_4 shows slightly weaker results than streak_3. This is common across markets: by the fourth beat, some portion of the market has identified the pattern and the easy money is gone.
Streak_5+ T+63 at -0.07% deserves attention. Very long streaks in Taiwan produce no cumulative abnormal return over three months. One interpretation: by streak 5, these companies are either actively sandbagging estimates or are so well-known as consistent beaters that the market prices in the next beat before it happens. The announcement itself carries less new information.
The practical implication is clear. Streak_2 and streak_3 are where the signal lives. Streak_5+ is priced out.
The SQL Screen
This query identifies companies currently on active beat streaks of 3 or more quarters on Taiwanese exchanges.
WITH ordered_earnings AS (
    SELECT
        symbol,
        CAST(date AS DATE) AS event_date,
        epsActual AS actual,
        epsEstimated AS estimated,
        CASE WHEN epsActual > epsEstimated THEN 1 ELSE 0 END AS is_beat,
        ROUND((epsActual - epsEstimated)
            / ABS(NULLIF(epsEstimated, 0)) * 100, 1) AS surprise_pct,
        ROW_NUMBER() OVER (PARTITION BY symbol ORDER BY date DESC) AS recency_rank
    FROM earnings_surprises
    WHERE exchange IN ('TAI', 'TWO')
      AND epsEstimated IS NOT NULL
      AND ABS(epsEstimated) > 0.01
      AND epsActual IS NOT NULL
),
streak_calc AS (
    SELECT *,
        SUM(CASE WHEN is_beat = 0 THEN 1 ELSE 0 END)
            OVER (PARTITION BY symbol ORDER BY recency_rank
                  ROWS UNBOUNDED PRECEDING) AS streak_breaker
    FROM ordered_earnings
),
streaks AS (
    SELECT
        symbol,
        COUNT(*) AS current_streak,
        ROUND(AVG(surprise_pct), 1) AS avg_surprise_pct,
        MIN(event_date) AS streak_start,
        MAX(event_date) AS latest_beat
    FROM streak_calc
    WHERE streak_breaker = 0 AND is_beat = 1
    GROUP BY symbol
    HAVING COUNT(*) >= 3
)
SELECT
    s.symbol,
    s.current_streak,
    s.avg_surprise_pct,
    s.streak_start,
    s.latest_beat,
    ROUND(k.marketCap / 1e9, 1) AS mktcap_bn_usd
FROM streaks s
JOIN key_metrics k ON s.symbol = k.symbol AND k.period = 'FY'
WHERE k.marketCap > 500000000
QUALIFY ROW_NUMBER() OVER (PARTITION BY s.symbol ORDER BY k.date DESC) = 1
ORDER BY s.current_streak DESC, s.avg_surprise_pct DESC
LIMIT 30
The streak_breaker column is the key mechanism. Earnings are ordered from most recent to oldest. Each time a miss appears (is_beat = 0), the running sum increments. Any row where streak_breaker = 0 means we haven't encountered a miss going backward from the most recent report, those rows form the current active streak.
The query filters to TAI and TWO exchanges and requires a market cap above $500M USD (roughly TWD 15B) to focus on companies with enough liquidity to act on.
Run this screen live on Ceta Research → (pre-loaded query, no account required)
Why It Works
Two papers provide the theoretical grounding for beat-streak effects.
Loh & Warachka (2012), "Streaks in Earnings Surprises and the Cross-Section of Stock Returns" showed that consecutive earnings surprise streaks predict future stock returns. Their central finding: investors treat each beat as a mostly independent event rather than recognizing the pattern. The streak carries information the market under-weights, producing predictable return drift in the direction of the streak. This under-reaction is larger in stocks with lower analyst coverage and higher uncertainty, precisely the conditions that describe many Taiwanese mid-caps outside the major semiconductor names.
Myers, Myers & Skinner (2007), "Earnings Momentum and Earnings Management" documented the other side of the story. Companies with long beat streaks actively manage expectations downward to maintain them. Conservative guidance ensures beatable targets. The practical implication: at short streak lengths (2–3), the signal reflects genuine fundamental momentum. At very long streak lengths (5+), expectation management increasingly contaminates the signal. This aligns well with Taiwan's data, where streak_3 outperforms streak_5+ significantly.
The Taiwan data fits the Loh & Warachka framework well. The prolonged drift (peaking at T+21, not T+1) suggests the market is slow to incorporate streak information into prices, consistent with under-reaction being the primary mechanism.
Limitations
Wrong-market benchmark. SPY is used as the benchmark because no Taiwan-specific ETF was available in the framework. This is a defect, not a rounding issue. Abnormal returns here measure performance versus the US market, in dollars, not versus the Taiwanese market. Two things ride inside every number below: the TWSE-minus-S&P 500 differential over each window, and the TWD/USD move. A Taiwan index such as ^TWII isolates the streak effect, and the paired 2026-08-29 run in the next paragraph does exactly that; EWT was not used anywhere in this study. The tables above remain the original SPY-based run. Read those CARs as a Taiwan-minus-US spread, not as Taiwanese alpha.
The miss-streak control was run 2026-08-29, after publication. A fresh paired run, and this one repairs both defects at once, since it benchmarks against ^TWII instead of SPY: beats +2.05% at T+21 (t=+12.5) and +1.84% at T+63; miss streaks -0.92% at T+21 (t=-7.6) and -2.81% at T+63 (t=-12.5). Opposite signs, both significant (ties, actual = estimate, break both streak types). Taiwanese beat-streak drift is a real local abnormal return, not a Taiwan-minus-US spread and not generic announcement noise. The paired run's levels aren't comparable to the SPY-based tables above: different benchmark (^TWII vs SPY), a different T+0 base (last pre-announcement close), and fresh data. The direction verdict and the local-index levels are the parts to carry forward. Event-level artifacts: beat-streaks/results/mirror-2026-08/ in the public repo.
Domicile. 98.1% of the 3,721 events belong to Taiwan-domiciled companies, with Cayman Islands registrations at 1.5% the largest remaining block. The exchange filter selects listings rather than companies, which distorts some markets badly. Taiwan isn't one of them.
Sample concentration. Taiwan's listed universe skews heavily toward tech, semiconductors, and electronics. Beat streaks in this data may reflect sector-specific dynamics rather than a general Taiwan market phenomenon. The results might not generalize to Taiwanese companies in other industries.
Exchange coverage. Both TAI (TWSE main board) and TWO (TPEX) are included. Coverage quality is better for larger TWSE names. Smaller TWO companies may have thinner analyst coverage, which affects both the quality of estimates and the reliability of beat/miss classifications.
Expectations management at streak_5+. The flat-to-negative T+63 return for very long streaks suggests these companies may be managing estimates actively. We can't distinguish genuine outperformance from sandbagging in the raw data.
Takeaway
Taiwanese beat-streak stocks outperformed the S&P 500 by +1.79% over 21 trading days across 3,721 events from 2012 to 2025, with a t-stat of 9.43. That's a large, statistically strong result, and it's the wrong measurement for the question. Against SPY, the number mixes the streak effect with the Taiwan-versus-US market differential and the currency. What it establishes is that these stocks moved; what it can't establish is that they moved relative to their own market.
Within the study, the shape is consistent: streak_3 is the peak (+2.60% T+21, +2.75% T+63) and streak_5+ shows no meaningful drift by T+63. That pattern is a relative comparison inside one benchmark, so it survives the benchmark problem better than the level does.
For investors with Taiwan exposure: the two tests this post originally lacked have now been run. Against ^TWII, beat streaks drift +2.05% at T+21 while miss streaks drift -0.92%, so the effect survives a local benchmark and its own inverse. What remains untested is tradability: costs, fills and capacity are outside this study.
Part of a series: Beat streaks analyzed across 16 exchanges. See US, Canada, Japan, Taiwan, India, Brazil, and the global comparison.
Data: TradingStudio (FMP earnings data). Event study uses earnings_surprises + stock_eod + key_metrics tables with market cap > TWD 10B filter applied at the time of each event. Abnormal returns computed vs SPY, a US benchmark, so every CAR here is a Taiwan-minus-US spread in USD. The miss-streak mirror leg was computed 2026-08-29 against ^TWII and passes; see Limitations. FMP data limitations: analyst estimate coverage varies by exchange and time period, estimate quality may be lower for smaller companies, and historical records for TAI/TWO are less complete than for US exchanges. Beat streaks depend on estimate availability. Past performance does not guarantee future results. This is educational content, not investment advice.
References
- Loh, R. & Warachka, M. (2012). "Streaks in Earnings Surprises and the Cross-Section of Stock Returns." Management Science, 58(7), 1305–1321.
- Myers, L., Myers, J. & Skinner, D. (2007). "Earnings Momentum and Earnings Management." Journal of Accounting, Auditing & Finance, 22(2), 249–284.

