
Cash Conversion Cycle Doesn't Work as a Stock Signal (US Backtest, 2000-2025)
We tested CCC as a stock-picking signal on US equities over 25 years. Low-CCC companies returned 4.6% CAGR vs 7.3% for SPY. The spread between low and high CCC was -0.6%. An honest result that builds more credibility than another claimed 15% alpha.

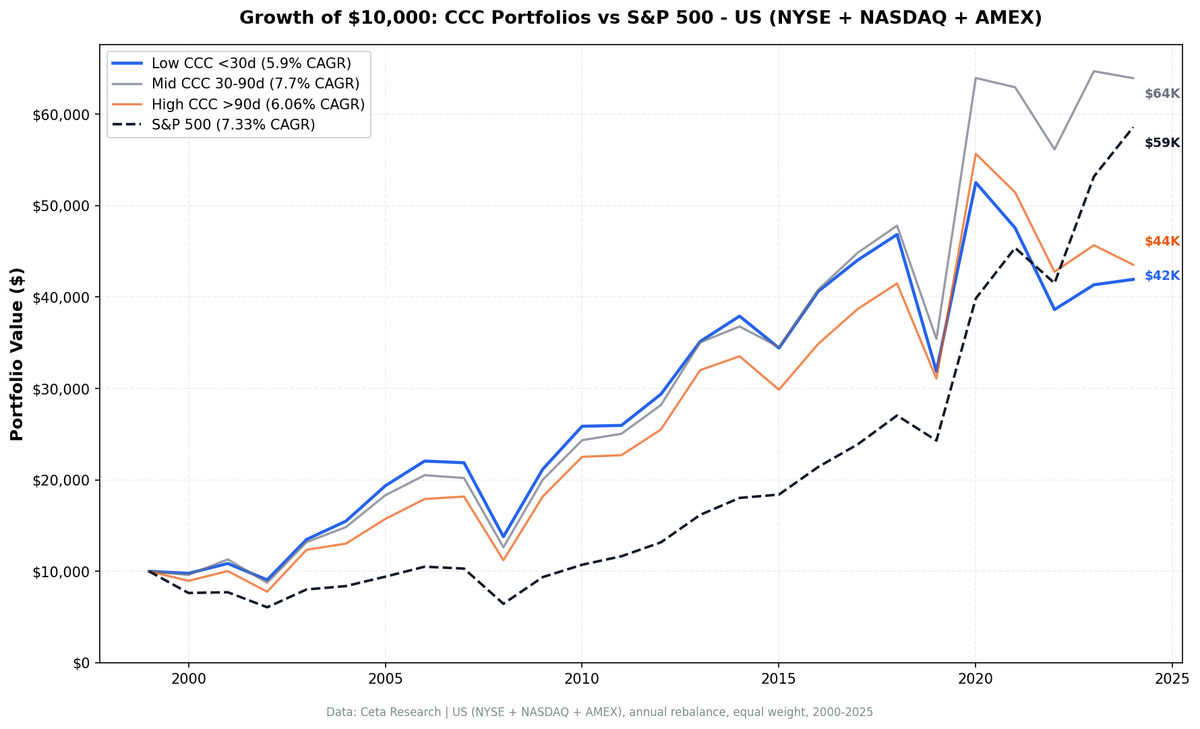
We tested whether the cash conversion cycle predicts stock returns. The theory is clean: companies that turn working capital into cash faster should outperform. Amazon's negative CCC is the poster child. Over 25 years on US stocks, the signal produced 5.9% CAGR for low-CCC companies versus 7.3% for the S&P 500. The spread between low and high CCC was -0.2%. CCC doesn't work as a standalone stock-picking factor.
Contents
- Part of a Series
- What is the Cash Conversion Cycle?
- Method
- What We Found
- Low + Decreasing CCC: Modest Improvement
- Relative to SPY
- Decade Breakdown: No Consistent Edge
- Why CCC Fails as a Standalone Signal
- Run It Yourself
- Simple Screen: Low CCC Companies
- Advanced Screen: Low CCC + Strong Margins
- Limitations
- Takeaway
- References
This is an honest "it barely works" result. The signal shows marginal improvement once execution is corrected, but still underperforms the index.
Data: FMP financial data warehouse, 2000–2025. Updated April 2026.
Part of a Series
This is the flagship US post in a multi-exchange CCC study:
- US (this post): 5.9% CAGR, -0.2% spread
- Cash Conversion Cycle: India -- weak +0.3% spread, -3.7% vs Sensex
- Cash Conversion Cycle: Canada -- best developed-market result, +3.2% spread
- Cash Conversion Cycle: 13-Exchange Comparison -- 5 positive spreads, 6 negative
What is the Cash Conversion Cycle?
The cash conversion cycle measures how many days a company takes to convert working capital investments into cash. The formula:
CCC = DSO + DIO - DPO
Three components:
Days Sales Outstanding (DSO): How long customers take to pay after a sale. Lower is better. A DSO of 45 means you wait 45 days to collect.
Days Inventory Outstanding (DIO): How long inventory sits before being sold. Lower is better. A DIO of 60 means products sit in the warehouse for two months.
Days Payables Outstanding (DPO): How long the company takes to pay its suppliers. Higher is better (from the company's side). A DPO of 90 means holding onto cash for three months before paying.
A company with DSO of 30, DIO of 40, and DPO of 80 has a CCC of -10 days. It collects cash from customers before paying suppliers. Amazon has run a negative CCC for over a decade. Dell pioneered the model in the 1990s with build-to-order manufacturing.
The academic case is straightforward. Richards and Laughlin (1980) introduced CCC as a liquidity measure. Shin and Soenen (1998) found shorter CCC correlates with higher profitability. Deloof (2003) confirmed the link between working capital efficiency and firm value. If short CCC means better operations and higher profitability, it should predict stock returns.
We tested that claim.
Method
| Parameter | Value |
|---|---|
| Universe | NYSE, NASDAQ, AMEX |
| Market cap | > $1B |
| Exclusions | Financial Services |
| Rebalancing | Annual (April 1) |
| Holding period | 12 months |
| Weighting | Equal weight, all qualifying stocks |
| Filing lag | 45 days (point-in-time) |
| Transaction costs | 0.1-0.5% per trade (size-tiered) |
| Benchmark | S&P 500 (SPY) |
| Period | 2000-2025 |
| Data source | FMP via Ceta Research warehouse |
| Portfolios | Low CCC (<30 days), Mid (30-90), High (>90), Low+Decreasing |
Code is open source: github.com/ceta-research/backtests
What We Found
The short answer: CCC level doesn't separate winners from losers on US stocks.
| Metric | Low CCC (<30d) | Mid CCC (30-90d) | High CCC (>90d) | SPY |
|---|---|---|---|---|
| CAGR | 5.9% | 7.7% | 6.1% | 7.3% |
| Volatility | 23.8% | 25.5% | 26.9% | 21.1% |
| Sharpe Ratio | 0.164 | 0.223 | 0.151 | 0.253 |
| Max Drawdown | -37.5% | -38.4% | -38.3% | -39.3% |
| Avg Stocks | 492 | 450 | 345 | -- |
The low-CCC portfolio returned 5.9% annually. SPY returned 7.3%. The spread between low and high CCC was -0.2%, meaning high-CCC companies did marginally better than low-CCC ones.
All three CCC portfolios had worse Sharpe ratios than SPY. The volatility was higher and the returns were lower. This isn't a "noisy but positive" signal. It's flat to marginally negative.
Low + Decreasing CCC: Modest Improvement
We also tested combining low CCC level with year-over-year improvement (decreasing CCC). The theory: companies that already have short cycles and are still getting more efficient should be the cream of the crop.
The result: 5.7% CAGR with 23.4% volatility and -37.9% max drawdown. Average portfolio size increased to 270 stocks with next-day execution. Still behind SPY, but a similar profile to the raw low-CCC portfolio.
Relative to SPY
| Metric | Low CCC vs SPY |
|---|---|
| Excess CAGR | -1.43% |
| Up Capture | 94.4% |
| Down Capture | 104.2% |
| Beta | 0.991 |
| Alpha | -1.38% |
The low-CCC portfolio captured 94.4% of SPY's upside while absorbing 104.2% of its downside. The alpha is negative at -1.38%. A slightly better profile than earlier runs, but still not enough to justify the strategy.
Decade Breakdown: No Consistent Edge
| Period | Low CCC | High CCC | Spread | SPY |
|---|---|---|---|---|
| 2000-04 | 11.2% | 8.7% | +2.5% | -1.4% |
| 2005-09 | 10.9% | 12.0% | -1.0% | 5.9% |
| 2010-14 | 12.6% | 13.4% | -0.8% | 14.1% |
| 2015-19 | -1.7% | -0.2% | -1.5% | 6.6% |
| 2020-25 | 9.0% | 11.3% | -2.3% | 21.5% |
The only period with a positive spread was 2000-2004. After the dot-com crash, capital-efficient companies had an edge. Every period since has been negative. The 2020-2025 period shows a -2.3% spread while SPY returned 21.5%.
Two observations stand out:
The 2000s were different. Low CCC had a slight edge in the early period when capital efficiency mattered more. Credit was tighter, interest rates were higher, and companies that managed working capital well had a real funding advantage.
The 2010s and 2020s killed it. Cheap money, QE, and growth-at-any-cost investing meant the market didn't reward working capital discipline. Companies with long cash cycles (think high-growth tech burning cash on R&D) outperformed companies running tight ships. The market paid for growth, not efficiency.
Why CCC Fails as a Standalone Signal
Three structural reasons:
1. Sector contamination. Low CCC is dominated by tech and services companies (low inventory, fast collection). High CCC skews toward manufacturing and industrials. You're not comparing operational efficiency within sectors. You're comparing sectors against each other. And whether tech or industrials outperform has nothing to do with CCC.
2. CCC is priced in. Unlike obscure accounting signals, CCC components (receivables, inventory, payables) are in every quarterly report. Analysts track working capital. The market adjusts for operational efficiency in real time. There's no information advantage in screening for something everyone already watches.
3. The best CCC companies don't need this screen. Amazon, Apple, Costco, Dell. These are the poster children for negative CCC. They're also mega-caps that dominate index returns already. A CCC screen just gives you index exposure with more steps.
Run It Yourself
Simple Screen: Low CCC Companies
SELECT k.symbol, p.companyName,
    k.cashConversionCycleTTM AS ccc_days,
    k.daysOfSalesOutstandingTTM AS dso,
    k.daysOfInventoryOutstandingTTM AS dio,
    k.daysOfPayablesOutstandingTTM AS dpo,
    k.marketCap / 1e9 AS market_cap_b
FROM key_metrics_ttm k
JOIN profile p ON k.symbol = p.symbol
WHERE k.cashConversionCycleTTM < 30
  AND k.marketCap > 1000000000
  AND p.sector NOT IN ('Financial Services')
ORDER BY k.cashConversionCycleTTM ASC
LIMIT 50
Run it: cetaresearch.com/data-explorer?q=7BdH5pW-Z1
Advanced Screen: Low CCC + Strong Margins
SELECT k.symbol, p.companyName,
    k.cashConversionCycleTTM AS ccc_days,
    f.operatingProfitMarginTTM * 100 AS op_margin_pct,
    k.marketCap / 1e9 AS market_cap_b
FROM key_metrics_ttm k
JOIN financial_ratios_ttm f ON k.symbol = f.symbol
JOIN profile p ON k.symbol = p.symbol
WHERE k.cashConversionCycleTTM < 30
  AND f.operatingProfitMarginTTM > 0.10
  AND k.marketCap > 1000000000
  AND p.sector NOT IN ('Financial Services')
ORDER BY k.cashConversionCycleTTM ASC
LIMIT 30
Run it: cetaresearch.com/data-explorer?q=OrGmtOsJIk
The margin filter helps in practice even though the backtest signal is weak. Combining CCC with operating margin above 10% filters out razor-thin-margin businesses (grocery, airlines) that have low CCC but poor economics.
Limitations
Sector bias dominates. The portfolios are implicitly sector bets. Low CCC overweights tech and services. High CCC overweights manufacturing. Sector-relative CCC would be a fairer test, but it's harder to implement and the universe shrinks.
Equal weight across 300-500 stocks. These are broad portfolios, not concentrated picks. The signal, if it exists, gets diluted across hundreds of names. A tighter screen (top 30 by CCC) might produce different results, but also introduces more noise.
Transaction costs are modeled but conservative. Size-tiered at 0.1-0.5%. Annual rebalancing keeps turnover low, so costs don't explain the underperformance.
CCC doesn't apply to financials. We excluded Financial Services, but CCC is also meaningless for utilities, REITs, and some healthcare subsectors. A stricter exclusion list might change results marginally.
Single factor. CCC alone isn't how practitioners use it. It's typically a quality overlay alongside ROIC, margins, or balance sheet health. The standalone test is intentionally simplistic to isolate the signal.
Takeaway
CCC is a useful operational metric. It tells you something real about how a company manages working capital. But on US stocks from 2000 to 2025, it doesn't predict returns reliably. The low-CCC portfolio returned 5.9% versus 7.3% for SPY. The spread between low and high CCC was -0.2%. Adding a decreasing-CCC filter produced similar results (5.7% CAGR).
The academic papers are right that shorter CCC correlates with profitability. They're not right that profitability from working capital efficiency translates into stock returns. The market prices this information efficiently.
Use CCC as a quality overlay, not a primary signal. It pairs well with ROIC screens and margin analysis. A company with high ROIC, expanding margins, and a short CCC is running a good business. But the CCC alone won't pick stocks for you.
References
- Richards, V.D. and Laughlin, E.J. (1980). A Cash Conversion Cycle Approach to Liquidity Analysis. Financial Management.
- Shin, H.H. and Soenen, L. (1998). Efficiency of Working Capital Management and Corporate Profitability. Financial Practice and Education.
- Deloof, M. (2003). Does Working Capital Management Affect Profitability of Belgian Firms? Journal of Business Finance & Accounting.
Data: Ceta Research (FMP financial data warehouse), 2000-2025. Full methodology: github.com/ceta-research/backtests
Past performance does not guarantee future results. This is educational content, not investment advice.


