
Taiwan's 52-Week High Proximity: +4.8% vs TAIEX Over 25 Years
We tested the 52-week high proximity strategy on Taiwanese stocks (TAI) from 2000 to 2025. 9.18% CAGR, +4.80% vs TAIEX, 42.9% down capture. The signal protected hard in 2022 (-6.0% vs TAIEX -22.2%) and rode the 2023 semiconductor rally.

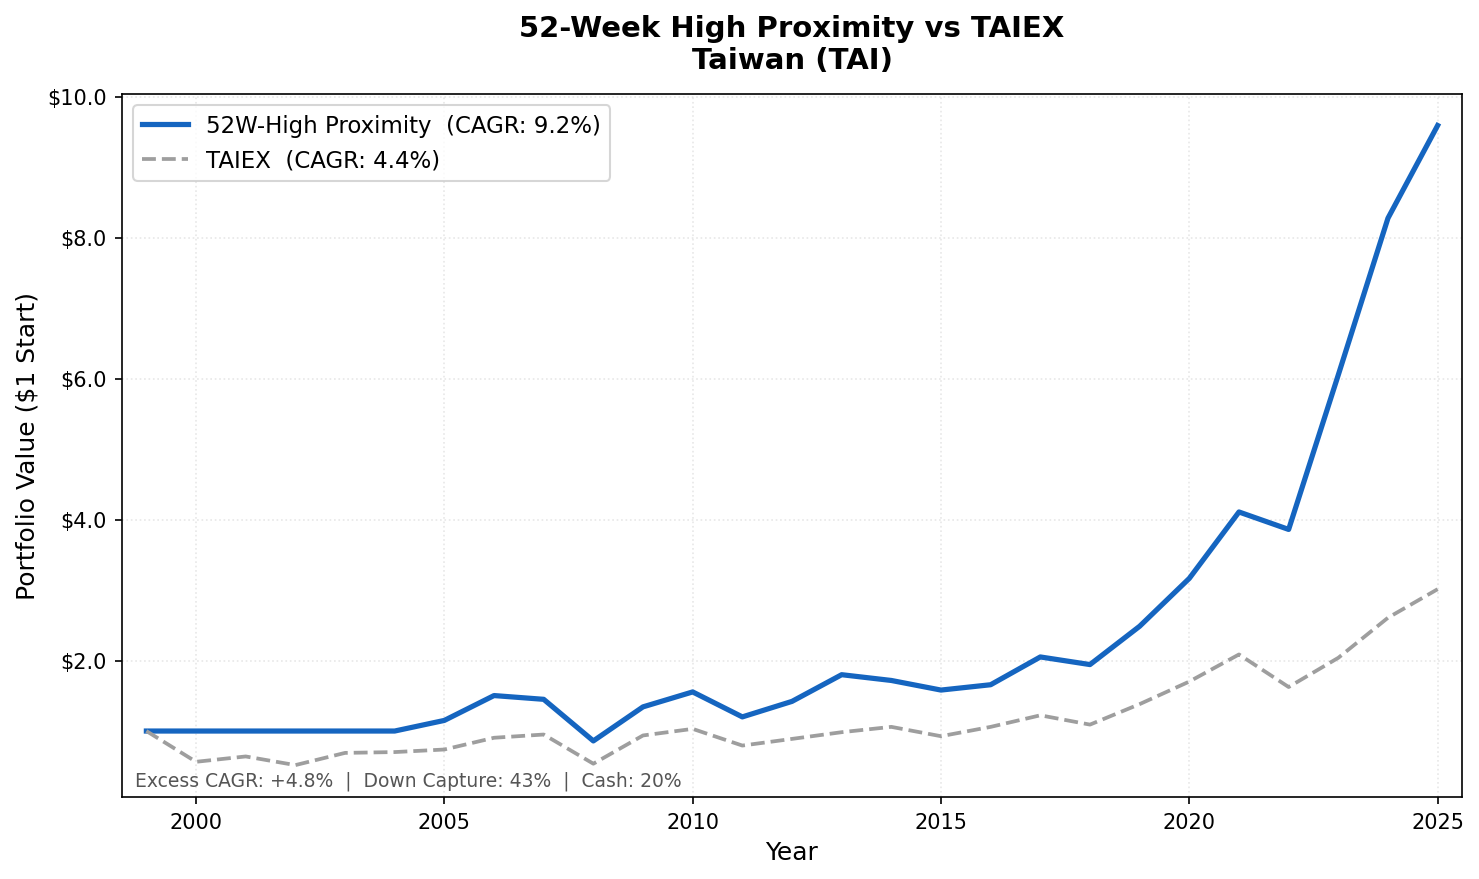
We ran the 52-week high proximity strategy on Taiwanese stocks (TAI) from 2000 to 2025. The result: 9.18% annualized, +4.80% above the TAIEX, 42.9% down capture. A NT$1 investment grew to NT$9.59. The TAIEX returned NT$3.01 over the same period.
Contents
- Method
- What is the 52-Week High Proximity Strategy?
- What We Found
- 9.18% CAGR. +4.80% vs TAIEX. 42.9% down capture.
- Year-by-Year Returns
- 2000-2004: five years of cash
- 2008: protection in the crisis, then a strong rebound
- 2022: the definitive protection year
- 2023: riding the semiconductor cycle
- Why Anchoring Works in Taiwan
- Limitations
- Run This Screen Yourself
- Part of a Series
- References
Taiwan is one of the cleaner second-tier results in this strategy's global comparison. The excess return is solid, the Sharpe is respectable, and the down capture is among the better readings outside the top retail markets. The signal protected hard in 2022 and rode the semiconductor cycle in 2023.
Data: FMP financial data warehouse, 2000-2025. Updated June 2026.
Method
Data source: Ceta Research (FMP financial data warehouse) Universe: TAI (Taiwan Stock Exchange), market cap > NT$10B Period: 2000-2025 (25 years, 103 quarterly periods) Rebalancing: Quarterly (January, April, July, October), equal weight Execution: Next-day close (MOC) Benchmark: TAIEX (TWD, local currency comparison) Returns: Calculated in TWD; benchmark in TWD Cash rule: Hold cash if fewer than 10 stocks qualify
The signal is the proximity ratio: current price divided by the 52-week high (rolling 252 trading days). Stocks are ranked by proximity ratio and the top 30 are held each quarter.
Note on benchmarking: Returns are in TWD, same currency as the portfolio. Comparing to the TAIEX enables an honest same-currency benchmark. Cross-currency comparison to SPY would include currency effects.
What is the 52-Week High Proximity Strategy?
George and Hwang (2004) showed that stocks trading near their 52-week high outperform stocks far from it. The mechanism is anchoring bias. Investors treat the 52-week high as a psychological ceiling. When a stock approaches it, selling pressure builds from investors who expect resistance. That pressure keeps the price below fundamental value temporarily. When news or earnings push the stock past the anchor, the discount corrects sharply.
Proximity ratio = adjClose / MAX(high over 252 trading days)
A ratio of 1.0 means the stock is at its 52-week high. We select the top 30 stocks by this ratio, closest to their annual peak, and hold them equal weight for one quarter.
What We Found
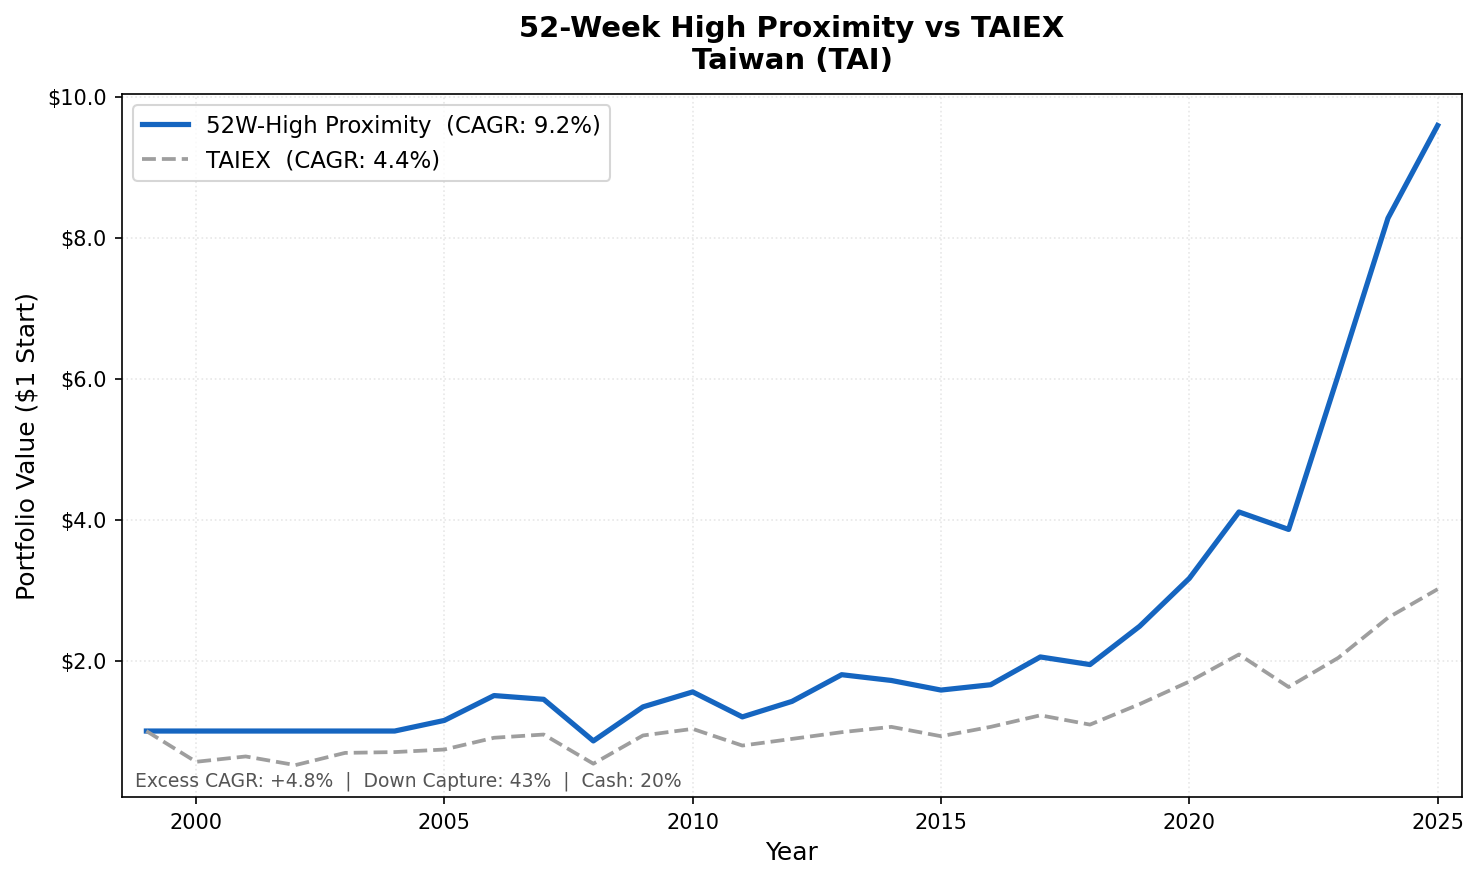
9.18% CAGR. +4.80% vs TAIEX. 42.9% down capture.
| Metric | 52-Week High Taiwan | TAIEX |
|---|---|---|
| CAGR | 9.18% | 4.38% |
| Excess Return | +4.80% | - |
| Total Return | NT$9.59 per NT$1 | NT$3.01 per NT$1 |
| Max Drawdown | -49.92% | -65.25% |
| Sharpe Ratio | 0.444 | 0.138 |
| Sortino Ratio | 0.777 | - |
| Calmar Ratio | 0.184 | - |
| Up Capture | 77.04% | - |
| Down Capture | 42.93% | - |
| Cash Periods | 20.4% of quarters | - |
| Avg Stocks (invested) | 30.0 | - |
| Win Rate | 53.4% | - |
The +4.80% excess vs the TAIEX over 25 years is meaningful alpha for a pure price signal. The Sharpe of 0.444 versus the TAIEX's 0.138 shows the strategy generates far more return per unit of risk than the local benchmark.
The 42.9% down capture is the standout. When the TAIEX fell, this portfolio absorbed under half the decline. The max drawdown of -49.9% is much better than the TAIEX's -65.3%, reflecting the signal's tendency to rotate out of stocks as they fall from their highs.
The win rate of 53.4% is modestly above half. The edge comes from the combination of a slim batting-average advantage and the asymmetry between wins and losses.
Year-by-Year Returns
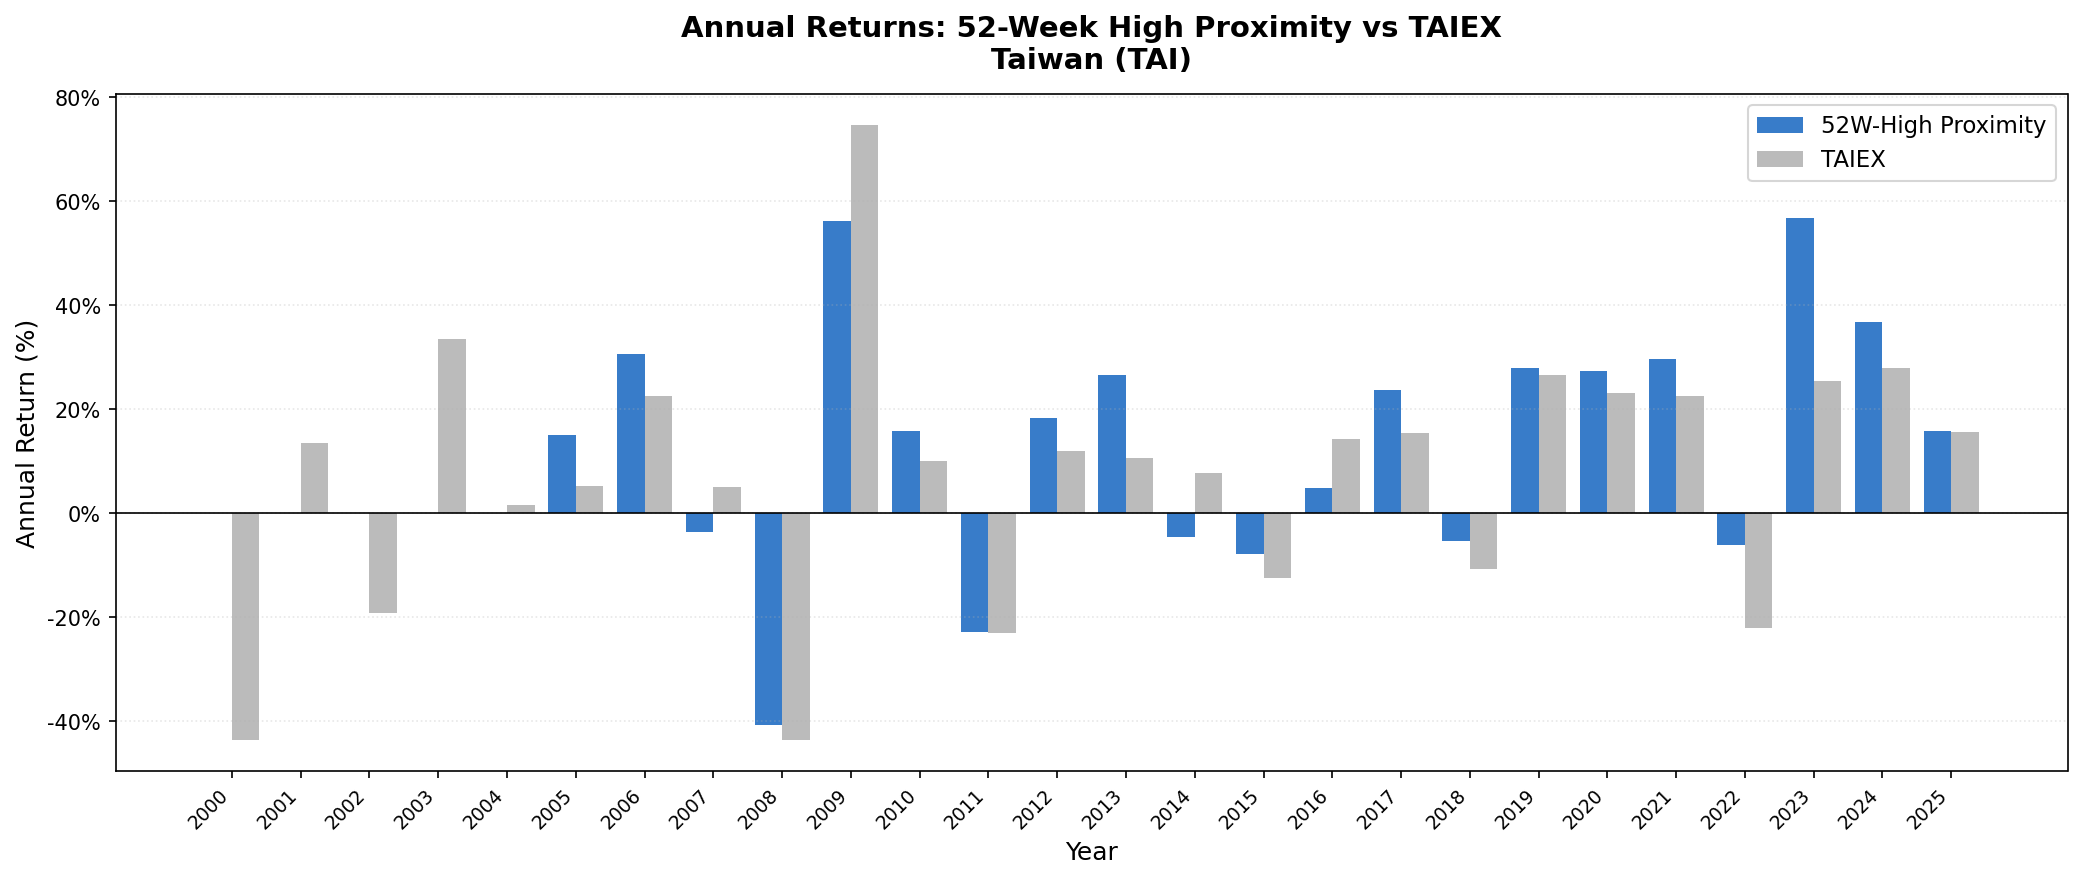
| Year | Taiwan Strategy | TAIEX | Excess |
|---|---|---|---|
| 2000 | 0.0% (cash) | -43.6% | n/a |
| 2001 | 0.0% (cash) | +13.5% | n/a |
| 2002 | 0.0% (cash) | -19.2% | n/a |
| 2003 | 0.0% (cash) | +33.5% | n/a |
| 2004 | 0.0% (cash) | +1.7% | n/a |
| 2005 | +15.1% | +5.2% | +9.9% |
| 2006 | +30.6% | +22.6% | +8.1% |
| 2007 | -3.5% | +5.1% | -8.6% |
| 2008 | -40.7% | -43.6% | +2.9% |
| 2009 | +56.2% | +74.7% | -18.5% |
| 2010 | +15.8% | +10.0% | +5.8% |
| 2011 | -22.8% | -23.0% | +0.2% |
| 2012 | +18.3% | +11.9% | +6.4% |
| 2013 | +26.7% | +10.7% | +15.9% |
| 2014 | -4.6% | +7.7% | -12.2% |
| 2015 | -7.9% | -12.5% | +4.6% |
| 2016 | +4.8% | +14.3% | -9.5% |
| 2017 | +23.8% | +15.5% | +8.3% |
| 2018 | -5.3% | -10.8% | +5.5% |
| 2019 | +28.0% | +26.7% | +1.3% |
| 2020 | +27.3% | +23.2% | +4.2% |
| 2021 | +29.8% | +22.6% | +7.1% |
| 2022 | -6.0% | -22.2% | +16.1% |
| 2023 | +56.8% | +25.5% | +31.3% |
| 2024 | +36.7% | +27.9% | +8.8% |
| 2025 | +15.9% | +15.5% | +0.4% |
2000-2004: five years of cash
Taiwan's market had too few stocks near their 52-week highs for the signal to fire through the dot-com bust and its aftermath. The TAIEX fell 43.6% in 2000 and 19.2% in 2002. The strategy sat those out in cash, but it also missed the 2003 recovery (+33.5%). When recovery comes from deeply depressed levels, stocks are far from their highs, and a proximity screen does not fire.
2008: protection in the crisis, then a strong rebound
2008 was -40.7% for the strategy versus the TAIEX's -43.6%, a modest cushion in a brutal year. 2009 rebounded +56.2% but trailed the TAIEX's +74.7%, the familiar pattern where deep-value recoveries are led by stocks far from their highs.
2022: the definitive protection year
2022 is the clearest demonstration of the signal's downside discipline. As global rate hikes hammered technology valuations, the TAIEX fell 22.2%. The Taiwan strategy lost only 6.0%, a 16.1 percentage point cushion. The proximity filter held the subset of Taiwanese companies maintaining relative strength while the broad index repriced.
2023: riding the semiconductor cycle
2023 was the standout: +56.8% against the TAIEX's +25.5%, a 31.3 percentage point edge. Taiwan's semiconductor and AI-supply-chain names broke to new highs as global demand surged, and the proximity screen was positioned in exactly those leaders.
Why Anchoring Works in Taiwan
Taiwan's equity market has high retail participation, consistent with the other Asia-Pacific markets where this signal works best. Individual investors anchor to visible price levels, and the 52-week high is the most watched of them.
Taiwan's market is also dominated by a technology and semiconductor complex with clear leadership cycles. When that complex is trending, a handful of names break to new highs together, and the proximity signal concentrates there. The 20.4% cash periods reflect the flip side: when the cycle turns down, few stocks stay near their highs and the screen steps back to cash.
Limitations
Currency risk. Returns are in TWD. TWD/USD fluctuations matter for international investors, though domestic investors wouldn't face this.
Cash periods miss recoveries. Five cash years from 2000 to 2004 meant sitting out the TAIEX's 2003 rebound (+33.5%). The signal protects in bad environments but lags in uneven recoveries.
Sector concentration. Taiwan's index leadership is heavily semiconductor-weighted. When that complex corrects, the high-proximity list corrects with it. The +4.80% excess comes with real cyclical exposure.
Survivorship bias. Companies that delisted during the 25-year period aren't fully tracked. Historical drawdowns are likely understated somewhat.
Run This Screen Yourself
Current 52-week high proximity screen (Taiwanese stocks):
WITH price_window AS (
    SELECT
        symbol,
        TRY_CAST(date AS DATE) AS trade_date,
        adjClose,
        high,
        dateEpoch,
        MAX(high) OVER (
            PARTITION BY symbol ORDER BY dateEpoch
            ROWS BETWEEN 251 PRECEDING AND CURRENT ROW
        ) AS high_52w,
        COUNT(*) OVER (
            PARTITION BY symbol ORDER BY dateEpoch
            ROWS BETWEEN 251 PRECEDING AND CURRENT ROW
        ) AS row_count
    FROM stock_eod
    WHERE TRY_CAST(date AS DATE) >= CURRENT_DATE - INTERVAL '14' MONTH
      AND adjClose > 0 AND high > 0
),
latest AS (
    SELECT symbol, adjClose, high_52w
    FROM price_window
    WHERE trade_date >= CURRENT_DATE - INTERVAL '10' DAY
      AND high_52w > 0 AND row_count >= 100
    QUALIFY ROW_NUMBER() OVER (PARTITION BY symbol ORDER BY dateEpoch DESC) = 1
)
SELECT
    l.symbol,
    p.companyName,
    p.sector,
    ROUND(l.adjClose / l.high_52w, 4) AS proximity_ratio,
    ROUND(p.marketCap / 1e9, 2) AS mktcap_bn_twd
FROM latest l
JOIN profile p ON l.symbol = p.symbol
WHERE p.exchange = 'TAI'
  AND p.marketCap > 10000000000
ORDER BY proximity_ratio DESC
LIMIT 30
Run this screen on Ceta Research
The full backtest code (Python + DuckDB) is on GitHub.
Part of a Series
This post is part of our 52-week high proximity global exchange comparison:
- India (NSE): 19.0% CAGR, +7.8% vs Sensex
- Korea (KSC): 12.1% CAGR, +7.3% vs KOSPI
- Japan (JPX): 8.4% CAGR, +5.0% vs Nikkei
- Global Comparison: 52-Week High Proximity Across Exchanges
References
- George, T. & Hwang, C. (2004). "The 52-Week High and Momentum Investing." Journal of Finance, 59(5), 2145-2176.
- Jegadeesh, N. & Titman, S. (1993). "Returns to Buying Winners and Selling Losers: Implications for Stock Market Efficiency." Journal of Finance, 48(1), 65-91.
Data: Ceta Research (FMP financial data warehouse). Universe: TAI, market cap > NT$10B. Quarterly rebalance, equal weight, next-day close execution, transaction costs included, 2000-2025. Returns in TWD, benchmark TAIEX.
Past performance does not guarantee future results. This is educational content, not investment advice.

