
Cyclical Sector Timing in Canada: Lowest Down Capture of All 15

Cyclical Sector Timing in Canada: A Paradox in the Data
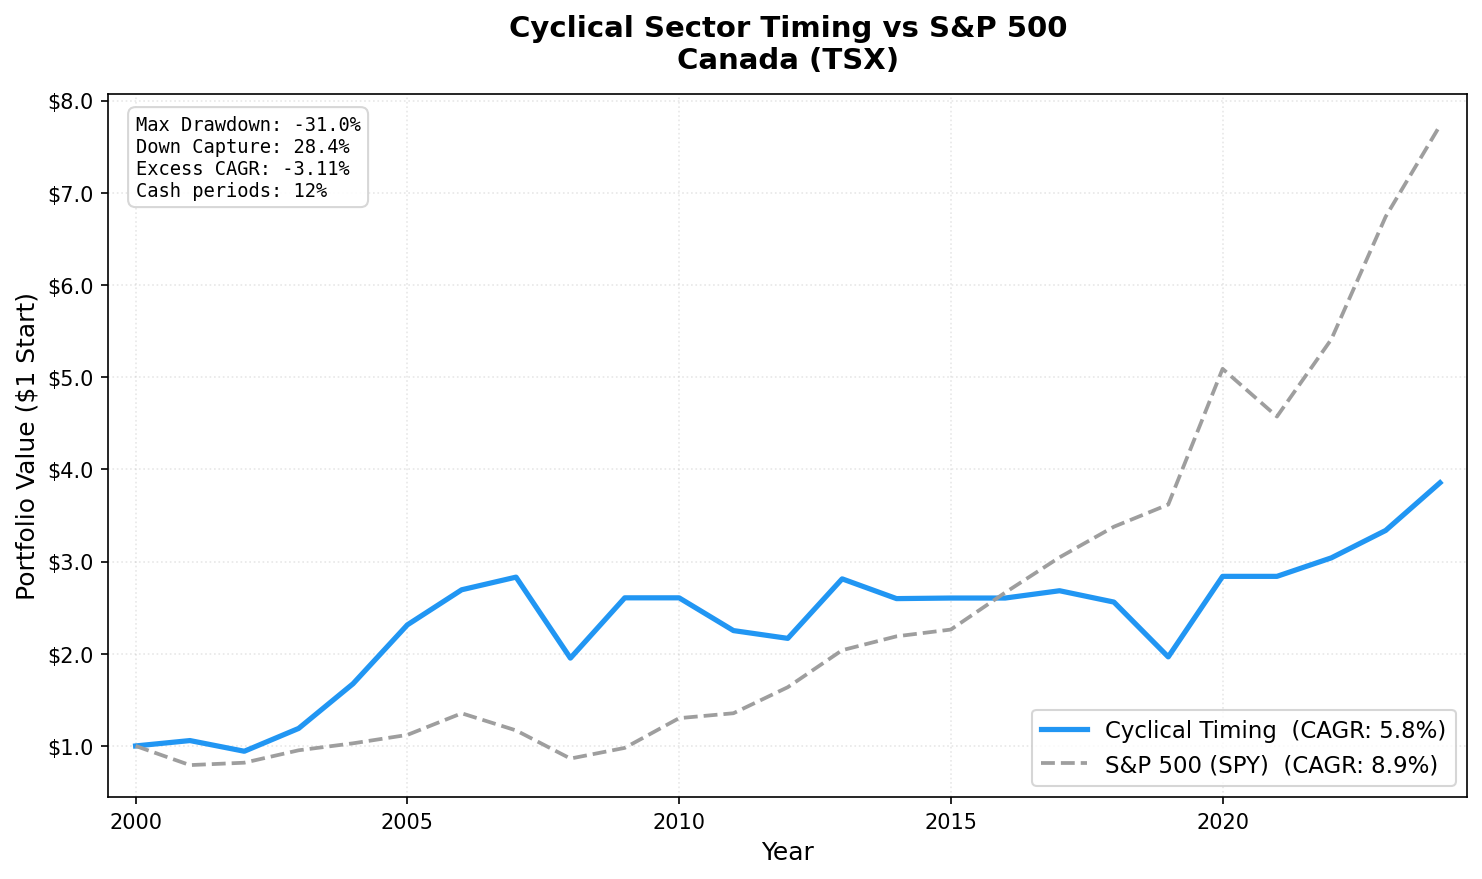
Canada has the lowest down capture of any market in the study. 28.4%. When global markets fall, this Canadian cyclical portfolio loses less than any other exchange we tested, including defensive markets.
Contents
But the CAGR is the weakest among dedicated markets: 5.78%, a -3.11% shortfall vs SPY over 24 years.
That combination of excellent downside protection and poor long-term compounding is the Canadian paradox. The explanation is energy sector concentration.
Method
| Parameter | Value |
|---|---|
| Universe | TSX (Toronto Stock Exchange) |
| Sectors | Basic Materials, Industrials, Energy, Consumer Cyclical |
| Signal | ≥ 50% of cyclical stocks with positive YoY FY revenue growth |
| Selection | Top 30 by ROE, among stocks with positive revenue growth AND ROE ≥ 5% |
| Rebalancing | Annual (July) |
| Period | 2001–2024 |
| Cash periods | 3 of 24 (12%) |
| Avg stocks | 25.8 |
| Benchmark | S&P 500 Total Return (SPY) |
Full methodology: backtests/METHODOLOGY.md US flagship blog (methodology + SQL): blog.tradingstudio.finance/cyclical-sector-timing-us-backtest
Results
| Metric | Portfolio | S&P 500 |
|---|---|---|
| CAGR (2001–2024) | 5.78% | 8.89% |
| Excess CAGR | -3.11% | — |
| Max drawdown | -31.03% | -36.27% |
| Sharpe ratio | 0.166 | — |
| Beta | 0.598 | 1.0 |
| Down capture | 28.39% | 100% |
| Up capture | 64.39% | 100% |
| Cash periods | 3 of 24 | — |
| Avg stocks held | 25.8 | — |
The down capture of 28.39% is the story. No other market (not India with its -0.6% down capture, not Germany, not the UK) lost so little relative to the market in down years. The cash periods (2010, 2016, 2021) helped, but the effect is present even in invested years.
The problem: 64.39% up capture. The strategy captures two-thirds of the market's up moves when invested. That combination, good downside protection but capped upside, suppresses long-term compounding. Over 24 years, the math catches up.
Why Canada Is Different: Energy Sector Concentration
Canadian cyclical stocks are dominated by energy: oil sands, Alberta producers, natural gas companies. The TSX energy sector includes companies that operate at meaningfully different cost structures than US energy names. Oil sands breakeven costs are higher. Revenue growth tracks oil prices with high sensitivity.
The pattern is clear in the boom-bust returns:
Oil boom (2004-2005): | Year | Portfolio | |------|-----------| | 2004 | +40.7% | | 2005 | +38.1% |
WTI crude oil rose from ~$32/barrel to ~$60/barrel over this period. Canadian oil sands producers posted explosive revenue growth. The ROE screen captured the efficient operators. Two consecutive ~40% years.
Oil crash (2008, 2019): | Year | Portfolio | |------|-----------| | 2008 | -31.0% | | 2019 | -23.2% |
The 2008 oil price collapse from $147 to $35/barrel decimated Canadian energy revenue. -31.0% in one year.
2019 was the other major oil collapse year. WTI fell below $55/barrel on oversupply and pipeline capacity constraints in Alberta. Canadian energy companies posted negative revenue growth. -23.2% with SPY up +7.1%.
The signal times these cycles correctly. It's invested during expansions and in cash during contractions, but it can't escape the underlying energy sector volatility when invested.
Full Annual Returns
| Year | Portfolio | SPY | Excess |
|---|---|---|---|
| 2001 | +5.8% | -20.8% | +26.6% |
| 2002 | -10.9% | +3.3% | -14.2% |
| 2003 | +26.3% | +16.4% | +9.9% |
| 2004 | +40.7% | +7.9% | +32.8% |
| 2005 | +38.1% | +8.9% | +29.2% |
| 2006 | +16.5% | +20.9% | -4.4% |
| 2007 | +5.1% | -13.7% | +18.8% |
| 2008 | -31.0% | -26.1% | -4.9% |
| 2009 | +33.5% | +13.4% | +20.1% |
| 2010 | 0.0% (CASH) | +32.9% | — |
| 2011 | -13.6% | +4.1% | -17.7% |
| 2012 | -3.8% | +20.9% | -24.7% |
| 2013 | +29.8% | +24.5% | +5.3% |
| 2014 | -7.6% | +7.4% | -15.0% |
| 2015 | +0.2% | +3.4% | -3.2% |
| 2016 | 0.0% (CASH) | +17.7% | — |
| 2017 | +3.0% | +14.3% | -11.3% |
| 2018 | -4.6% | +10.9% | -15.5% |
| 2019 | -23.2% | +7.1% | -30.3% |
| 2020 | +44.4% | +40.7% | +3.7% |
| 2021 | 0.0% (CASH) | -10.2% | — |
| 2022 | +7.1% | +18.3% | -11.2% |
| 2023 | +9.8% | +24.6% | -14.8% |
| 2024 | +15.5% | +14.7% | +0.8% |
Limitations
Energy concentration risk. The TSX cyclical universe has higher energy sector weight than any other market in the study. This creates single-commodity exposure (crude oil) that dominates annual returns.
Currency. Returns are in CAD. USD/CAD fluctuations (which correlate with oil prices) affect USD-equivalent returns.
The low-CAGR trap. Despite excellent down capture, the 64.39% up capture creates a structural drag. An investor who holds this strategy for 24 years ends up with less capital than SPY, despite having less stress during downturns.
The 2010 miss. Holding cash during SPY's +32.9% year was the single biggest CAGR drag. The signal flagged contraction correctly from a revenue standpoint, but the market recovered faster than fundamental data confirmed.
Data: Ceta Research (FMP financial data warehouse). Universe: TSX cyclical sectors. Period: 2001-2024, annual rebalance (July). Past performance doesn't guarantee future results. This is educational content, not investment advice.


