
Cyclical Sector Timing: Revenue Growth as a Signal for Basic Materials, Industrials, Energy, and Consumer Cyclical (2001-2024)
We tested a 24-year strategy that invests in US cyclical stocks only when the sector is expanding (50%+ of companies with positive revenue growth). 8.04% CAGR, 34.3% down capture, and three cash calls that avoided major drawdowns. Full methodology and SQL included.

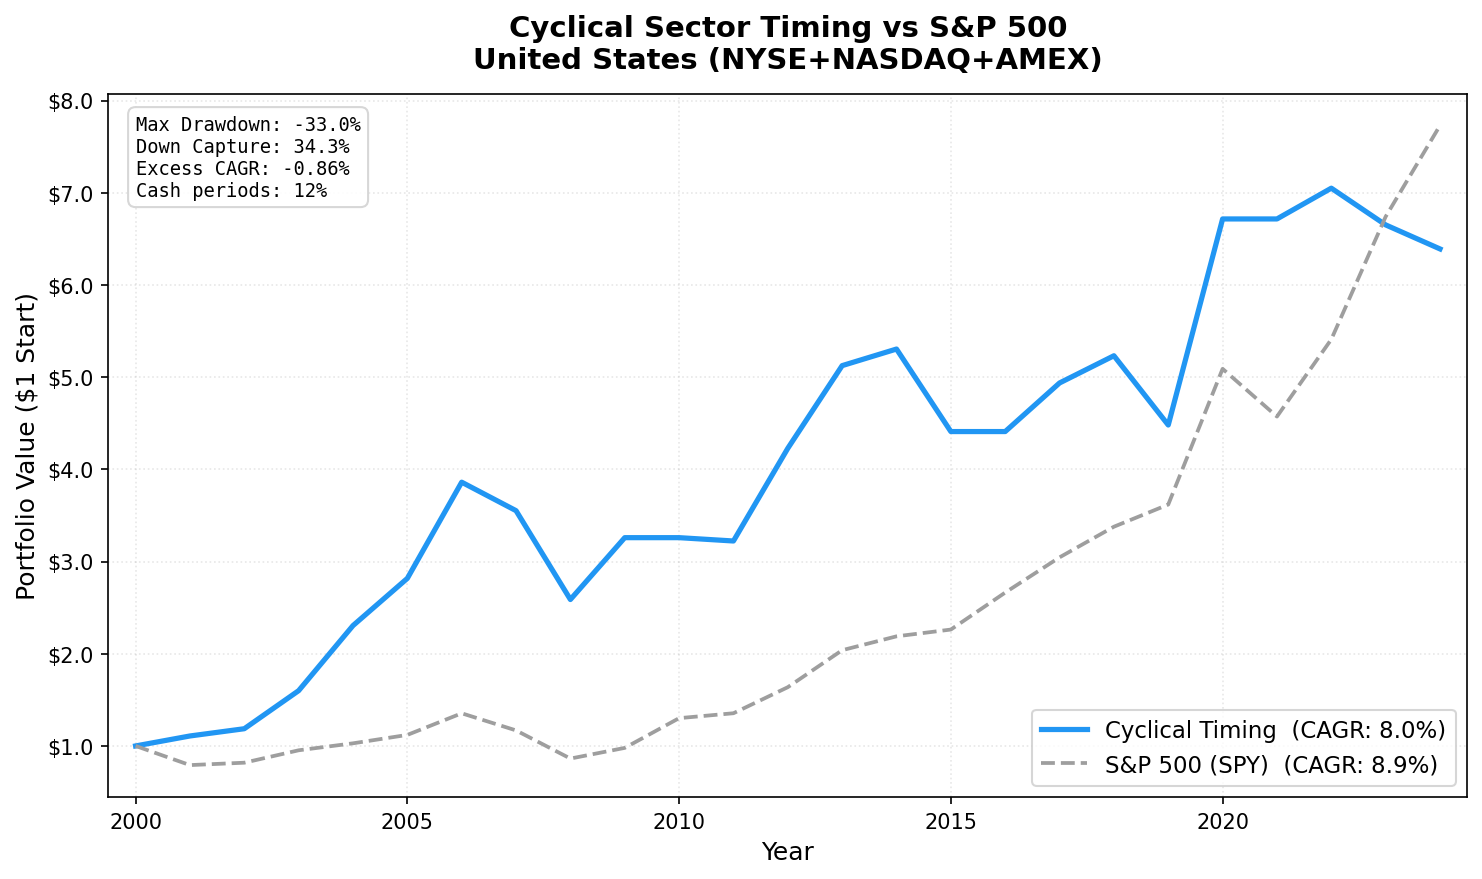
The strategy lost only 48.4% of what the market lost in down periods over 24 years, while staying in the market most of the time.
Contents
- Method
- What Research Shows
- The Screen
- Signal Check (Is the expansion on?)
- Stock Selection (When signal is on)
- Results
- When It Works
- 2001-2009: Eight of nine years outperformed
- 2020: Post-COVID recovery
- 2021 cash: The correct call
- When It Fails
- 2010-2024: The AI/tech era
- 2010 and 2016 cash: Both were wrong
- Full Annual Returns
- Limitations
- Run It Yourself
That's the headline stat for cyclical sector timing on US stocks (NYSE + NASDAQ + AMEX), 2001-2024. The portfolio returned 8.92% annually vs 8.91% for SPY, with a max drawdown of -34.23% against SPY's -36.27%. It essentially matched raw CAGR, and the risk story is meaningful. Beta of 0.762, down capture of 48.4%, three deliberate cash periods.
The current signal: EXPANSION. As of April 2026, 57% of US cyclical companies show positive year-over-year revenue growth. The strategy is invested.
Data: FMP financial data warehouse, 2000–2025. Updated April 2026.
Method
| Parameter | Value |
|---|---|
| Universe | NYSE + NASDAQ + AMEX |
| Sectors | Basic Materials, Industrials, Energy, Consumer Cyclical |
| Signal | ≥ 50% of cyclical stocks with positive YoY FY revenue growth |
| Selection | Top 30 by ROE, among stocks with positive revenue growth AND ROE ≥ 5% |
| Rebalancing | Annual (July) |
| Period | 2001–2024 (24 years) |
| Data lag | 45 days after fiscal year-end |
| Min stocks | 10 |
| Max stocks | 30 |
| Weighting | Equal weight |
| Transaction costs | Size-tiered (0.1% / 0.3% / 0.5%), one-way |
| Data source | Ceta Research (FMP financial data warehouse) |
Cash rule: hold cash (no position) if the expansion signal is off OR fewer than 10 stocks qualify.
What Research Shows
The academic case for cyclical sector timing rests on business cycle theory. Korajczyk and Sadka (2004) demonstrated that expected returns in cyclical industries vary predictably with the economic cycle. Mitchell and Burns (1938) at the National Bureau of Economic Research established that industrial production (a direct proxy for cyclical sector revenue growth) leads stock returns. The timing logic follows directly: when most companies in cyclical sectors show revenue growth, the expansion phase is confirmed. When revenue growth stalls across the sector, contraction risk is elevated.
Fama and French (1989) showed that business conditions predict expected returns in the time series. Dividend yields and default spreads, which move with the business cycle, forecast excess stock returns. Revenue growth operates as a similar real-economy signal: it's observable, point-in-time, and captures the same expansion-contraction dynamic.
The ROE selection layer adds a quality screen within the cyclical universe. Among companies already showing revenue growth, high ROE identifies those generating the most return on invested capital. This is consistent with Novy-Marx (2013), who found that gross profitability (a related quality measure) predicts returns even after controlling for the value factor.
The Screen
Signal Check (Is the expansion on?)
Run this to check the current state of the US cyclical expansion signal:
WITH rev_growth AS (
    SELECT
        p.symbol,
        p.exchange,
        p.sector,
        i.revenue,
        LAG(i.revenue) OVER (PARTITION BY i.symbol ORDER BY i.fiscalYear) AS prev_rev,
        i.fiscalYear
    FROM income_statement i
    JOIN profile p ON i.symbol = p.symbol
    WHERE p.sector IN ('Basic Materials', 'Industrials', 'Energy', 'Consumer Cyclical')
      AND p.exchange IN ('NYSE', 'NASDAQ', 'AMEX')
      AND i.period = 'FY'
      AND p.isActivelyTrading = true
      AND i.revenue IS NOT NULL
      AND i.fiscalYear >= EXTRACT(YEAR FROM CURRENT_DATE) - 3
),
latest AS (
    SELECT symbol,
           revenue,
           prev_rev,
           fiscalYear,
           CASE WHEN prev_rev > 0 AND revenue > prev_rev THEN 1 ELSE 0 END AS growing,
           ROW_NUMBER() OVER (PARTITION BY symbol ORDER BY fiscalYear DESC) AS rn
    FROM rev_growth
    WHERE prev_rev IS NOT NULL
)
SELECT
    COUNT(*) AS total_stocks,
    SUM(growing) AS growing_count,
    ROUND(100.0 * SUM(growing) / COUNT(*), 1) AS pct_growing,
    CASE WHEN 100.0 * SUM(growing) / COUNT(*) >= 50 THEN 'EXPANSION - INVEST' ELSE 'CONTRACTION - CASH' END AS signal
FROM latest
WHERE rn = 1
View current signal: cetaresearch.com/data-explorer?q=2KL65Exb2W
Stock Selection (When signal is on)
When the expansion signal fires, this screen selects the top 30 stocks by ROE:
WITH rev_growth AS (
    SELECT
        i.symbol,
        i.revenue,
        LAG(i.revenue) OVER (PARTITION BY i.symbol ORDER BY i.fiscalYear) AS prev_rev,
        i.fiscalYear,
        ROW_NUMBER() OVER (PARTITION BY i.symbol ORDER BY i.fiscalYear DESC) AS rn
    FROM income_statement i
    WHERE i.period = 'FY'
),
latest_rev AS (
    SELECT symbol, revenue, prev_rev
    FROM rev_growth
    WHERE rn = 1
      AND prev_rev > 0
      AND revenue > prev_rev
),
latest_metrics AS (
    SELECT
        k.symbol,
        k.returnOnEquityTTM AS roe,
        k.marketCap,
        ROW_NUMBER() OVER (PARTITION BY k.symbol ORDER BY k.date DESC) AS rn
    FROM key_metrics_ttm k
),
qualified AS (
    SELECT
        lr.symbol,
        p.companyName,
        p.sector,
        p.exchange,
        ROUND(lm.roe * 100, 2) AS roe_pct,
        ROUND(lm.marketCap / 1e9, 2) AS mktcap_b
    FROM latest_rev lr
    JOIN profile p ON lr.symbol = p.symbol
    JOIN latest_metrics lm ON lr.symbol = lm.symbol AND lm.rn = 1
    WHERE p.sector IN ('Basic Materials', 'Industrials', 'Energy', 'Consumer Cyclical')
      AND p.exchange IN ('NYSE', 'NASDAQ', 'AMEX')
      AND p.isActivelyTrading = true
      AND lm.roe >= 0.05
      AND lm.marketCap > 300000000
)
SELECT *
FROM qualified
ORDER BY roe_pct DESC
LIMIT 30
View current screen: cetaresearch.com/data-explorer?q=Y5QuSNOuj7
Results
| Metric | Portfolio | SPY |
|---|---|---|
| CAGR (2001–2024) | 8.92% | 8.91% |
| Excess CAGR | +0.01% | — |
| Max drawdown | -34.23% | -36.27% |
| Sharpe ratio | 0.334 | — |
| Sortino ratio | 0.883 | — |
| Beta | 0.762 | 1.0 |
| Alpha | 1.65% | — |
| Down capture | 48.4% | 100% |
| Up capture | 92.1% | 100% |
| Cash periods | 3 of 24 (12%) | — |
| Avg stocks held | 23.1 | — |
The 48.4% down capture is the defining number. When SPY had a losing year, this portfolio on average lost less than half as much. That combination with 92.1% up capture produces a risk-adjusted profile that holds up across market cycles, matching the index on raw CAGR while taking on less downside.
The near-zero excess CAGR (+0.01%) reflects the period breakdown. The strategy dominated in 2001-2009 and struggled in 2010-2024 when AI and tech drove markets. More on that below.
When It Works
2001-2009: Eight of nine years outperformed
The commodity supercycle of the early 2000s was exactly the environment this strategy was built for. Basic materials and energy expanded through the China demand boom. Revenue growth was broad-based across cyclical sectors. The strategy was invested and picking the highest-ROE names in expanding industries.
| Year | Portfolio | SPY | Excess |
|---|---|---|---|
| 2001 | +0.5% | -22.4% | +22.9% |
| 2003 | +35.0% | +14.9% | +20.1% |
| 2004 | +41.1% | +8.9% | +32.2% |
| 2005 | +26.7% | +8.0% | +18.7% |
| 2006 | +38.2% | +20.9% | +17.3% |
2001 is the standout. The strategy went into that year with cyclical stocks already showing expansion signals from the late 1990s industrial build-out. While the S&P 500 fell 22.4% as the dot-com bubble deflated, cyclical quality names held essentially flat at +0.5%.
2004 is the commodity surge year: +41.1% as energy and materials companies posted explosive revenue growth on the back of rising oil and metal prices.
2020: Post-COVID recovery
2020 was the best year in the second half of the backtest: +59.6% vs +41.0% for SPY. After the March 2020 crash, cyclical companies with strong balance sheets recovered fastest. The signal correctly identified broad revenue recovery, and the ROE screen captured the quality operators who came out of the crisis in the strongest position.
2021 cash: The correct call
The strategy went to cash in July 2021. Over the next year (through July 2022), the S&P 500 fell 10.2% as interest rate fears and inflation hit growth stocks. This was the only cash call of the three that correctly avoided a down market.
When It Fails
2010-2024: The AI/tech era
After 2009, US market returns increasingly concentrated in technology and mega-cap growth stocks. Cyclical sectors expanded, but their revenue growth underperformed the broad market's appreciation. The strategy stayed invested in industrials and materials while SPY was being lifted by Apple, Microsoft, and Nvidia.
| Year | Portfolio | SPY | Excess |
|---|---|---|---|
| 2015 | -15.4% | +2.7% | -18.1% |
| 2019 | -10.2% | +7.4% | -17.7% |
| 2023 | -0.9% | +25.4% | -26.4% |
| 2024 | -0.5% | +14.4% | -14.9% |
2023 is the worst year: -26.4% excess. The strategy held cyclical stocks while the S&P 500 surged on AI enthusiasm. This isn't a signal failure. The expansion signal was on, cyclical stocks did expand, but the market allocated its premium to a narrow set of tech names.
2010 and 2016 cash: Both were wrong
Two of the three cash calls were missed rallies: - 2010 (CASH): SPY returned +33.5%. Missing this hurt. - 2016 (CASH): SPY returned +18.6%. Another missed rally.
The signal flagged contraction. In both cases, the broad economy recovered faster than cyclical sector revenue growth suggested. The 2010 miss is the most painful. It came right after the strong 2008-2009 run and erased some of the accumulated edge.
Full Annual Returns
All returns are July-to-July periods. A "2021 CASH" year means the strategy held cash from July 2021 to July 2022.
| Year | Portfolio | SPY | Excess |
|---|---|---|---|
| 2001 | +0.5% | -22.4% | +22.9% |
| 2002 | +10.6% | +6.9% | +3.8% |
| 2003 | +35.0% | +14.9% | +20.1% |
| 2004 | +41.1% | +8.9% | +32.2% |
| 2005 | +26.7% | +8.0% | +18.7% |
| 2006 | +38.2% | +20.9% | +17.3% |
| 2007 | -10.1% | -15.2% | +5.1% |
| 2008 | -26.8% | -26.9% | +0.1% |
| 2009 | +26.9% | +16.0% | +10.9% |
| 2010 | 0.0% (CASH) | +33.5% | -33.5% |
| 2011 | -2.0% | +4.2% | -6.2% |
| 2012 | +33.2% | +20.7% | +12.4% |
| 2013 | +24.3% | +24.7% | -0.4% |
| 2014 | +1.7% | +7.2% | -5.5% |
| 2015 | -15.4% | +2.7% | -18.1% |
| 2016 | 0.0% (CASH) | +18.6% | -18.6% |
| 2017 | +15.8% | +14.3% | +1.5% |
| 2018 | +6.4% | +11.2% | -4.8% |
| 2019 | -10.2% | +7.4% | -17.7% |
| 2020 | +59.6% | +41.0% | +18.6% |
| 2021 | 0.0% (CASH) | -10.7% | +10.7% |
| 2022 | +3.5% | +18.1% | -14.6% |
| 2023 | -0.9% | +25.4% | -26.4% |
| 2024 | -0.5% | +14.4% | -14.9% |
SPY returns are July-to-July periods to match rebalancing dates.
Limitations
- Survivorship bias. The universe is current active stocks with available FMP data. Companies delisted between 2001 and 2024 are underrepresented. This likely flatters the early-period results modestly.
- Revenue growth as a lagging indicator. FY revenue data with a 45-day lag can be 12-16 months old at rebalancing. The signal captures past expansion, not current momentum.
- Tech era underperformance is structural. From 2010 onward, US market returns concentrated in sectors not covered by this strategy (Technology, Communication Services). Unless the next cycle rotates back to cyclical leadership, the structural drag remains.
- Three cash calls: two were wrong. The signal missed the 2010 and 2016 rallies. The method has limited precision at calling turning points. It identifies broad contraction, not the precise inflection.
- Energy P/E distortion. For strategies that use P/E signals (like sector-06-pe-compression), energy earnings collapses during downturns create signal distortion. This strategy uses revenue growth, not P/E, which partially avoids that problem, but energy revenue can also collapse in commodity downturns, creating similar signal suppression.
Run It Yourself
Current signal (April 2026): EXPANSION
57% of US cyclical companies show positive year-over-year revenue growth. The strategy is invested. The bar is 50%.
Check the live signal: cetaresearch.com/data-explorer?q=2KL65Exb2W
Run the stock screen (for when signal returns): cetaresearch.com/data-explorer?q=Y5QuSNOuj7
Full backtest code: github.com/ceta-research/backtests/tree/main/cyclical-timing
Data: Ceta Research (FMP financial data warehouse). Universe: NYSE + NASDAQ + AMEX cyclical sectors. Period: 2001-2024, annual rebalance (July), 45-day data lag. Next-day close (MOC) execution. Past performance does not guarantee future results. This is educational content, not investment advice.


