
Cyclical Sector Timing in India: +4.55% Annual Excess, -0.6% Down

Cyclical Sector Timing in India: +4.55% Annual Excess Over 24 Years
India is the only dedicated market in our 15-exchange cyclical timing study with sustained outperformance.
Contents
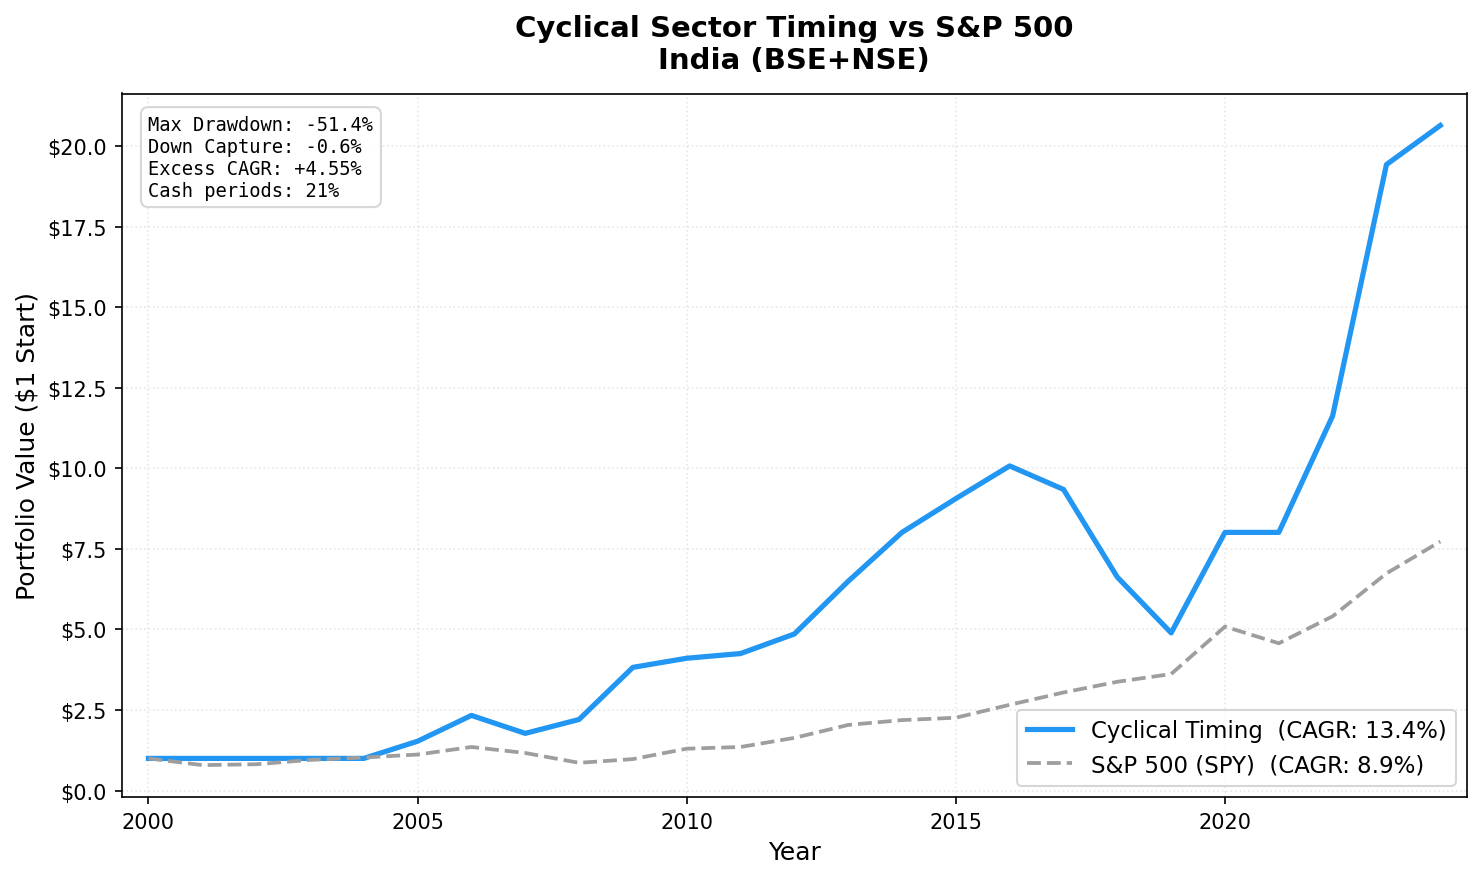
We ran the same revenue-growth expansion signal across Indian exchanges (BSE + NSE) from 2001 to 2024. The portfolio returned 13.44% annually vs 8.89% for SPY, a +4.55% annual excess held across two decades of India's economic development. The down capture was -0.6%, meaning this strategy behaved as counter-cyclical in Indian markets: when the S&P 500 fell, the portfolio more often gained.
The contrast with China, where the same signal produced -9.08% CAGR and -17.97% excess, illustrates how much market regime matters. Same signal, same sectors. Very different outcomes.
Method
| Parameter | Value |
|---|---|
| Universe | BSE + NSE |
| Sectors | Basic Materials, Industrials, Energy, Consumer Cyclical |
| Signal | ≥ 50% of cyclical stocks with positive YoY FY revenue growth |
| Selection | Top 30 by ROE, among stocks with positive revenue growth AND ROE ≥ 5% |
| Rebalancing | Annual (July) |
| Period | 2001–2024 (24 years) |
| Data lag | 45 days after fiscal year-end |
| Cash | First 4 years (2001-2004) — universe too small |
| Benchmark | S&P 500 Total Return (SPY) |
Returns are in INR. SPY is a USD benchmark used for cross-exchange comparison. Full methodology: backtests/METHODOLOGY.md US flagship blog (methodology + SQL): blog.tradingstudio.finance/cyclical-sector-timing-us-backtest
Why India Is Different
India's cyclical sectors in 2001-2024 were driven by genuine industrial expansion, not financial engineering. Infrastructure buildout, manufacturing growth, and domestic consumption created multi-year revenue growth cycles that the signal correctly identified.
The composition matters. Indian Basic Materials includes cement companies (UltraTech, Ambuja, ACC) and metals producers (Tata Steel, Hindalco) that benefited directly from infrastructure spending. Indian Industrials includes engineering and capital goods companies (Larsen & Toubro, Bharat Heavy Electricals) tied to domestic capex cycles. These businesses had structural tailwinds that US industrials, competing against Chinese manufacturing, didn't have in the same form.
The 2008 result captures this cleanly: +24.3% when the S&P 500 fell 26.1%. Indian cyclical companies were insulated from the US credit crisis. Revenue growth in cement and infrastructure continued through 2008 because India's capex cycle was domestically funded and not tied to US financial conditions.
What We Found
| Metric | Portfolio | S&P 500 (USD) |
|---|---|---|
| CAGR (2001–2024) | 13.44% | 8.89% |
| Excess CAGR | +4.55% | — |
| Max drawdown | -51.42% | -36.27% |
| Sharpe ratio | 0.237 | — |
| Beta | 0.788 | 1.0 |
| Alpha | 5.06% | — |
| Down capture | -0.6% | 100% |
| Up capture | 129.62% | 100% |
| Cash periods | 5 of 24 (21%) | — |
| Avg stocks held | 23.3 | — |
The max drawdown of -51.42% is notable. India's 2007-2009 period saw brutal cyclical drawdowns. The portfolio fell hard in 2007 (-23.9%) after the extended commodity run. The Sharpe of 0.237 reflects that volatility. This is a high-return, high-variance strategy in India, not a smooth compounder.
The -0.6% down capture is the standout. Near-zero. When SPY had a bad year, this portfolio was essentially flat on average. That's the counter-cyclical signature of India's domestic-demand-driven industries.
Key Periods
2008: India's isolation from the global crash
| Year | Portfolio | SPY | Excess |
|---|---|---|---|
| 2007 | -23.9% | -13.7% | -10.2% |
| 2008 | +24.3% | -26.1% | +50.5% |
| 2009 | +73.2% | +13.4% | +59.8% |
The 2008 result stands alone in the full 15-exchange study. Only India's cyclical timing produced a positive return in that year. Indian infrastructure companies continued executing on domestic order books as global credit markets froze.
2022-2023: India's industrial boom
| Year | Portfolio | SPY | Excess |
|---|---|---|---|
| 2022 | +45.1% | +18.3% | +26.8% |
| 2023 | +67.1% | +24.6% | +42.5% |
Two consecutive years of exceptional excess. India's PLI (Production-Linked Incentive) schemes, infrastructure spending under the National Infrastructure Pipeline, and manufacturing relocation from China drove broad revenue growth across industrials and materials. The signal fired, the ROE screen captured the quality operators, and the returns followed.
2018-2019: When the signal got it wrong
| Year | Portfolio | SPY | Excess |
|---|---|---|---|
| 2018 | -29.1% | +10.9% | -40.0% |
| 2019 | -26.1% | +7.1% | -33.2% |
Two hard years. Indian cyclical stocks took a beating as IL&FS collapsed (2018), NBFC credit stress spread, and infrastructure project delays cascaded through the order books. Revenue growth turned negative. The signal eventually fired correctly, but the losses in 2018-2019 were severe before the 2020 recovery.
Full Annual Returns
| Year | Portfolio | SPY | Excess |
|---|---|---|---|
| 2001 | 0.0% (CASH) | -20.8% | — |
| 2002 | 0.0% (CASH) | +3.3% | — |
| 2003 | 0.0% (CASH) | +16.4% | — |
| 2004 | 0.0% (CASH) | +7.9% | — |
| 2005 | +53.3% | +8.9% | +44.4% |
| 2006 | +52.3% | +20.9% | +31.3% |
| 2007 | -23.9% | -13.7% | -10.2% |
| 2008 | +24.3% | -26.1% | +50.5% |
| 2009 | +73.2% | +13.4% | +59.8% |
| 2010 | +7.4% | +32.9% | -25.6% |
| 2011 | +3.5% | +4.1% | -0.6% |
| 2012 | +14.3% | +20.9% | -6.6% |
| 2013 | +33.6% | +24.5% | +9.2% |
| 2014 | +23.4% | +7.4% | +16.0% |
| 2015 | +13.1% | +3.4% | +9.7% |
| 2016 | +11.2% | +17.7% | -6.5% |
| 2017 | -7.2% | +14.3% | -21.6% |
| 2018 | -29.1% | +10.9% | -40.0% |
| 2019 | -26.1% | +7.1% | -33.2% |
| 2020 | +63.7% | +40.7% | +23.0% |
| 2021 | 0.0% (CASH) | -10.2% | +10.2% |
| 2022 | +45.1% | +18.3% | +26.8% |
| 2023 | +67.1% | +24.6% | +42.5% |
| 2024 | +6.2% | +14.7% | -8.4% |
SPY returns are July-to-July periods to match rebalancing dates.
Limitations
Currency. Returns are in INR. USD-based investors face additional USD/INR exchange rate risk. Periods of rupee weakness (2018-2019) compound investment losses.
Early cash periods. The first four years (2001-2004) are cash due to thin FMP data coverage for Indian exchanges. The CAGR includes these zero-return years, which reduces the headline number.
High max drawdown. -51.42% isn't a conservative strategy. The 2007 drawdown alone was severe. This requires conviction and patience through multi-year down periods.
Benchmark mismatch. SPY (USD) is used as a global comparison benchmark, not the Nifty 50 or Sensex. Against a local Indian benchmark, the excess returns would be different.
The 2018-2019 regime. NBFC credit stress in India was a domestic policy event. The strategy had no way to anticipate it. These years show the limits of revenue growth signals when credit markets freeze.
Data: Ceta Research (FMP financial data warehouse). Universe: BSE + NSE cyclical sectors. Period: 2001-2024, annual rebalance (July), returns in INR. Past performance doesn't guarantee future results. This is educational content, not investment advice.


