
EV/EBITDA Below 10x on Indian Equities: 25-Year Backtest (NSE)
EV/EBITDA below 10x on NSE equities: 11.97% CAGR over 20 invested years vs 11.40% for the Sensex. A modest edge with lower beta.


India's equity market runs differently from the US. High-growth expectations get priced into multiples aggressively, which means when you find a company trading below 10x EV/EBITDA with strong ROE, it's genuinely out of favor, not just slow. We tested this screen on the NSE from 2000 to 2024 to measure what that cheapness has historically meant for returns, benchmarked against the Sensex.
Contents
Data: FMP financial data warehouse, 2000–2025. Updated May 2026.
Method
Signal: EV/EBITDA (trailing twelve months) below 10x, with ROE above 10% Universe: NSE stocks with market cap above 20B INR Period: January 2000 to December 2024 (25 years total; 5 cash years from 2000-2004 due to early universe constraints, 20 invested years from 2005-2024) Rebalancing: Annual, January. Execution at next trading day's close (MOC). Costs: 0.1% per trade (one-way) Benchmark: Sensex (^BSESN, in INR) Data: FMP financial data via Ceta Research warehouse
Returns and benchmark are both in INR. The strategy was in cash during 2000-2004 because the NSE universe at the market cap threshold did not produce 10 qualifying stocks in those early years.
What We Found
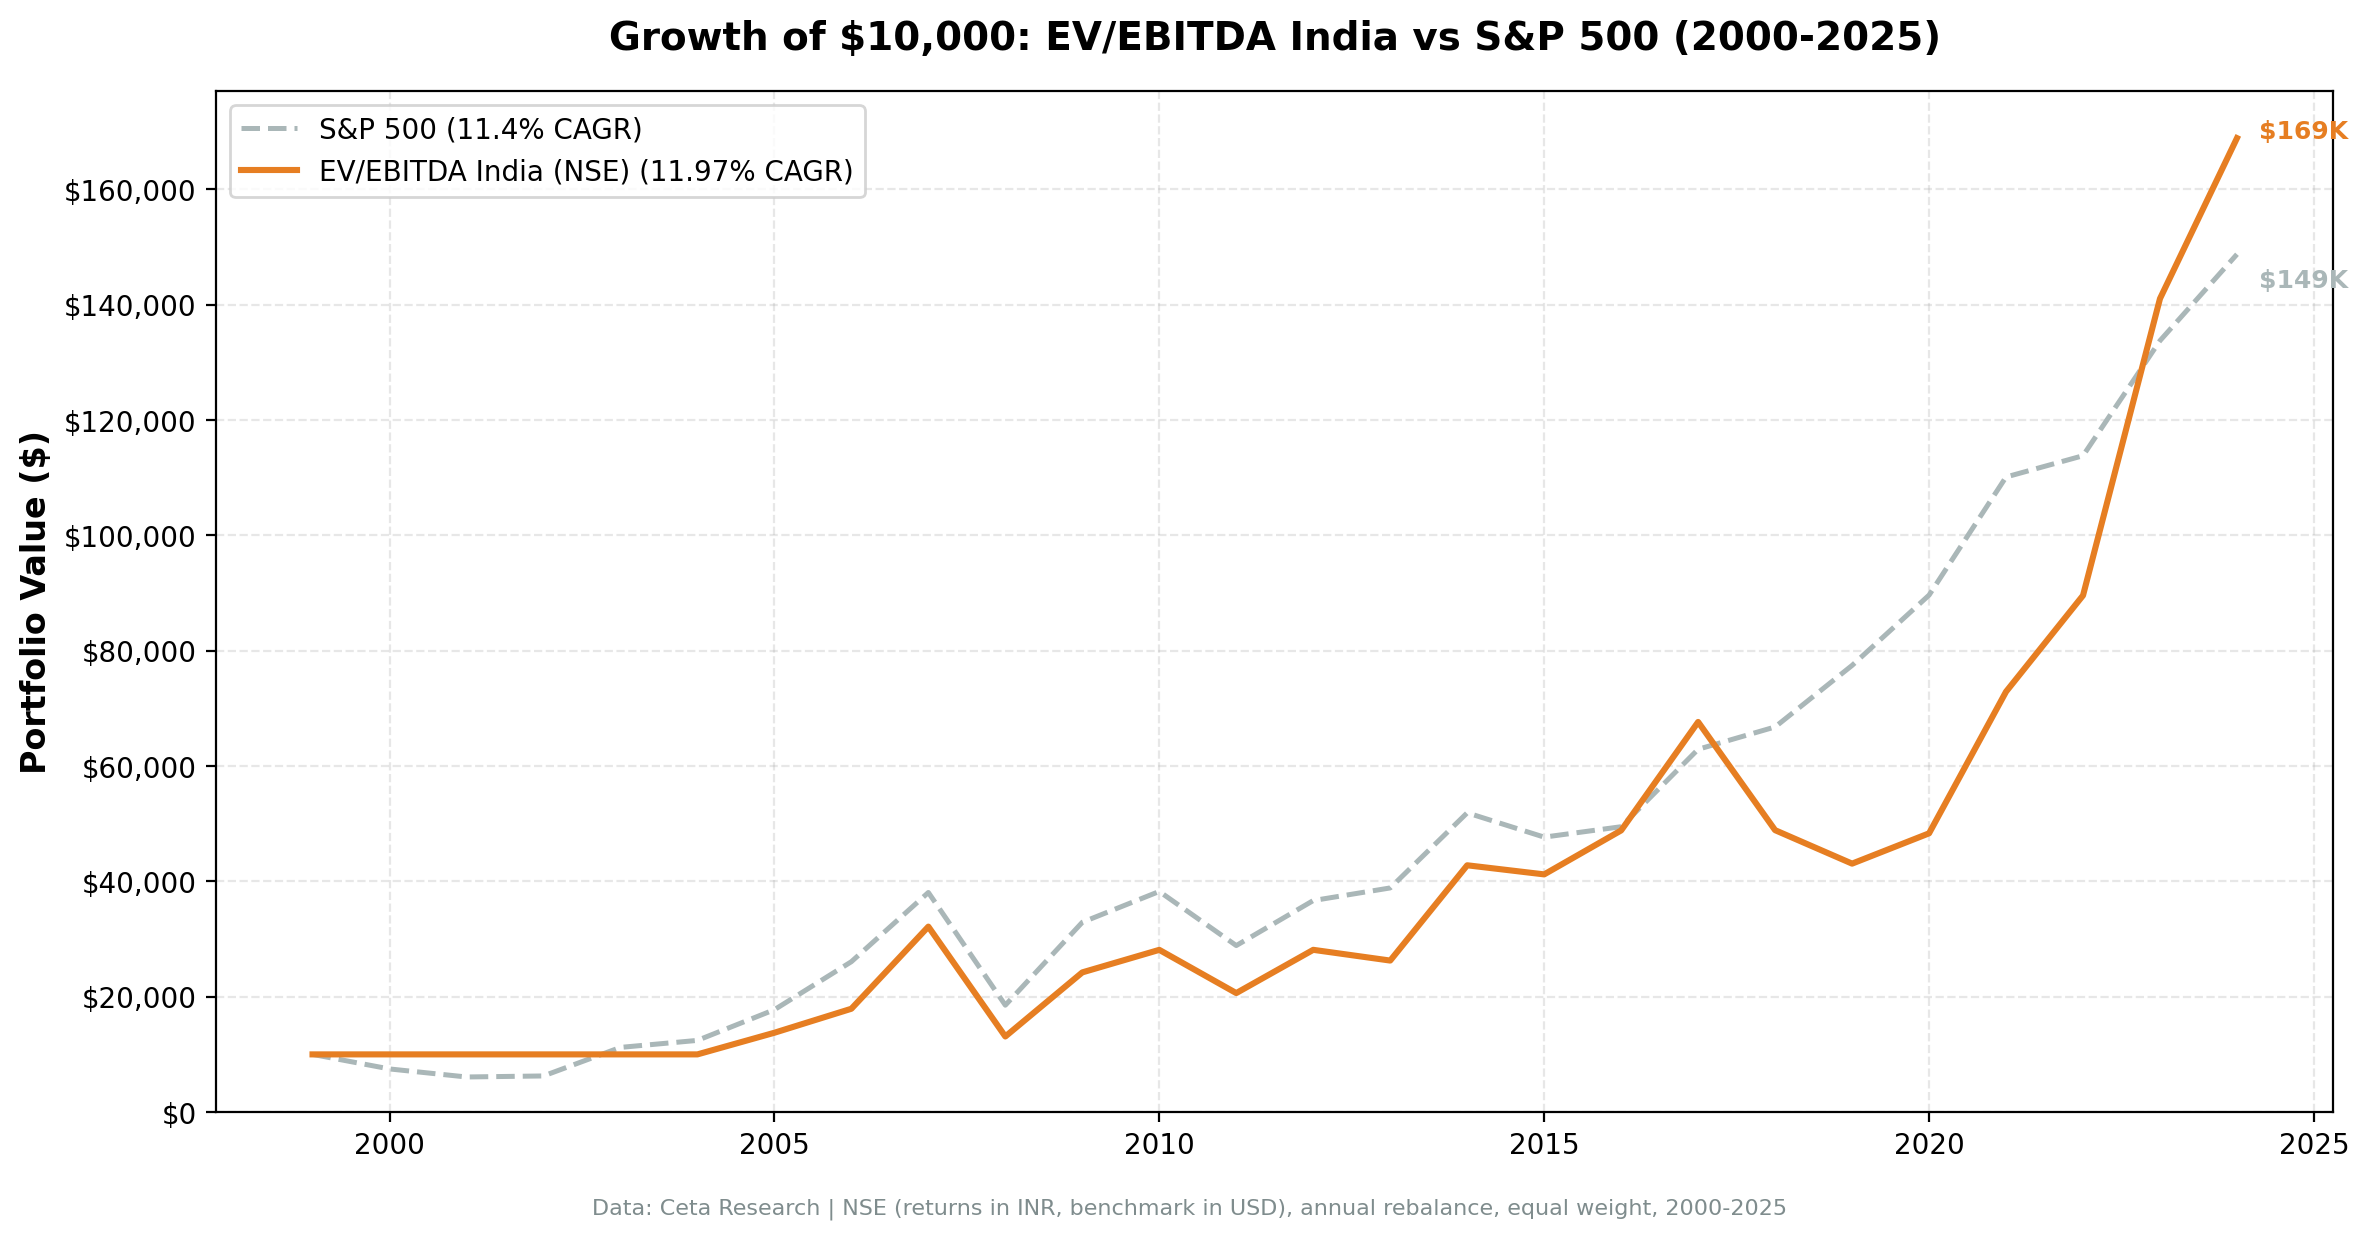
Over the full 25-year period (with 2000-2004 in cash and 2005-2024 invested), the strategy returned 11.97% CAGR versus the Sensex's 11.40%, an excess return of 0.57 percentage points per year. The CAGR is computed across all 25 years, with the cash years counting as zero-return periods. A 10,000 INR investment grew to 168,896, compared to 148,729 for the Sensex over the same period.
| Metric | Strategy | Sensex |
|---|---|---|
| CAGR | 11.97% | 11.40% |
| Excess Return | +0.57% | — |
| Sharpe Ratio | 0.161 | 0.164 |
| Max Drawdown | -59.25% | -51.34% |
| Volatility | 34.08% | 29.81% |
| Sortino Ratio | 0.318 | 0.310 |
| Calmar Ratio | 0.202 | 0.222 |
| Alpha | 1.55% | — |
| Beta | 0.800 | — |
| Win Rate | 52% | — |
| Up Capture | 101.7% | — |
| Down Capture | 70.1% | — |
| Avg Stocks Held | 26.1 | — |
| Cash Periods | 5/25 (2000-2004) | — |
The story changes when you use the right benchmark. Previous analysis compared this strategy to SPY in USD, which showed +4.09% excess. That comparison mixed INR returns with USD returns, and much of the apparent alpha was really the Sensex's own outperformance of SPY. Against the Sensex, the excess narrows to +0.57%.
The Sharpe ratios are nearly identical (0.161 vs 0.164). The strategy doesn't deliver a meaningfully better risk-adjusted return than buying the index. It does have a beta of 0.800, meaning slightly less market exposure, and the down-capture of 70.1% provides modest crash protection. But this isn't the runaway alpha that the cross-currency comparison suggested.
Year-by-Year
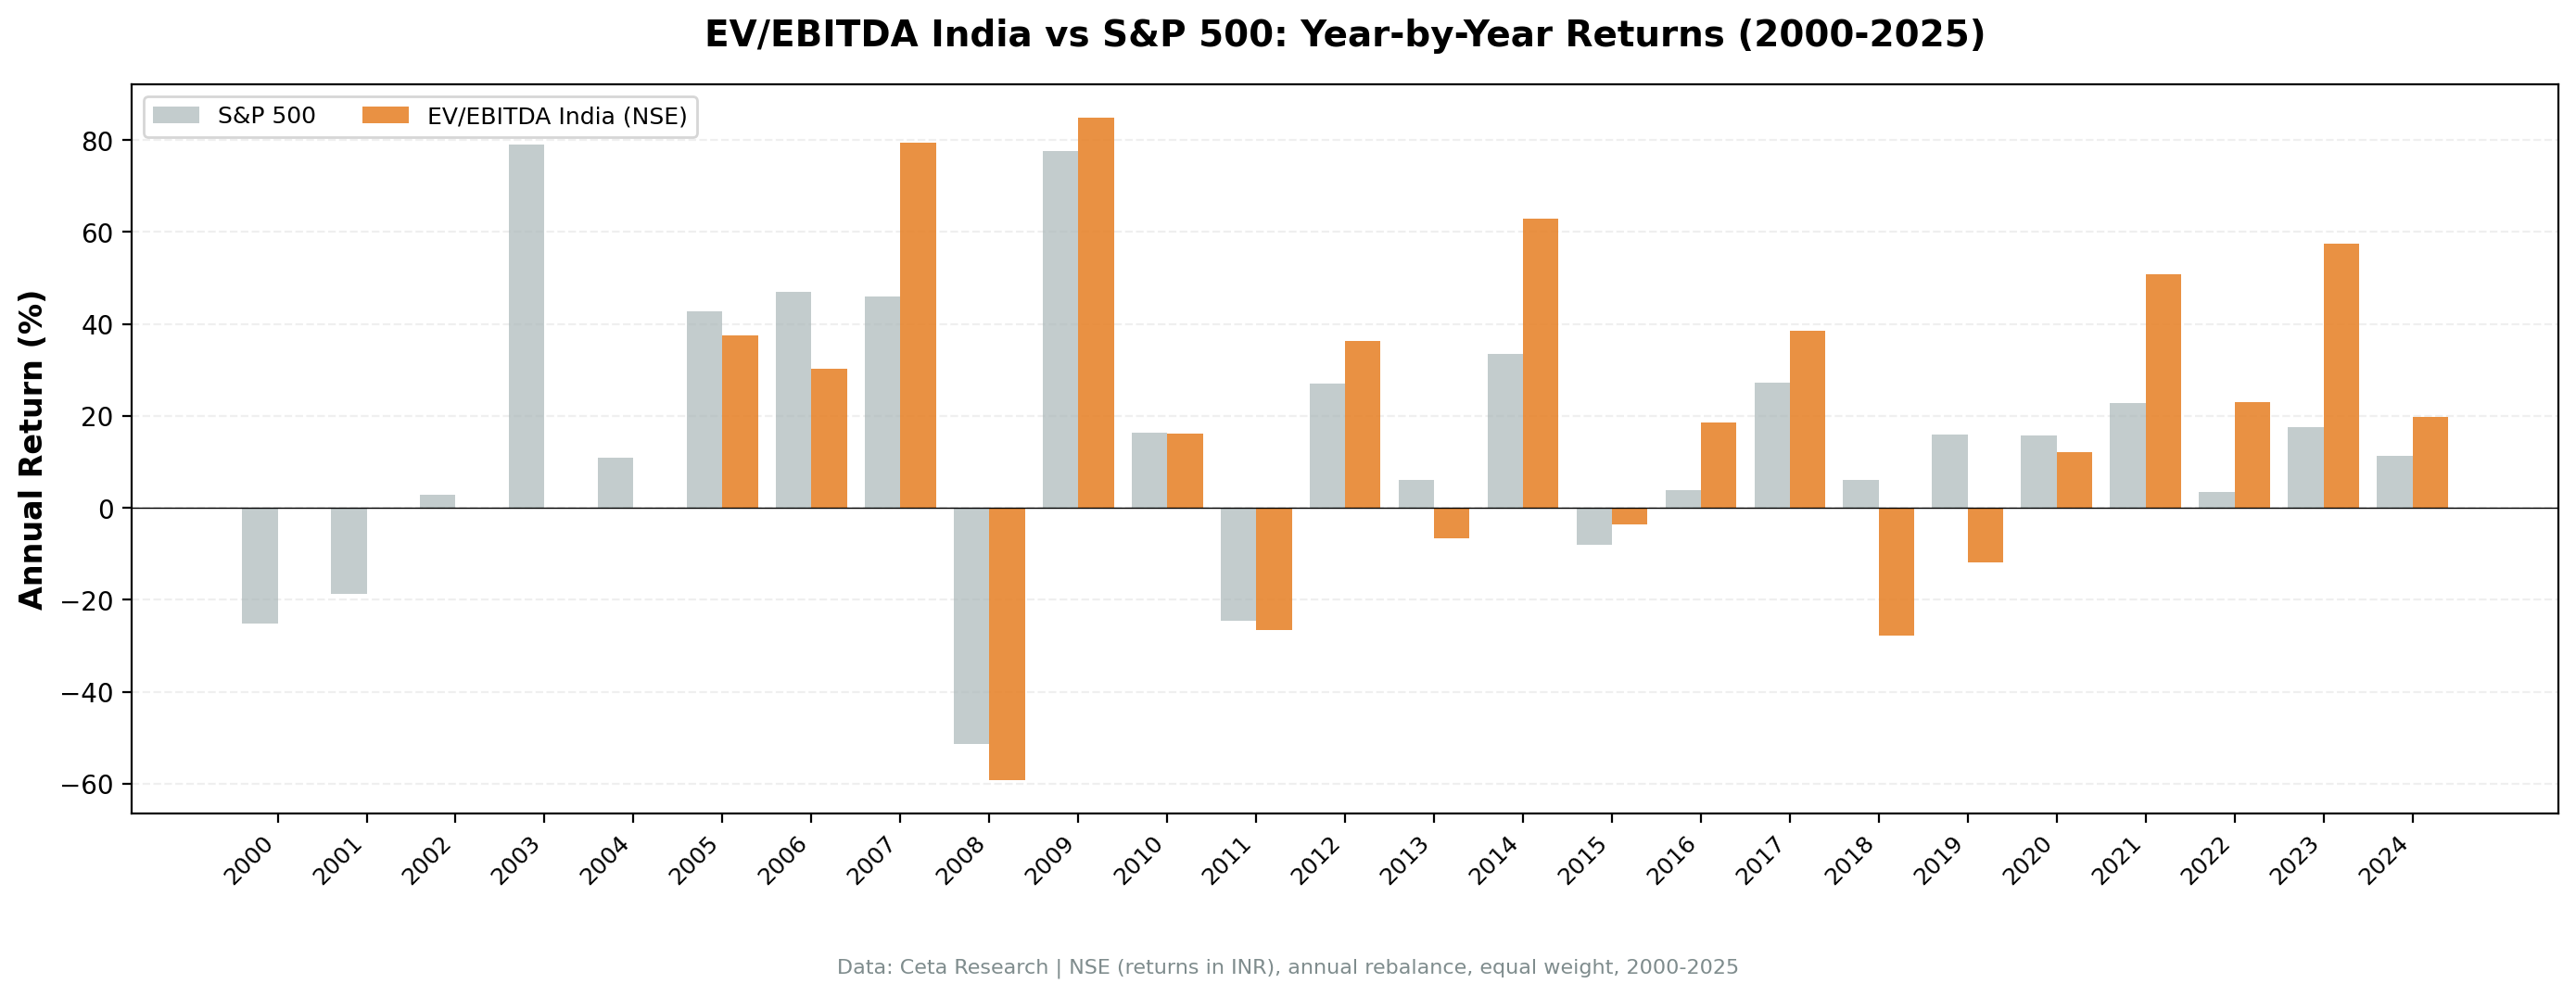
India's annual return sequence is dramatic. Triple-digit gains in one year, 50%+ losses in the next. This is not a smooth-ride strategy.
| Year | Strategy (INR) | Sensex (INR) |
|---|---|---|
| 2007 | +79.5% | +46.0% |
| 2008 | -59.3% | -51.3% |
| 2009 | +84.9% | +77.6% |
| 2011 | -26.7% | -24.5% |
| 2014 | +62.9% | +33.5% |
| 2017 | +38.5% | +27.1% |
| 2018 | -27.7% | +6.2% |
| 2019 | -11.9% | +16.0% |
| 2022 | +22.9% | +3.4% |
| 2023 | +57.5% | +17.5% |
2007 is the defining year: +79.5% vs the Sensex's +46.0%. Companies trading at low multiples were repriced as the broader market bid up everything. The screen caught the biggest beneficiaries of India's pre-crisis boom. 2008 reversed it, down 59.3% vs the Sensex's 51.3%. The strategy fell harder than the index: owning concentrated cheap industrials and materials names in a crisis means deeper losses.
The 2009 recovery: +84.9% vs the Sensex's +77.6%. Value stocks outpaced the index in the recovery year, the same pattern seen in US markets after the financial crisis.
2018-2019 was the worst stretch: -27.7% then -11.9%, while the Sensex gained +6.2% then +16.0%. The cheap-multiple names were cheap for reasons that materialized into poor returns. This is what value investing looks like when the macro turns against you.
2022-2023 was the best recent stretch: +22.9% then +57.5%, while the Sensex returned only +3.4% then +17.5%. Value stocks found their footing as India's industrial sector boomed and the Sensex's tech-heavy components lagged.
What the India Data Tells Us
Against the Sensex, the EV/EBITDA screen delivers a modest edge. The 0.57% excess CAGR is real but narrow, and the Sharpe ratios are nearly identical (0.161 vs 0.164). The screen's main value isn't return enhancement, it's diversification within the Indian market.
The beta of 0.800 against the Sensex means the portfolio has somewhat less market exposure than a passive fund. It's a fundamentally different set of stocks: the screen selects cheap industrials, materials, and consumer companies, while the Sensex is weighted toward financials, IT services, and large conglomerates. The down-capture of 70.1% provides modest cushion in corrections, though the max drawdown of -59.3% (vs the Sensex's -51.3%) shows the strategy fell harder than the index in 2008.
A few practical notes:
The 2000-2004 cash periods reflect genuine universe limitations. The NSE universe at the 20B INR market cap threshold was too small in those years to produce 10 qualifying stocks. The Indian equity market developed significantly after 2004.
Volatility of 34.08% is roughly 1.5x the US strategy's 21.49%. The max drawdown of 59.3% in 2008 would have tested any investor's conviction.
The previous version of this analysis compared Indian returns (INR) to SPY (USD), showing +4.09% excess. That comparison was misleading. The Sensex itself returned 11.40% CAGR over this period, far above SPY's 7.64%. Most of what looked like "alpha" was simply the Indian equity market's own strong performance. Against the correct benchmark, the edge is modest.
Run It Yourself
Current India screen (live TTM data):
SELECT
  k.symbol,
  p.companyName,
  p.exchange,
  k.evToEBITDATTM,
  k.returnOnEquityTTM,
  k.marketCap
FROM key_metrics_ttm k
JOIN profile p ON k.symbol = p.symbol
WHERE p.exchange IN ('NSE')
  AND k.marketCap > 20000000000
  AND k.evToEBITDATTM > 0
  AND k.evToEBITDATTM < 10
  AND k.returnOnEquityTTM > 0.10
ORDER BY k.evToEBITDATTM ASC
LIMIT 25
Run this query on Ceta Research
Run the backtest locally:
cd backtests
python3 ev-ebitda/backtest.py --preset india
Limitations
Narrow edge. The 0.57% excess return over the Sensex is within normal statistical noise for a 20-year sample. The result is consistent with a small value premium, but it's not large enough to be definitive.
Universe size in early years. The 2000-2004 cash periods reflect genuine universe limitations, not a methodology problem. As Indian markets matured, the available stock universe expanded significantly.
Data coverage. FMP's coverage of NSE stocks, particularly smaller companies and historical data pre-2005, may have gaps. The 20B INR market cap floor mitigates this by keeping the universe in better-covered stocks.
Max drawdown. A 59.3% peak-to-trough loss requires exceptional patience. Most investors would exit near the bottom. The long-run numbers assume full investment through every drawdown.
Regulatory and market structure risk. India's market structure, circuit breakers, settlement rules, and sector regulations differ from US markets. Some assumptions in the backtest framework (annual rebalancing, cost estimates) may not fully reflect Indian market frictions.
Data: Ceta Research (FMP financial data warehouse), 2000–2025. Full methodology: backtests/METHODOLOGY.md. Backtest code: backtests/ev-ebitda/.
Past performance does not guarantee future results. This is educational content, not investment advice.


