
Graham Number in Canada: 10.89% CAGR vs 4.44% TSX Composite
The Graham Number screen applied to Canadian stocks (TSX) returned 10.89% annually from 2000–2024, beating the TSX Composite by 6.46% per year. Down capture: 51.8%. Up capture: 159.5%. In years when the TSX fell, this portfolio fell only about half as much.

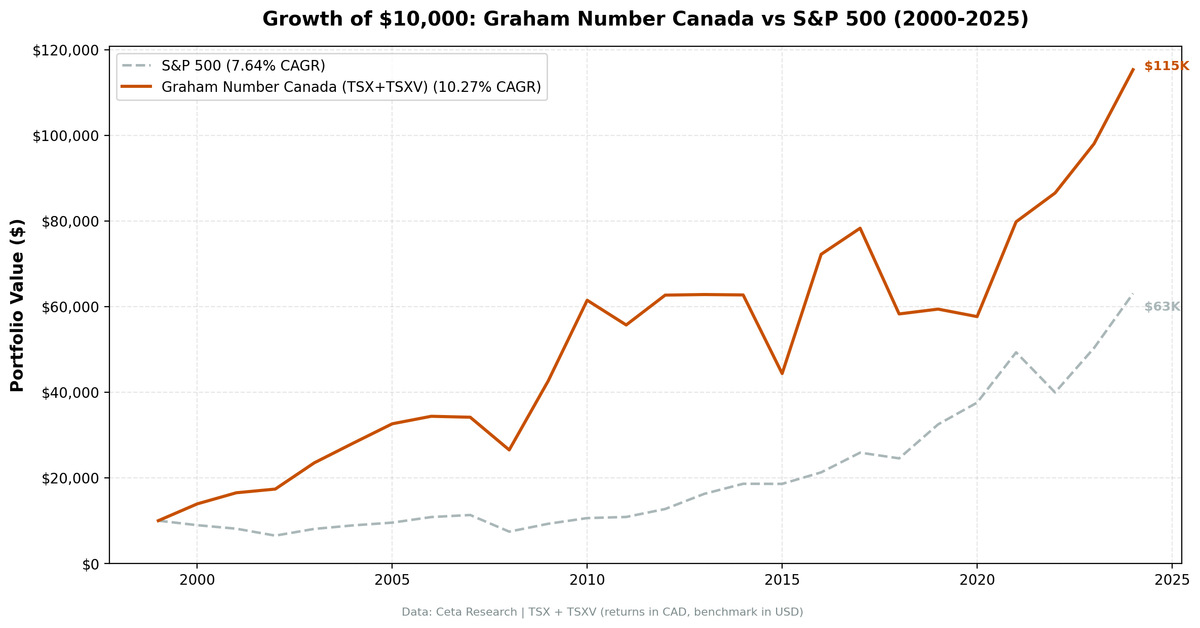
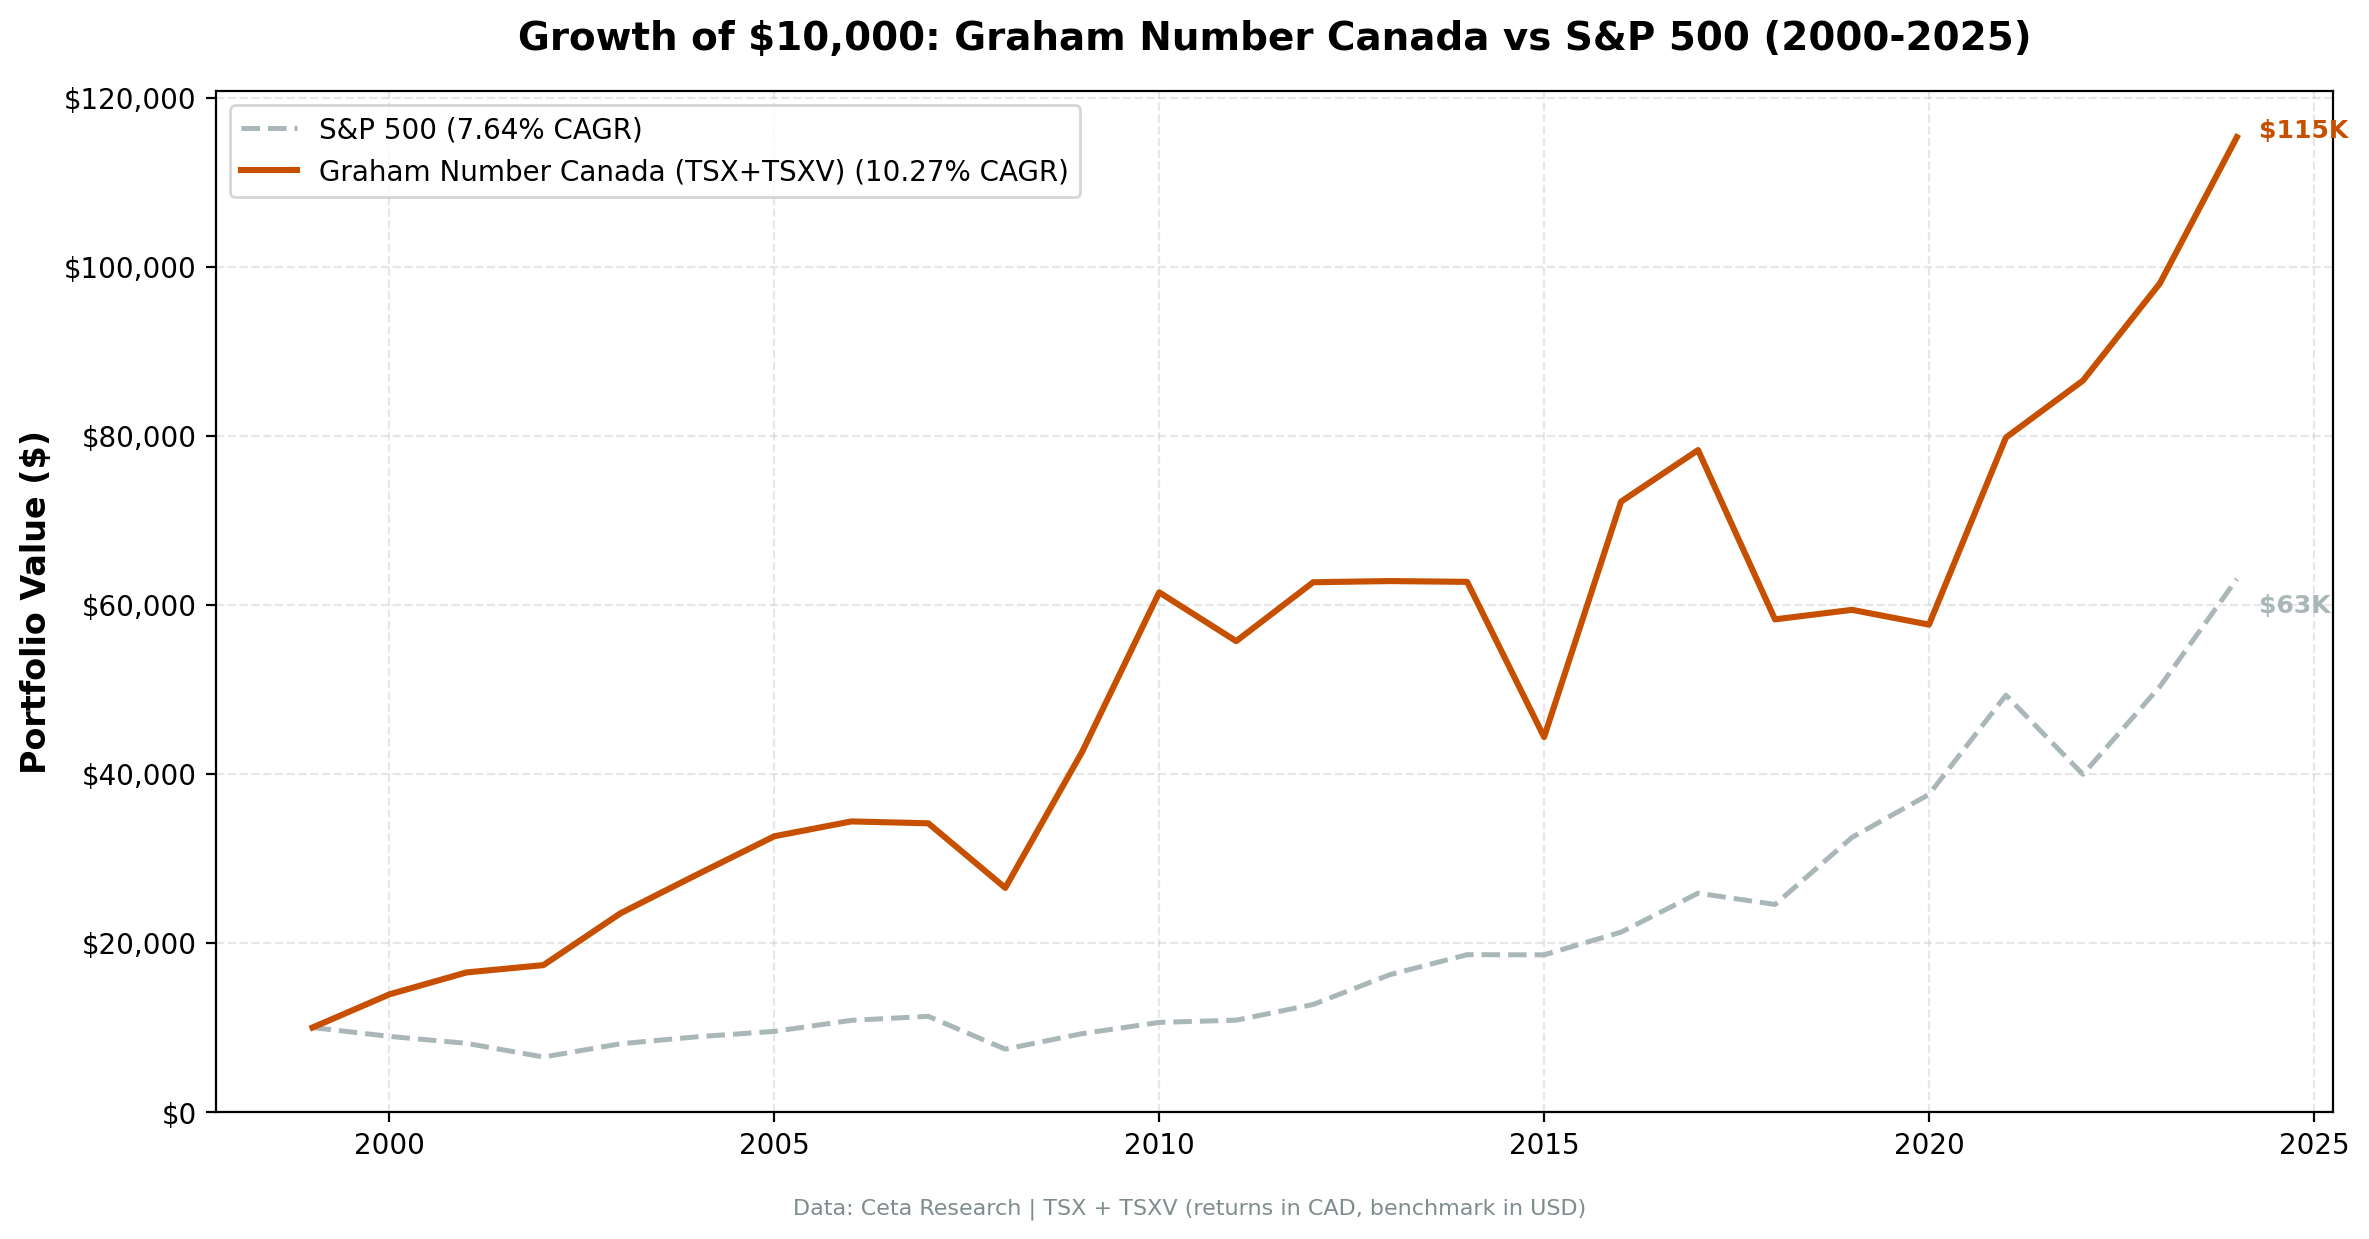
From 2000 to 2024, the Graham Number screen applied to the TSX returned 10.89% annually vs 4.44% for the TSX Composite. That's +6.46% excess return per year. The total return was 1,226.5% in CAD vs 195.9% for the index. Call it 13x vs 3x in 25 years.
Contents
- Method
- What We Found
- The Year-by-Year Story
- 2000–2002: Tech bust
- 2008: Financial crisis
- 2009–2010: Recovery
- 2015–2016: Oil crash and reversal
- 2022: Energy year
- Why Canada Is Different
- Full Annual Returns
- Limitations
- Run It Yourself
- Part of a Series
The strategy beats the TSX Composite in 60% of years. It lags in 40% of calendar years. The edge comes from the shape of returns: when it loses to the TSX, the losses are often modest; when it beats, it beats big. The 51.8% down capture is the mechanism. In years when the TSX fell, this portfolio fell only about half as much.
The Graham Number formula is sqrt(22.5 x EPS x BVPS). Buy stocks trading below that level, sorted by deepest discount. Canada's resource-heavy economy, with its cycles in energy, materials, and mining, is structurally well-suited to this screen.
Data: FMP financial data warehouse, 2000–2025. Updated May 2026.
Method
Data source: Ceta Research (FMP financial data warehouse) Universe: Toronto Stock Exchange (TSX), market cap threshold applied Period: 2000–2024 (25 annual rebalance periods) Rebalancing: Annual (January), equal weight top 30 by deepest discount to Graham Number Filing lag: 45 days (point-in-time; no look-ahead bias) Benchmark: TSX Composite Cash rule: Hold cash if fewer than 10 stocks qualify Transaction costs: Size-tiered model
| Parameter | Value |
|---|---|
| Formula | sqrt(22.5 x EPS x BVPS) |
| Selection | Top 30 stocks trading furthest below Graham Number |
| Rebalance | January, annual |
| Min stocks | 10 (cash otherwise) |
| Filing lag | 45 days |
Historical financial data with 45-day lag. Full methodology: backtests/METHODOLOGY.md
What We Found
| Metric | Portfolio | TSX Composite |
|---|---|---|
| CAGR | 10.89% | 4.44% |
| Total Return | 1,226.5% | 195.9% |
| Excess CAGR | +6.46% | — |
| Max Drawdown | -26.66% | -33.70% |
| Volatility (ann.) | 22.69% | 14.95% |
| Sharpe Ratio | 0.370 | 0.129 |
| Sortino Ratio | 0.867 | — |
| Calmar Ratio | 0.409 | — |
| Alpha | 6.31% | — |
| Beta | 1.078 | 1.00 |
| Up Capture | 159.5% | — |
| Down Capture | 51.8% | — |
| Win Rate (vs TSX) | 60% | — |
| Cash Periods | 0/25 | — |
| Avg Stocks | 26.2 | — |
The down capture is the number to sit with. At 51.8%, this portfolio absorbs only about half of the TSX's losses. It's not market-neutral. It has high volatility (22.7%), and it has real drawdowns. But the asymmetry, combined with 159.5% up capture, is how the strategy built a 1,226% total return over 25 years.
The beta of 1.078 shows the portfolio moves roughly in line with the TSX in terms of sensitivity. The alpha of 6.31% is the excess return not explained by that market exposure.
The Sortino ratio (0.867) being more than double the Sharpe (0.370) tells you something else: most of the volatility is on the upside. The bad years are violent, but the down capture limits the damage relative to the benchmark.
The Year-by-Year Story
2000–2002: Tech bust
| Year | Portfolio | TSX Composite | Excess |
|---|---|---|---|
| 2000 | +37.9% | +2.3% | +35.5% |
| 2001 | +18.3% | -11.2% | +29.5% |
| 2002 | +5.1% | -11.9% | +16.9% |
The TSX lost ground over these three years. This portfolio gained substantially. Canadian resource stocks had nothing to do with Nasdaq valuations. They were trading at low multiples of real earnings and tangible book, exactly where Graham's formula directs attention. The screen worked not because of Canada but because the crash was a US technology event, and Canadian value names were insulated.
2008: Financial crisis
| Year | Portfolio | TSX Composite | Excess |
|---|---|---|---|
| 2008 | -22.3% | -33.7% | +11.4% |
This was a global credit event. Canadian banks and resource companies weren't immune, but the portfolio's value tilt provided a buffer. The portfolio lost 22% instead of 34%. The relative performance matters as much as the absolute.
2009–2010: Recovery
| Year | Portfolio | TSX Composite | Excess |
|---|---|---|---|
| 2009 | +60.8% | +28.5% | +32.2% |
| 2010 | +41.6% | +12.9% | +28.6% |
Coming off a shallower drawdown, the recovery was proportionally large. The same commodity names that held up in 2008 rebounded hard as global demand recovered. Two consecutive years of 30%+ excess return.
2015–2016: Oil crash and reversal
This is the most instructive two-year sequence in the data.
| Year | Portfolio | TSX Composite | Excess |
|---|---|---|---|
| 2015 | -26.7% | -12.4% | -14.3% |
| 2016 | +57.4% | +19.2% | +38.2% |
2015 was real. Oil went from $60 to $27. Canadian energy stocks, many of which the Graham Number screen selects precisely because they trade cheap on book value, fell further than the broad index. When compression is caused by a genuine sector dislocation rather than sentiment, it doesn't revert until the commodity price recovers. Graham's formula doesn't know why a stock is cheap.
2016 reversed with the same force. Energy and materials names that the screen had loaded up on during the oil crash rebounded hard. The portfolio returned +57.4% in a year the TSX gained 19%. The 2015 loss and 2016 gain are the same trade with a one-year lag.
2022: Energy year
| Year | Portfolio | TSX Composite | Excess |
|---|---|---|---|
| 2022 | +5.9% | -8.4% | +14.4% |
While rising rates crushed growth and technology names, Canadian energy and materials companies delivered earnings growth. The portfolio held up and finished positive while the TSX was down. This is the same dynamic as 2000-2002: when the selloff is concentrated in expensive growth names, Canadian commodity value stocks are somewhere else entirely.
Why Canada Is Different
Canada's TSX has a different composition than the S&P 500 or most global indices. About 30% of the index is financials (banks, insurance), 20% is energy, and another 15-20% is materials (mining, gold, fertilizers). Technology is a small portion.
Graham's formula screens for low P/E and low P/B. Oil sands companies, mining companies, and Canadian banks are structurally cheap on these metrics during downturns. The TSX's composition means the Graham Number screen is usually full of real businesses with hard assets, not highly levered tech at price-to-book of 10.
The beta of 1.078 vs the TSX is close to 1, meaning the portfolio moves at a similar pace to the local market overall. The edge comes from stock selection within the same sectors, not from sector bets.
The down capture of 51.8% is the flip side. When the TSX falls, the cheapest stocks by Graham's criteria often hold up better. They've already been compressed to low valuations. The upside capture of 159.5% reflects what happens when those compressed names re-rate.
One more factor: CAD correlates with oil prices. When oil is strong, both the TSX and the value names within it tend to rise. The Graham Number screen concentrates in the cheapest of those names, amplifying the effect.
Full Annual Returns
| Year | Portfolio | TSX Composite | Excess |
|---|---|---|---|
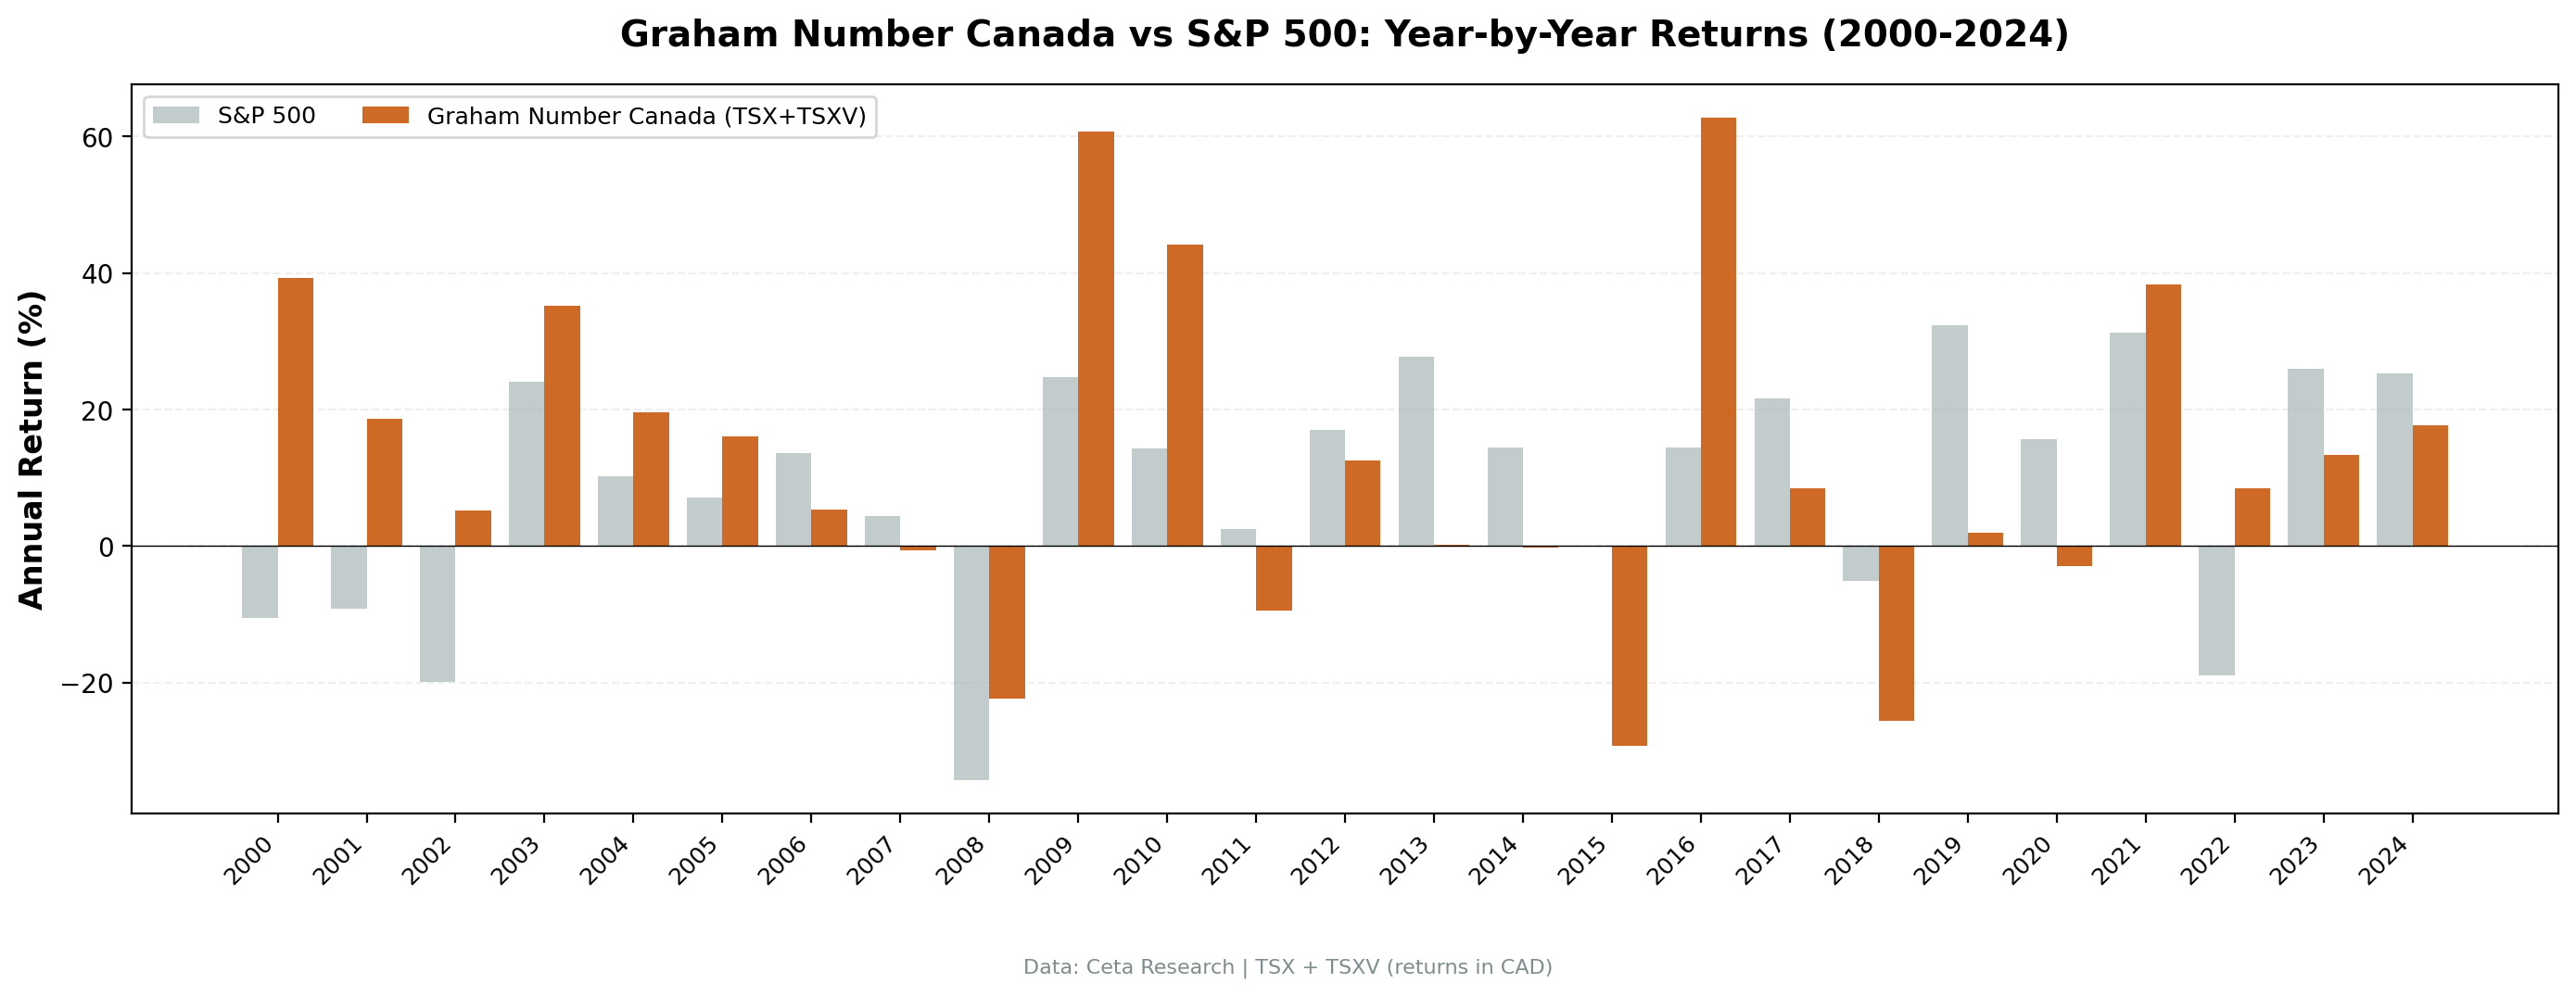
| 2000 | +37.9% | +2.3% | +35.5% |
| 2001 | +18.3% | -11.2% | +29.5% |
| 2002 | +5.1% | -11.9% | +16.9% |
| 2003 | +34.8% | +23.1% | +11.8% |
| 2004 | +18.5% | +10.2% | +8.2% |
| 2005 | +17.6% | +25.1% | -7.6% |
| 2006 | +5.6% | +13.0% | -7.3% |
| 2007 | +0.1% | +7.8% | -7.6% |
| 2008 | -22.3% | -33.7% | +11.4% |
| 2009 | +60.8% | +28.5% | +32.2% |
| 2010 | +41.6% | +12.9% | +28.6% |
| 2011 | -6.9% | -8.9% | +2.0% |
| 2012 | +11.2% | +2.7% | +8.4% |
| 2013 | +7.5% | +8.4% | -0.9% |
| 2014 | +6.4% | +8.5% | -2.2% |
| 2015 | -26.7% | -12.4% | -14.3% |
| 2016 | +57.4% | +19.2% | +38.2% |
| 2017 | +10.3% | +5.9% | +4.4% |
| 2018 | -24.5% | -12.0% | -12.5% |
| 2019 | +4.9% | +19.2% | -14.3% |
| 2020 | -5.0% | +2.5% | -7.5% |
| 2021 | +39.1% | +21.2% | +18.0% |
| 2022 | +5.9% | -8.4% | +14.4% |
| 2023 | +15.2% | +7.3% | +7.9% |
| 2024 | +14.6% | +19.3% | -4.7% |
The lag years follow a pattern: 2005-2007 and 2018-2020 are periods when the TSX's strength came from sectors or names outside what the Graham Number screen selects. The bad absolute years (2015, 2018) were both commodity downturns. That's a coherent story, not random noise.
Limitations
Commodity concentration. The TSX's energy and materials weighting means this portfolio regularly loads up on commodity producers when their prices fall. That creates correlated risk within the portfolio. In 2015, multiple positions moved together because they were all leveraged to oil. Diversification across names doesn't help when the underlying driver is a single commodity.
2018-2020 stretch. Three consecutive years of meaningful underperformance (-12.5%, -14.3%, -7.5% excess) is real for any investor who would have to stay the course. The discipline required to hold through that stretch is substantial.
Annual rebalancing lag. January rebalancing means a company that looked cheap in January might see a fundamental deterioration mid-year without portfolio response until the following January. In a volatile commodity market, a lot can change.
Graham's formula doesn't time sectors. The formula identifies stocks trading below their calculated intrinsic value based on earnings and book value. It doesn't distinguish between a commodity company cheap because of a temporary price dip vs one in genuine secular decline. The 2015 oil crash was temporary. Not all sector compression stories end with a 2016 reversal.
Run It Yourself
git clone https://github.com/ceta-research/backtests.git
cd backtests

python3 graham-number/backtest.py --preset canada --output results.json --verbose
python3 graham-number/screen.py --preset canada
Or screen TSX stocks against their Graham Number today using the live data platform:
SELECT
    p.symbol,
    p.companyName,
    p.sector,
    ROUND(k.marketCap / 1e9, 2) AS mktcap_b,
    ROUND(k.grahamNumberTTM, 2) AS graham_number,
    ROUND(p.price, 2) AS current_price,
    ROUND(p.price / k.grahamNumberTTM, 3) AS price_to_gn
FROM profile p
JOIN key_metrics_ttm k ON p.symbol = k.symbol
WHERE p.exchange IN ('TSX', 'TSXV')
  AND k.marketCap BETWEEN 500000000 AND 500000000000
  AND k.grahamNumberTTM > 0
  AND k.grahamNumberTTM < 10000
  AND p.price > 1
  AND p.price < k.grahamNumberTTM
ORDER BY price_to_gn ASC
LIMIT 30
Run Canada Graham Number screen live →
Part of a Series
- US analysis →: NYSE/NASDAQ/AMEX universe, 25 years
- Japan analysis →: JPX, world's deepest value market
- Global comparison →: All 12 exchanges tested side by side
Data: Ceta Research (FMP financial data warehouse), 2000–2024. Universe: Toronto Stock Exchange (TSX). Returns in CAD. Benchmark: TSX Composite. Full methodology: METHODOLOGY.md. Past performance does not guarantee future results.


