
Graham Number Backtest: 25 Years of Buying US Stocks Below Intrinsic Value
We ran Benjamin Graham's formula (sqrt(22.5 × EPS × BVPS)) across US stocks from 2000 to 2024. The honest result: 7.01% CAGR vs 7.64% for SPY. The down capture of 68.8% is real. The structural underperformance since 2013 is also real.

Benjamin Graham's formula is simple: multiply EPS by book value per share, multiply that by 22.5, take the square root. If the stock trades below that number, it's cheap. We ran this screen across US stocks for 25 years. The result is honest and worth understanding.
Contents
- Method
- The Formula
- What We Found
- Year by Year: Two Very Different Eras
- 2000-2012: When Cheap Beat the Market
- 2013-2021: The Value Malaise
- 2022-2024: Partial Recovery
- Why the US Market Is Different
- The Full Annual Record
- Limitations
- Run It Yourself
- Part of a Series
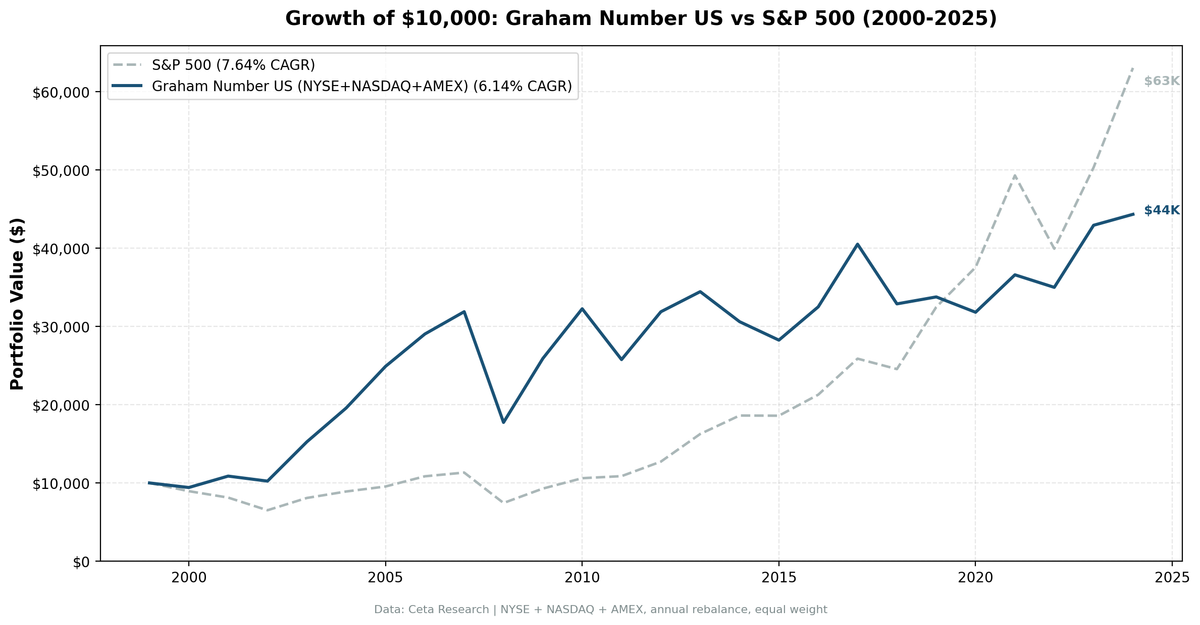
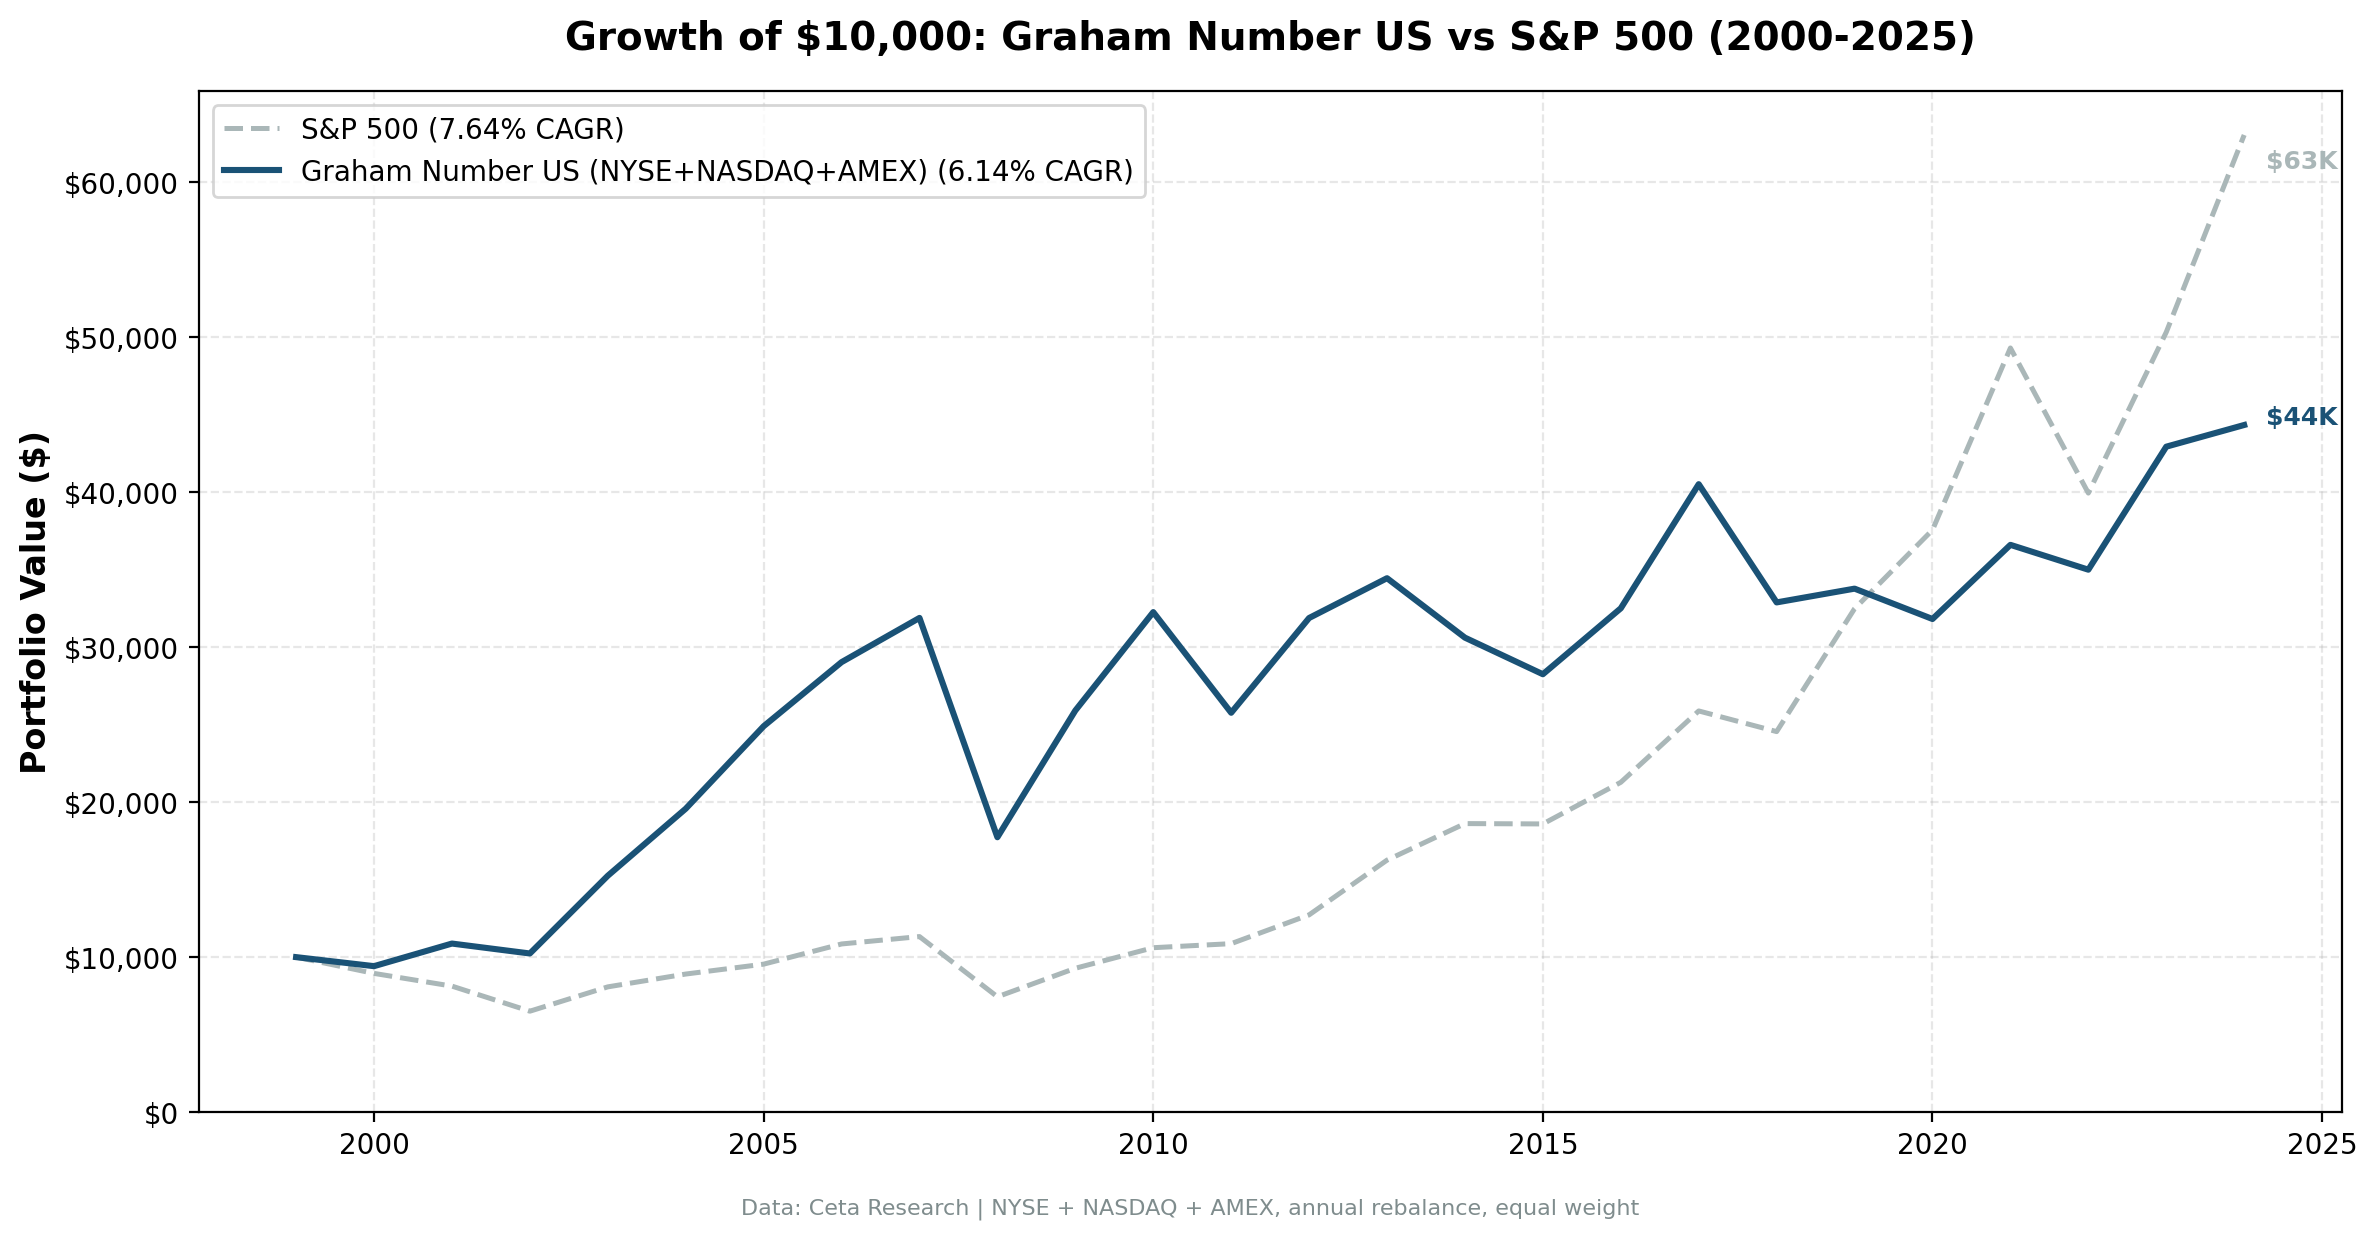
CAGR: 7.01%. SPY: 7.64%. Annual shortfall: -0.63%.
A $10,000 investment in January 2000 grew to $54,404 by end of 2024. SPY turned the same $10,000 into $63,071. The Graham Number screen, applied mechanically in the US market, didn't keep up.
That's the headline. The story underneath it is more useful.
Data: FMP financial data warehouse, 2000–2025. Updated May 2026.
Method
Data source: Ceta Research (FMP financial data warehouse) Universe: All US exchanges (NYSE, NASDAQ, AMEX), market cap > $1B Period: 2000-2024 (25 annual rebalance periods) Rebalancing: Annual (January), equal weight top 30 by discount to Graham Number Ranking: Deepest discount first (lowest price / Graham Number ratio) Benchmark: S&P 500 Total Return (SPY) Cash rule: Hold cash if fewer than 10 stocks qualify Transaction costs: Size-tiered model (0.1% mega-cap to 0.5% mid-cap) Filing lag: 45 days to prevent look-ahead bias
Full methodology: backtests/METHODOLOGY.md
The Formula
Graham Number = sqrt(22.5 × EPS × Book Value Per Share)
The constant 22.5 comes from Graham's rule that a stock shouldn't exceed 15x earnings or 1.5x book value. Multiply those limits: 15 × 1.5 = 22.5. The screen buys only stocks trading below this theoretical intrinsic value ceiling, ranked by how deep the discount goes.
| Parameter | Value | Purpose |
|---|---|---|
| Formula | sqrt(22.5 × EPS × BVPS) | Graham's combined earnings + book ceiling |
| Max portfolio size | 30 stocks | Concentrated enough to matter |
| Ranking | Price / Graham Number ascending | Deepest discounts first |
| Market cap floor | > $1B | Investable universe only |
| Cash threshold | < 10 qualifying stocks | Avoids forced exposure |
This is one of the purest value screens in finance. No momentum filters. No quality overlays. No sector caps. Graham's arithmetic, applied literally.
What We Found
| Metric | Graham Number | S&P 500 |
|---|---|---|
| CAGR | 7.01% | 7.64% |
| Total Return | 444.0% | 530.7% |
| Max Drawdown | -44.13% | -34.90% |
| Volatility (ann.) | 21.40% | 17.51% |
| Sharpe Ratio | 0.234 | 0.322 |
| Sortino Ratio | 0.414 | 0.556 |
| Calmar Ratio | 0.159 | 0.219 |
| VaR 95% | -22.89% | -19.92% |
| Beta | 0.797 | 1.00 |
| Alpha | +0.51% | — |
| Up Capture | 91.4% | — |
| Down Capture | 68.8% | — |
| Win Rate (vs SPY) | 56% | — |
| Cash Periods | 0/25 | — |
| Avg Stocks Held | 28.3 | — |
The down capture of 68.8% is real. In years when the market falls, this portfolio falls only about 69% as much on average. That's genuine downside protection from owning cheap stocks. The problem is the up capture of 91.4%. The portfolio captures most of the upside but not all of it. In a sustained bull market, that gap compounds against you.
Year by Year: Two Very Different Eras
2000-2012: When Cheap Beat the Market
The dot-com bust changed the landscape for value investing almost immediately. Stocks that had been priced for perfection crashed. Graham Number stocks, already priced conservatively, held up better and recovered faster.
| Year | Portfolio | S&P 500 | Excess |
|---|---|---|---|
| 2000 | +0.11% | -10.50% | +10.61% |
| 2001 | +13.29% | -9.17% | +22.45% |
| 2002 | +0.43% | -19.92% | +20.35% |
| 2003 | +48.41% | +24.12% | +24.29% |
| 2004 | +26.94% | +10.24% | +16.71% |
| 2005 | +28.84% | +7.17% | +21.67% |
| 2006 | +18.12% | +13.65% | +4.47% |
| 2007 | +6.64% | +4.40% | +2.24% |
| 2008 | -44.13% | -34.31% | -9.82% |
| 2009 | +46.32% | +24.73% | +21.59% |
| 2010 | +23.93% | +14.31% | +9.63% |
| 2011 | -22.89% | +2.46% | -25.35% |
| 2012 | +29.34% | +17.09% | +12.25% |
2001 and 2002 were the strategy's finest hours. While the S&P fell nearly 28% over those two years combined, the Graham Number portfolio gained a net +14%. The protection came from the margin of safety built into the selection: stocks already priced below their conservative intrinsic value had limited room to fall further.
2003 through 2005 were the payoff years. Banks, industrials, and cyclicals trading below book value doubled and tripled as the economy recovered. The screen caught them before the re-rating. Three consecutive years of 20%+ excess returns.
2008 broke the streak badly. The -44.13% drawdown was the strategy's worst year, worse than SPY by 10 percentage points. Graham Number screens load up on financials and deep cyclicals, the exact sectors that collapsed in the credit crisis. Book values became unreliable overnight. The margin of safety embedded in pre-crisis BVPS figures evaporated when balance sheets were restated.
2009 and 2010 recovered fast. The same sectors that cratered bounced hardest, and the strategy captured +46% in 2009 alone.
2011 was another bad year. The strategy fell -23% in a flat market, hit by European sovereign debt fears that punished financials and cyclicals a second time.
Through 2012, the strategy had beaten SPY in 11 of 13 years. The compound advantage was meaningful. Then the world changed.
2013-2021: The Value Malaise
| Year | Portfolio | S&P 500 | Excess |
|---|---|---|---|
| 2013 | +15.9% | +27.77% | -11.9% |
| 2014 | -8.2% | +14.50% | -22.7% |
| 2015 | -7.4% | -0.12% | -7.3% |
| 2016 | +14.5% | +14.45% | +0.0% |
| 2017 | +22.8% | +21.64% | +1.2% |
| 2018 | -21.6% | -5.15% | -16.5% |
| 2019 | +3.5% | +32.31% | -28.8% |
| 2020 | -5.9% | +15.64% | -21.6% |
| 2021 | +21.1% | +31.26% | -10.2% |
2013 was the inflection point. The S&P gained 27.77%. The Graham Number screen gained 15.9%. The gap of -11.9% wasn't a bad year for value stocks. It was a signal that the US equity market had entered a different regime.
Technology companies began dominating index returns in ways that Graham's framework structurally can't capture. Amazon, Google, Microsoft, Meta, and Apple don't show up in Graham Number screens. They trade at multiples of book value, often with earnings too modest relative to price to produce a meaningful Graham Number at all. As these companies grew from large to enormous, their drag on any non-technology value screen compounded.
2014 was the clearest demonstration. The portfolio fell -8.2% while SPY gained +14.5%. The -22.7% gap was among the widest negative excess years in the dataset. Financials and energy stocks, which dominate Graham Number screens, were flat to down while technology and biotech led the market.
2019 and 2020 confirmed the pattern. The portfolio gained +3.5% in 2019 while SPY gained +32.3%. Then COVID hit in 2020, and the portfolio fell -5.9% while SPY recovered to +15.6% by year end, led by the same technology stocks the screen never holds.
2022-2024: Partial Recovery
| Year | Portfolio | S&P 500 | Excess |
|---|---|---|---|
| 2022 | -8.2% | -18.99% | +10.8% |
| 2023 | +20.5% | +26.00% | -5.6% |
| 2024 | +9.3% | +25.28% | -16.0% |
2022 was a genuine value recovery year. Rate hikes punished growth stocks with long-duration earnings. The Graham Number portfolio fell -8.2% while SPY fell -19%. The down capture worked as expected.
2023 and 2024 snapped back to pattern. The AI-driven rally concentrated gains in Nvidia, Microsoft, and a handful of other technology companies that value screens don't hold. 2024's -16.0% excess gap is the latest confirmation. The structural problem hasn't resolved.
Why the US Market Is Different
The Graham Number screen has a sector problem specific to the US market. The formula requires both positive earnings and positive book value per share. That filters out unprofitable growth companies, which is fine. But it also systematically underweights or excludes asset-light businesses that generate high returns on low book values.
Technology companies often have small book values relative to their earnings power. Amazon's book value doesn't capture the value of AWS. Microsoft's balance sheet doesn't reflect the moat of Azure and Office 365. These companies fail the Graham Number screen not because they're risky, but because their value is in cash flows, not balance sheet assets.
The result is a portfolio that concentrates in financials (where book value is meaningful), industrials, and energy. That concentration worked well in the 2000s when those sectors led the market. It has been a structural drag since 2013 as technology's share of the S&P 500 grew from roughly 16% to over 30%.
The down capture of 68.8% is still real and useful. In bear markets, the strategy's defensive character shows up clearly. 2000-2002, 2022. These are years when cheap stocks with tangible asset backing held up better than expensive growth stocks. The problem is that US bull markets since 2013 have been so technology-dominated that the drag in up years more than offsets the protection in down years.
The Full Annual Record
| Year | Portfolio | S&P 500 | Excess |
|---|---|---|---|
| 2000 | +0.1% | -10.50% | +10.6% |
| 2001 | +13.3% | -9.17% | +22.5% |
| 2002 | +0.4% | -19.92% | +20.4% |
| 2003 | +48.4% | +24.12% | +24.3% |
| 2004 | +26.9% | +10.24% | +16.7% |
| 2005 | +28.8% | +7.17% | +21.7% |
| 2006 | +18.1% | +13.65% | +4.5% |
| 2007 | +6.6% | +4.40% | +2.2% |
| 2008 | -44.1% | -34.31% | -9.8% |
| 2009 | +46.3% | +24.73% | +21.6% |
| 2010 | +23.9% | +14.31% | +9.6% |
| 2011 | -22.9% | +2.46% | -25.4% |
| 2012 | +29.3% | +17.09% | +12.3% |
| 2013 | +15.9% | +27.77% | -11.9% |
| 2014 | -8.2% | +14.50% | -22.7% |
| 2015 | -7.4% | -0.12% | -7.3% |
| 2016 | +14.5% | +14.45% | +0.0% |
| 2017 | +22.8% | +21.64% | +1.2% |
| 2018 | -21.6% | -5.15% | -16.5% |
| 2019 | +3.5% | +32.31% | -28.8% |
| 2020 | -5.9% | +15.64% | -21.6% |
| 2021 | +21.1% | +31.26% | -10.2% |
| 2022 | -8.2% | -18.99% | +10.8% |
| 2023 | +20.5% | +26.00% | -5.6% |
| 2024 | +9.3% | +25.28% | -16.0% |
Win rate vs SPY: 56% (14 of 25 years). The majority of years were wins by count. The losses were bigger on average than the wins, which is how a 56% win rate produces negative excess CAGR.
Limitations
Book value reliability. Graham's formula treats book value as a proxy for liquidation value. That assumption worked in the manufacturing-heavy economy of mid-20th century America. In an economy where software, brand, and network effects drive most corporate value, book value per share captures an increasingly small fraction of what a business is worth. The screen selects well for banks and industrials, less well for the economy at large.
The 2008 drawdown. At -44.1%, the strategy's max drawdown is 10 percentage points deeper than SPY's -34.9%. Financial stocks, which frequently appear in Graham Number screens due to low price-to-book ratios, were the epicenter of the crisis. The same balance sheet characteristics that make them look cheap on Graham's formula made them fragile in 2008. Stress-testing against financial sector exposure is necessary before running this strategy live.
Structural underperformance since 2013. This isn't a rough patch. It's 9 years of persistent underperformance interrupted only by the rate-shock year of 2022. The US equity market's increasing concentration in technology and asset-light businesses is a structural headwind for any book-value-based screen.
No quality filter. A company can have positive EPS and positive BVPS and still be a deteriorating business. The original Graham Number screen has no profitability quality check, no leverage limit, no earnings consistency requirement. Adding quality overlays (ROE > 10%, debt-to-equity < 1.5) would likely improve results, but that becomes a different screen.
Annual rebalancing lag. The 45-day filing lag plus annual rebalancing means the portfolio can hold a deteriorating stock for up to 13 months before rotating out.
Run It Yourself
-- Current Graham Number screen (US exchanges)
SELECT
    p.symbol,
    p.companyName,
    p.sector,
    p.exchange,
    ROUND(k.marketCap / 1e9, 2) AS mktcap_b,
    ROUND(k.grahamNumberTTM, 2) AS graham_number,
    ROUND(p.price, 2) AS current_price,
    ROUND(p.price / k.grahamNumberTTM, 3) AS price_to_gn
FROM profile p
JOIN key_metrics_ttm k ON p.symbol = k.symbol
WHERE p.exchange IN ('NYSE', 'NASDAQ', 'AMEX')
  AND k.marketCap BETWEEN 1000000000 AND 5000000000000
  AND k.grahamNumberTTM > 0
  AND k.grahamNumberTTM < 10000
  AND p.price > 5
  AND p.price < k.grahamNumberTTM
ORDER BY price_to_gn ASC
LIMIT 30
Run this screen live on Ceta Research →
git clone https://github.com/ceta-research/backtests.git
cd backtests

# US backtest
python3 graham-number/backtest.py --preset us --output results.json --verbose

# All exchanges
python3 graham-number/backtest.py --global --output results/exchange_comparison.json

# Current screen
python3 graham-number/screen.py --preset us
Part of a Series
This is the US analysis. We tested the Graham Number screen across markets globally:
- Global comparison →: How the strategy performs across 12 exchanges, and where Graham's formula still works
- Japan analysis →: Book-value-rich market where the screen finds a very different opportunity set
- Germany analysis →: +3.77% excess vs DAX over 25 years, the European comparison
Data: Ceta Research (FMP financial data warehouse), 2000-2024. Universe: NYSE + NASDAQ + AMEX. Full methodology: METHODOLOGY.md. Past performance does not guarantee future results.


