
Graham Number Timing Across 14 Global Exchanges: Where Does Value

Graham Number Timing Across 14 Global Exchanges: Where Does Value Work?
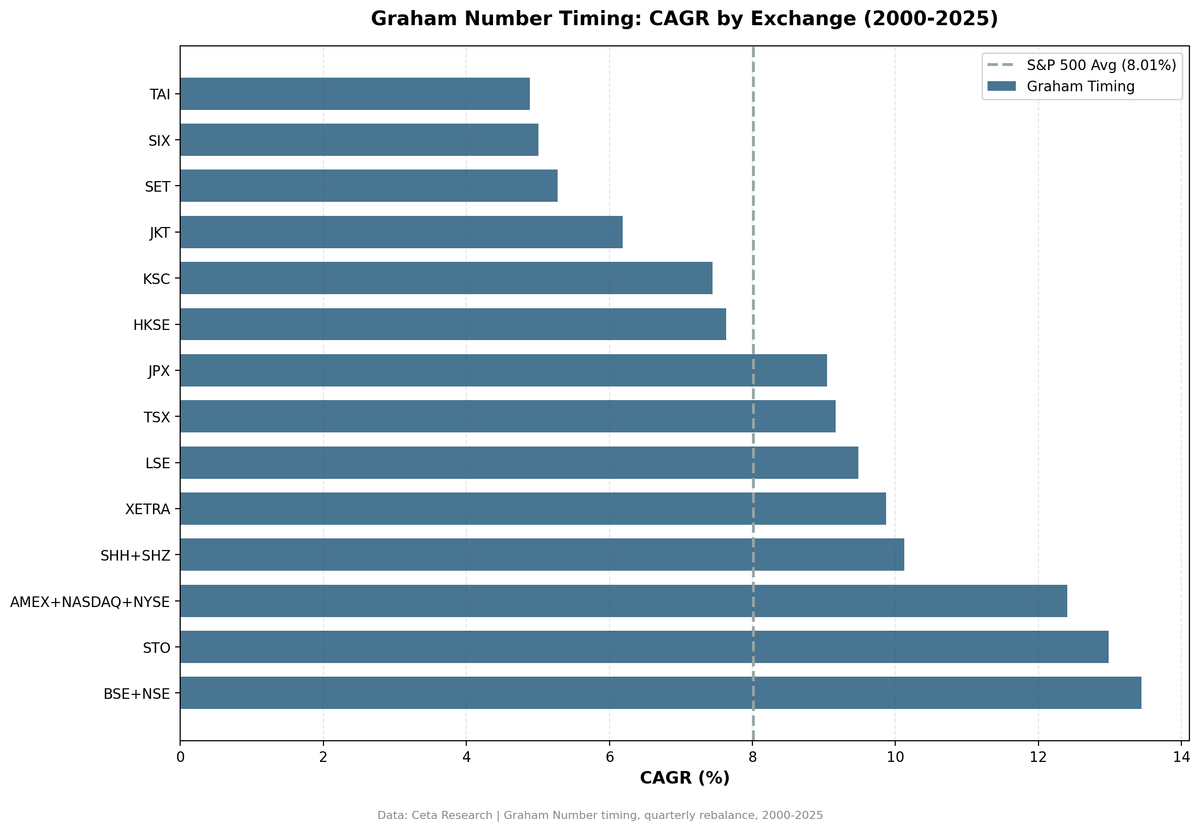
We tested Benjamin Graham's 1949 intrinsic value formula across 14 global stock exchanges over 25 years (2000-2025). The results reveal a clear pattern: value timing works in 8 of 14 markets, with strongest performance in developed value markets (Sweden, US, Germany, UK) and select emerging markets (India, China).
Contents
- The Formula
- Results Overview: 14 Exchanges Ranked
- Key Geographic Insights
- Where Graham Timing Excels
- Where Graham Timing Struggles
- The Down-Capture Story
- Cash Periods: Signal Availability
- Regional Insights
- North America
- Europe
- Asia (Developed)
- Asia (Emerging)
- Southeast Asia
- When to Use Graham Timing by Market
- The Academic Foundation
- Key Takeaways
- Methodology
The surprise: high-growth Asian markets (Taiwan, Thailand, Korea) consistently underperformed. When markets chase growth and ignore valuations, Graham's defensive value screen misses the rally.
The Formula
Graham's fair value equation:
Graham Number = sqrt(22.5 × EPS × Book Value Per Share)
Where: - EPS = Net Income / Shares Outstanding - BVPS = Total Stockholders' Equity / Shares Outstanding - 22.5 = Graham's constant (P/E of 15 × P/B of 1.5)
The signal: Buy stocks where Price/Graham < 1.0
When a stock trades at 80% of its Graham Number, you're buying intrinsic value at a 20% discount.
Results Overview: 14 Exchanges Ranked
| Exchange | CAGR | Excess | Sharpe | Down-Capture | Cash % |
|---|---|---|---|---|---|
| India (BSE+NSE) | 13.44% | +5.43% | 0.352 | 57.1% | 17.5% |
| Sweden (STO) | 12.98% | +4.97% | 0.544 | 72.3% | 12.6% |
| US (AMEX+NASDAQ+NYSE) | 12.40% | +4.39% | 0.458 | 88.8% | 0% |
| China (SHH+SHZ) | 10.13% | +2.11% | 0.269 | 41.7% | 20.4% |
| Germany (XETRA) | 9.87% | +1.86% | 0.358 | 87.8% | 4.9% |
| UK (LSE) | 9.48% | +1.47% | 0.329 | 74.2% | 0% |
| Canada (TSX) | 9.16% | +1.15% | 0.428 | 45.8% | 0% |
| Japan (JPX) | 9.05% | +1.03% | 0.330 | 65.4% | 13.6% |
| Hong Kong (HKSE) | 7.64% | -0.38% | 0.221 | 87.7% | 12.6% |
| Korea (KSC) | 7.44% | -0.57% | 0.297 | 47.3% | 21.4% |
| Indonesia (JKT) | 6.19% | -1.82% | 0.198 | 25.0% | 43.7% |
| Thailand (SET) | 5.28% | -2.73% | 0.151 | 70.9% | 20.4% |
| Switzerland (SIX) | 5.01% | -3.01% | 0.211 | 57.6% | 20.4% |
| Taiwan (TAI) | 4.88% | -3.13% | 0.154 | 56.9% | 28.2% |
Benchmark: SPY 8.01% CAGR | All excess returns vs SPY
Winners: 8 of 14 exchanges beat SPY (57% success rate)
Key Geographic Insights
Where Graham Timing Excels
1. Developed value markets (Sweden, US, Germany, UK)
These markets share common traits: - Strong corporate governance - Transparent financial reporting - Defensive sector mix (industrials, consumer staples, utilities) - Mature economies where value cycles matter
Sweden's 0.544 Sharpe (best globally) reflects Nordic corporate quality. US's 0% cash (fully invested) shows Graham signals always fire in deep, liquid markets. Germany's 87.8% down-capture means you capture most losses, but the 1.86% excess still justifies the strategy.
2. Select emerging markets (India, China)
India's +5.43% excess (best globally) benefits from: - Lower market efficiency (mispricing persists longer) - Strong GDP growth (6-8% CAGR over period) - 57.1% down-capture (excellent downside protection)
China's +2.11% excess with 41.7% down-capture (best globally) shows defensive positioning works even in volatile A-share markets.
3. Resource economies with quality filters (Canada, Japan)
Canada's +1.15% excess with 45.8% down-capture reflects defensive positioning in a resource-heavy economy. Japan's +1.03% excess confirms Graham's formula works in low-growth, value-oriented markets.
Where Graham Timing Struggles
1. High-growth Asian markets (Taiwan, Thailand, Korea)
Taiwan: -3.13% excess, 28.2% cash Thailand: -2.73% excess, 20.4% cash Korea: -0.57% excess, 21.4% cash
These markets chase growth, not value. When electronics exporters (Taiwan), tourism (Thailand), and tech conglomerates (Korea) command premium valuations, Graham's defensive screen misses the rally.
The 20-28% cash periods confirm: in growth-driven markets, few stocks trade below intrinsic value based on earnings and book value alone.
2. Switzerland (mature, expensive)
Switzerland's -3.01% excess with 20.4% cash reflects a market where quality commands persistent premiums. Nestle, Roche, and Novartis rarely trade below Graham Number, they're perpetually expensive because they're perpetually good.
3. Indonesia (high cash drag)
Indonesia's 43.7% cash (highest globally) means the signal fires only 56% of the time. When invested, down-capture is excellent (25.0%), but the cash drag kills alpha. Thin universe + quality filters = too few stocks qualify.
The Down-Capture Story
Best downside protection: - China: 41.7% (captured only 42% of SPY's losses) - Canada: 45.8% (captured only 46% of losses) - India: 57.1% (captured only 57% of losses)
Worst downside protection: - US: 88.8% (captured 89% of losses, momentum exposure) - Hong Kong: 87.7% (captured 88% of losses) - Germany: 87.8% (captured 88% of losses)
The pattern: defensive emerging markets (China, India) and resource economies (Canada) dodge crashes better than momentum-driven developed markets (US, Hong Kong, Germany).
Cash Periods: Signal Availability
Always invested (0% cash): - US, UK, Canada
Deep, liquid markets with 3,000+ stocks always have 30+ qualifying stocks below Graham Number.
Moderate cash (10-20%): - Sweden (12.6%), Japan (13.6%), Hong Kong (12.6%), India (17.5%), China (20.4%), Thailand (20.4%), Switzerland (20.4%), Korea (21.4%)
Signals fire 80-90% of the time. Cash periods reflect overheated markets when valuations stretch.
High cash (>25%): - Taiwan (28.2%), Indonesia (43.7%)
Signals fire only 56-72% of the time. Thin universe + growth premiums = few value opportunities.
Regional Insights
North America
US: Best developed market (+4.39%), but high down-capture (88.8%) means momentum risk Canada: Defensive resource play (+1.15%, 45.8% down-capture)
Europe
- Sweden: Best risk-adjusted (0.544 Sharpe, +4.97%)
- Germany: Solid alpha (+1.86%) despite high down-capture (87.8%)
- UK: Steady performer (+1.47%, 0% cash)
- Switzerland: Premium valuations = persistent underperformance (-3.01%)
Asia (Developed)
Japan: Mature value market (+1.03%, 65.4% down-capture) Hong Kong: Borderline (-0.38%, high down-capture 87.7%)
Asia (Emerging)
- India: Best globally (+5.43%, 57.1% down-capture)
- China: Excellent downside protection (+2.11%, 41.7% down-capture)
- Taiwan/Thailand/Korea: Growth > value = persistent underperformance
Southeast Asia
Indonesia: Thin universe = high cash drag (-1.82%, 43.7% cash)
When to Use Graham Timing by Market
Recommended markets (positive excess, reasonable cash): - India: Best alpha, excellent down-capture (accept 17.5% cash drag) - Sweden: Best risk-adjusted (0.544 Sharpe) - US: Highest CAGR, always invested (accept 88.8% down-capture) - Germany/UK: Solid alpha in European value markets - China: Best downside protection (41.7% down-capture) - Canada/Japan: Defensive positioning in mature markets
Avoid (persistent underperformance or high cash drag): - Taiwan/Thailand/Korea: Growth markets don't reward value timing - Switzerland: Quality premiums persist, signals rarely fire - Indonesia: 43.7% cash drag kills alpha - Hong Kong: Borderline (-0.38%), high down-capture (87.7%)
The Academic Foundation
Benjamin Graham (1949): The Intelligent Investor introduced the Graham Number as a conservative valuation metric for defensive investors.
Fama & French (1998): "Value Versus Growth: The International Evidence" showed value stocks outperformed growth stocks in 12 of 13 international markets, earning 7.68% annual premiums on average.
Our results confirm Fama-French's global value premium exists in 8 of 14 markets (57%), but with crucial geographic nuance: value works best in developed markets with value-oriented cultures (Sweden, US, Germany, UK) and emerging markets with lower efficiency (India, China).
Asness, Moskowitz, Pedersen (2013): "Value and Momentum Everywhere" showed value strategies work across asset classes and geographies, though premiums vary by market structure.
The down-capture variance (41.7% in China vs 88.8% in US) confirms Asness et al.'s finding that value's defensive characteristics vary by market. Emerging markets with less momentum exposure show better downside protection.
Key Takeaways
What worked globally: - 8 of 14 markets beat SPY (57% success rate) - India best (+5.43%), Sweden best risk-adjusted (0.544 Sharpe) - Down-capture ranges 25-89% (strategy dodges crashes in emerging markets)
What didn't work: - High-growth Asian markets (Taiwan -3.13%, Thailand -2.73%, Korea -0.57%) - Premium valuation markets (Switzerland -3.01%) - Thin universe markets (Indonesia 43.7% cash)
- Geographic strategy: -
- Developed value markets: Use Graham timing in Sweden, US, Germany, UK -
- Emerging markets: India and China show best results -
- Growth markets: Avoid Taiwan, Thailand, Korea (value doesn't work)
Portfolio construction across markets: - Overweight: India (best alpha) + Sweden (best Sharpe) + US (always invested) - Underweight: Taiwan/Thailand/Korea/Switzerland (persistent underperformance)
Methodology
- Universe: 14 global exchanges (NYSE/NASDAQ/AMEX, BSE/NSE, XETRA, LSE, TSX, JPX, STO, SHH/SHZ, HKSE, KSC, TAI, SET, SIX, JKT)
- Period: 2000-01-01 to 2025-10-01 (103 quarters, 25 years)
- Signal: Price < Graham Number (sqrt(22.5 × EPS × BVPS))
- Quality filters: ROE > 10%, Net Income > 0, Total Equity > 0, market cap thresholds per exchange
- Portfolio: Top 30 stocks by deepest discount to Graham Number, equal weight
- Rebalancing: Quarterly (Jan/Apr/Jul/Oct)
- Transaction costs: Exchange-specific models (5-15 bps round-trip)
- Currency: Local currency returns (INR for India, SEK for Sweden, USD for US, etc.)
- Benchmark: SPY total return (for global comparison)
Full backtest code: github.com/ceta-research/backtests/graham-timing
Part of a Series: US | Sweden | India | Global | US | Switzerland | Sweden | Japan
Run It Yourself
Explore the data behind this analysis on Ceta Research. Query our financial data warehouse with SQL, build custom screens, and run your own backtests across 70,000+ stocks on 20 exchanges.
Data: Ceta Research | FMP fundamental data warehouse | 14 exchanges, 25-year backtest (2000-2025)


