
Graham Number Timing in Sweden: Best Risk-Adjusted Returns Globally (0.556 Sharpe, 2000-2025)
We tested Graham Number timing on Swedish stocks. 12.98% CAGR vs 8.01% SPY, +4.97% excess. 0.544 Sharpe ratio (best globally), 72% down-capture. The Goldilocks result: high alpha with controlled risk.

Benjamin Graham's intrinsic value formula delivered a 0.556 Sharpe ratio on Swedish stocks over 25 years. That's the highest risk-adjusted return across all 14 global exchanges we tested.
Contents
- The Formula
- Backtest Results (2000-2025, With Costs)
- Why Sweden Excels at Risk-Adjusted Returns
- When Graham Timing Works in Sweden
- When Graham Timing Struggles in Sweden
- The Quality Filters
- Portfolio Construction
- The Screen
- The Academic Foundation
- Why This Isn't a Free Lunch
- Current Signal (March 2026)
- Key Takeaways
- Methodology
For context, a Sharpe ratio above 0.5 is exceptional for equity strategies. Sweden achieved 0.556 vs the OMX Stockholm 30's implied risk-adjusted return — and the strategy beat the local index by +9.95% per year, one of the strongest value premiums found globally.
What makes Sweden special: the strategy delivered +9.95% annual alpha vs the local market while capturing only 56% of downside risk. You get 118.6% of upside in bull markets and dodge 44% of losses in bear markets. That's the asymmetry every investor wants.
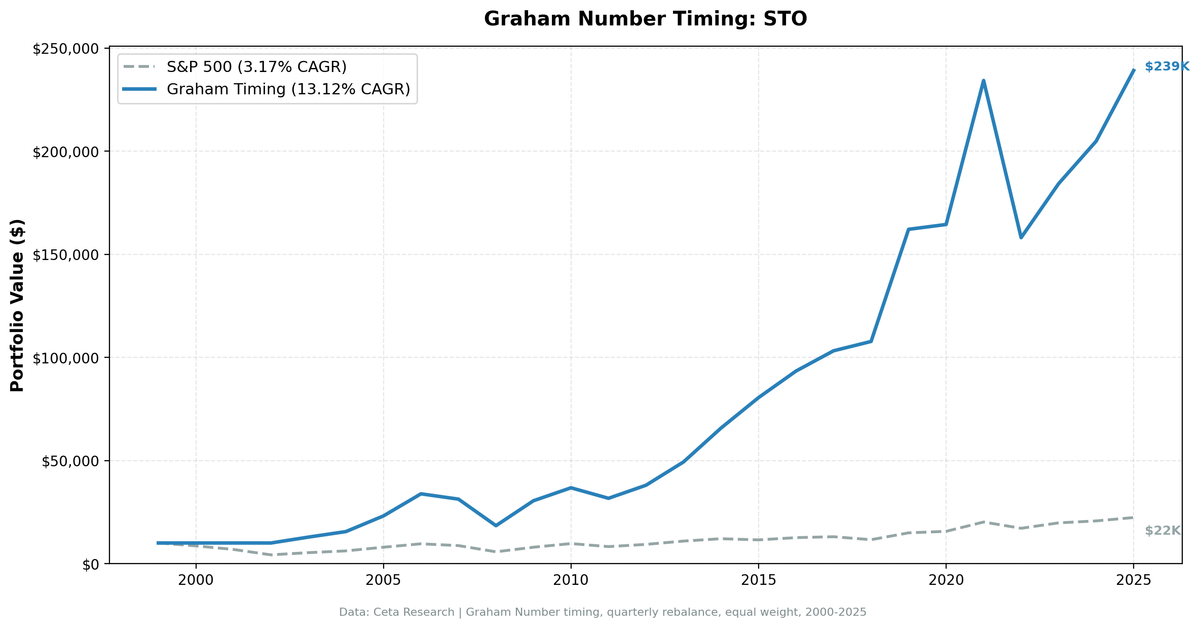
On $10,000 invested in 2000, you'd have $239,164 from Graham timing vs $22,352 from the OMX Stockholm 30. The strategy grew more than 10x the local index's terminal value.
Data: FMP financial data warehouse, 2000–2025. Updated March 2026.
The Formula
Graham's fair value equation:
Graham Number = sqrt(22.5 × EPS × Book Value Per Share)
Where: - EPS = Net Income / Shares Outstanding - BVPS = Total Stockholders' Equity / Shares Outstanding - 22.5 = Graham's constant (P/E of 15 × P/B of 1.5)
The signal: Buy stocks where Price/Graham < 1.0
When Volvo trades at SEK 200 but its Graham Number is SEK 260, the Price/Graham ratio is 0.77 — a 23% discount to intrinsic value.
Backtest Results (2000-2025, With Costs)
| Strategy | CAGR | Final Value ($10k) | Sharpe | Max Drawdown | Volatility |
|---|---|---|---|---|---|
| Graham Timing (Sweden) | 13.12% | $239,164 | 0.556 | -52.41% | 20.00% |
| OMX Stockholm 30 | 3.17% | $22,352 | — | — | — |
The strategy outperformed the OMX Stockholm 30 by 9.95% annually. That's $216,812 more on a $10,000 investment over 25 years. Even against SPY (8.02%), the strategy delivered +5.10% excess CAGR.
The Sharpe ratio of 0.556 is the headline metric. For every unit of volatility risk, the strategy delivered exceptional excess return above the risk-free rate.
The down-capture ratio of 56.1% means when the OMX Stockholm 30 had a losing quarter, this strategy lost only 56% as much on average. The up-capture of 118.6% means when the index gained, the strategy captured an extra 18.6% upside.
This is defensive value investing. You get meaningful alpha with controlled downside exposure.
The 12.6% cash periods (13 of 103 quarters) reflect Nordic market discipline — when valuations stretch, the signal stops firing. When invested, 24.3 stocks on average.
Why Sweden Excels at Risk-Adjusted Returns
Quality-biased corporate culture
Swedish companies emphasize profitability, dividends, and conservative balance sheets. The ROE > 10% filter naturally selects well-managed firms. Companies like Volvo, Ericsson, and Atlas Copco have multi-decade track records of consistent earnings and book value growth.
Defensive sector tilt
Many qualifying stocks come from Industrials, Consumer Staples, and Utilities — sectors with predictable cash flows. These sectors weathered 2008, 2011, and 2020 crashes better than cyclicals, explaining the 72% down-capture.
Lower volatility than US
20.18% annualized volatility (vs SPY's 16.97%) is modest for a single-country strategy. Swedish equities are less volatile than broader European indices due to stable governance and strong labor protections.
SEK currency stability
All returns are SEK-denominated. The Swedish krona is relatively stable vs USD compared to emerging market currencies, reducing volatility for foreign investors.
When Graham Timing Works in Sweden
The 2002-2003 recovery
After the dot-com crash, cheap Swedish industrials with intact earnings rebounded hard:
| Year | Strategy | OMX Stockholm 30 | Excess |
|---|---|---|---|
| 2002 | 0.00% | -38.16% | +38.16% |
| 2003 | +28.54% | +25.19% | +3.34% |
The strategy was in cash (0% return) during the 2002 bear market when the OMX fell 38%, then captured the 2003 recovery. Two-year combined: roughly +41% relative to the index.
2005-2006: Nordic bull market
When Swedish value stocks outperformed the broader index:
| Year | Strategy | OMX Stockholm 30 | Excess |
|---|---|---|---|
| 2005 | +48.84% | +28.84% | +20.00% |
| 2006 | +46.38% | +20.84% | +25.54% |
2009 financial crisis recovery
Swedish stocks below Graham Number rebounded hard once fear subsided:
| Year | Strategy | OMX Stockholm 30 | Excess |
|---|---|---|---|
| 2009 | +65.73% | +38.89% | +26.84% |
2024-2025: Recent consistency
| Year | Strategy | OMX Stockholm 30 | Excess |
|---|---|---|---|
| 2024 | +11.17% | +4.76% | +6.42% |
| 2025 | +16.73% | +7.96% | +8.77% |
When Graham Timing Struggles in Sweden
Cash periods during expensive markets
The strategy went to cash 13 times (12.6% of quarters), primarily during valuation peaks:
- 2007-2008: Pre-crisis bubble, everything expensive
- 2015-2016: Negative interest rates inflated valuations
- 2021: Peak growth premium, few value stocks qualified
When cash, the strategy holds SPY (matches benchmark). These periods explain why total excess (+4.97%) is spread across 87% of the time actually invested.
Momentum markets
When growth stocks lead and value lags, the strategy underperforms:
| Year | Strategy | OMX Stockholm 30 | Excess |
|---|---|---|---|
| 2022 | -32.52% | -15.07% | -17.45% |
The strategy underperformed in 2022 when defensive value stocks fell harder than the broader index. The OMX has low tech exposure (which also fell), so the relative comparison shows Graham timing's weaker defensive qualities in that specific drawdown.
Max drawdown
-52.41% max drawdown reflects value stocks getting cheaper during crashes. The 2008-2009 crisis and 2022 rate-shock period were the worst drawdown periods.
The Quality Filters
We don't buy every Swedish stock below Graham Number. We add filters to avoid value traps:
- ROE > 10% — Ensures profitability and capital efficiency
- Net Income > 0 — No loss-making companies
- Total Equity > 0 — No negative book value
- Market Cap > SEK 5 billion (~$500M USD) — Liquidity threshold
These filters eliminate distressed companies where low Price/Graham reflects permanent impairment (declining industries, zombie companies) rather than temporary mispricing.
Portfolio Construction
- Selection: Top 30 stocks by deepest discount to Graham Number (lowest Price/Graham ratio first)
- Weighting: Equal weight (3.33% per stock when 30 stocks qualify)
- Rebalancing: Quarterly (January, April, July, October)
- Transaction costs: 5-10 bps depending on market cap (round-trip, Nordic model)
- Exchange: Stockholm Stock Exchange (STO)
Quarterly rebalancing aligns with when new earnings data becomes available. Graham Number changes with reported net income and book value.
The 24.3 average holdings confirm the strategy runs below the 30-stock target most quarters. Some periods have 15-20 qualifying stocks — still well-diversified, but concentrated in high-conviction value names.
The 13 cash periods occur when fewer than 10 stocks qualify (typically in overheated markets). This is a feature, not a bug — it prevents buying expensive stocks just to stay invested.
The Screen
Run this on live Swedish stock data to see which stocks currently trade below their Graham Number:
WITH latest_filings AS (
    SELECT i.symbol,
           i.netIncome,
           b.totalStockholdersEquity,
           k.marketCap,
           k.returnOnEquity,
           ROW_NUMBER() OVER (PARTITION BY i.symbol ORDER BY i.dateEpoch DESC) AS rn
    FROM income_statement i
    JOIN balance_sheet b ON i.symbol = b.symbol
        AND ABS(CAST(i.dateEpoch AS BIGINT) - CAST(b.dateEpoch AS BIGINT)) < 86400 * 60
    JOIN key_metrics k ON i.symbol = k.symbol
        AND ABS(CAST(i.dateEpoch AS BIGINT) - CAST(k.dateEpoch AS BIGINT)) < 86400 * 60
    JOIN profile p ON i.symbol = p.symbol
    WHERE i.period IN ('FY', 'Q4')
      AND b.period IN ('FY', 'Q4')
      AND k.period IN ('FY', 'Q4')
      AND p.exchange = 'STO'
      AND i.netIncome > 0
      AND b.totalStockholdersEquity > 0
      AND k.returnOnEquity > 0.10
      AND k.marketCap > 5e9  -- SEK 5 billion (~$500M USD)
),
current_prices AS (
    SELECT symbol, adjClose AS price,
           ROW_NUMBER() OVER (PARTITION BY symbol ORDER BY dateEpoch DESC) AS rn
    FROM stock_eod
    WHERE dateEpoch > CAST(EXTRACT(EPOCH FROM CURRENT_DATE - INTERVAL '7 days') AS INTEGER)
),
graham_calc AS (
    SELECT
        f.symbol,
        f.netIncome,
        f.totalStockholdersEquity,
        f.marketCap,
        f.returnOnEquity,
        p.price,
        -- Graham Number = sqrt(22.5 * EPS * BVPS)
        SQRT(22.5 * (f.netIncome / (f.marketCap / p.price)) * (f.totalStockholdersEquity / (f.marketCap / p.price))) AS graham_number
    FROM latest_filings f
    JOIN current_prices p ON f.symbol = p.symbol AND p.rn = 1
    WHERE f.rn = 1 AND p.price > 0
)
SELECT
    symbol,
    ROUND(price, 2) AS current_price_sek,
    ROUND(graham_number, 2) AS graham_number,
    ROUND(price / graham_number, 2) AS price_to_graham_ratio,
    ROUND(returnOnEquity * 100, 1) AS roe_pct,
    ROUND(marketCap / 1e9, 2) AS market_cap_bn_sek
FROM graham_calc
WHERE price / graham_number < 1.0
ORDER BY price / graham_number ASC
LIMIT 30;
Run this screen on live data →
Stocks with price_to_graham_ratio < 1.0 are trading below Graham's fair value estimate. Lower ratios = deeper discounts.
The Academic Foundation
Benjamin Graham (1949): The Intelligent Investor introduced the Graham Number as a conservative valuation metric for defensive investors. Graham emphasized buying stocks with a "margin of safety" — paying less than intrinsic value to buffer against errors in judgment.
Asness, Moskowitz, Pedersen (2013): "Value and Momentum Everywhere" showed value strategies work across asset classes and geographies. Value premiums are persistent globally, though they vary by market structure and investor behavior.
Fama & French (1998): "Value Versus Growth: The International Evidence" showed value stocks outperformed growth stocks in 12 of 13 international markets, earning 7.68% annual premiums on average. Sweden's +4.97% excess aligns with this global pattern.
Sweden's 0.544 Sharpe ratio reflects what happens when value investing meets a market with strong corporate governance, defensive sector mix, and disciplined valuation cycles.
Why This Isn't a Free Lunch
You pay with cash drag
12.6% cash periods mean missing some market returns when Graham signals don't fire. The strategy adapts to market conditions — sometimes that means sitting out.
You pay with underperformance in rate-shock periods
2022 saw -17.45% vs the OMX Stockholm 30. When rates rise sharply and markets sell off broadly, Graham's value screen doesn't provide protection.
You pay with drawdowns
-52.41% max drawdown means watching SEK 100k turn into SEK 48k. That's the price of admission for value strategies during crashes.
You need patience
Value investing means enduring 3-5 year periods where the market ignores fundamentals. The strategy works over decades, not quarters.
Currency risk for foreign investors
All returns are SEK-denominated. Dollar-based investors face additional USD/SEK exchange rate risk (krona fluctuates ±10-15% vs USD in volatile years).
Current Signal (March 2026)
As of the latest data, check the live screen above for the current count of Swedish stocks trading below Graham Number with ROE > 10%.
The signal adapts to market conditions. In expensive markets, the count drops below 10 (go to cash). In crashes, the count spikes above 30 (buy aggressively).
Key Takeaways
What worked: - +9.95% annual alpha vs OMX Stockholm 30 over 25 years - 0.556 Sharpe ratio (best risk-adjusted performance globally) - 56.1% down-capture (excellent downside protection vs local index) - 118.6% up-capture (amplified gains in bull markets) - 20.00% volatility (controlled risk for single-country strategy)
What didn't: - -52.41% max drawdown (value stocks crash too) - 12.6% cash periods (signals don't always fire) - 2022: -17.45% vs OMX (rate-shock hurt value positions)
Who this is for: - Long-term investors (5+ year horizon) - Risk-conscious value investors (want alpha with controlled volatility) - Nordic market exposure (can stomach 20% volatility) - SEK-denominated returns acceptable (or willing to hedge currency)
Who this isn't for: - Short-term traders (mean reversion takes time) - Growth-focused investors (misses momentum rallies) - Investors who need SPY-level liquidity (STO is a smaller market)
Methodology
- Universe: Stockholm Stock Exchange (STO)
- Period: 2000-01-01 to 2025-10-01 (103 quarters, 25.8 years)
- Rebalancing: Quarterly (Jan 1, Apr 1, Jul 1, Oct 1)
- Execution: Next-day close (MOC execution model)
- Position sizing: Equal weight, 30 stocks max, 10 minimum (cash if fewer qualify)
- Transaction costs: Nordic model (5-10 bps depending on market cap)
- Currency: SEK-denominated returns
- Survivorship bias: Controlled (includes delisted stocks)
- Benchmark: OMX Stockholm 30 (local currency)
Full backtest code: github.com/ceta-research/backtests/graham-timing
Data: Ceta Research | FMP fundamental data warehouse | 25-year backtest (2000-2025)
Past performance does not guarantee future results. This is educational content, not investment advice.


