High Dividend Yield Screen: 10.52% CAGR With Quality Filters (25-Year Backtest)
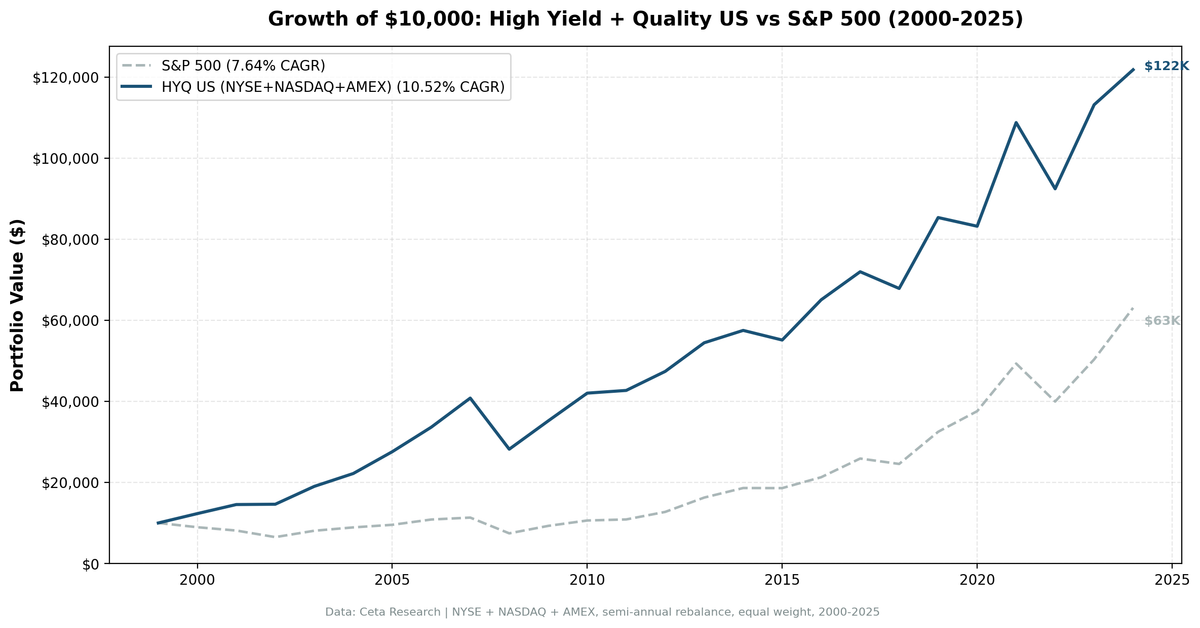
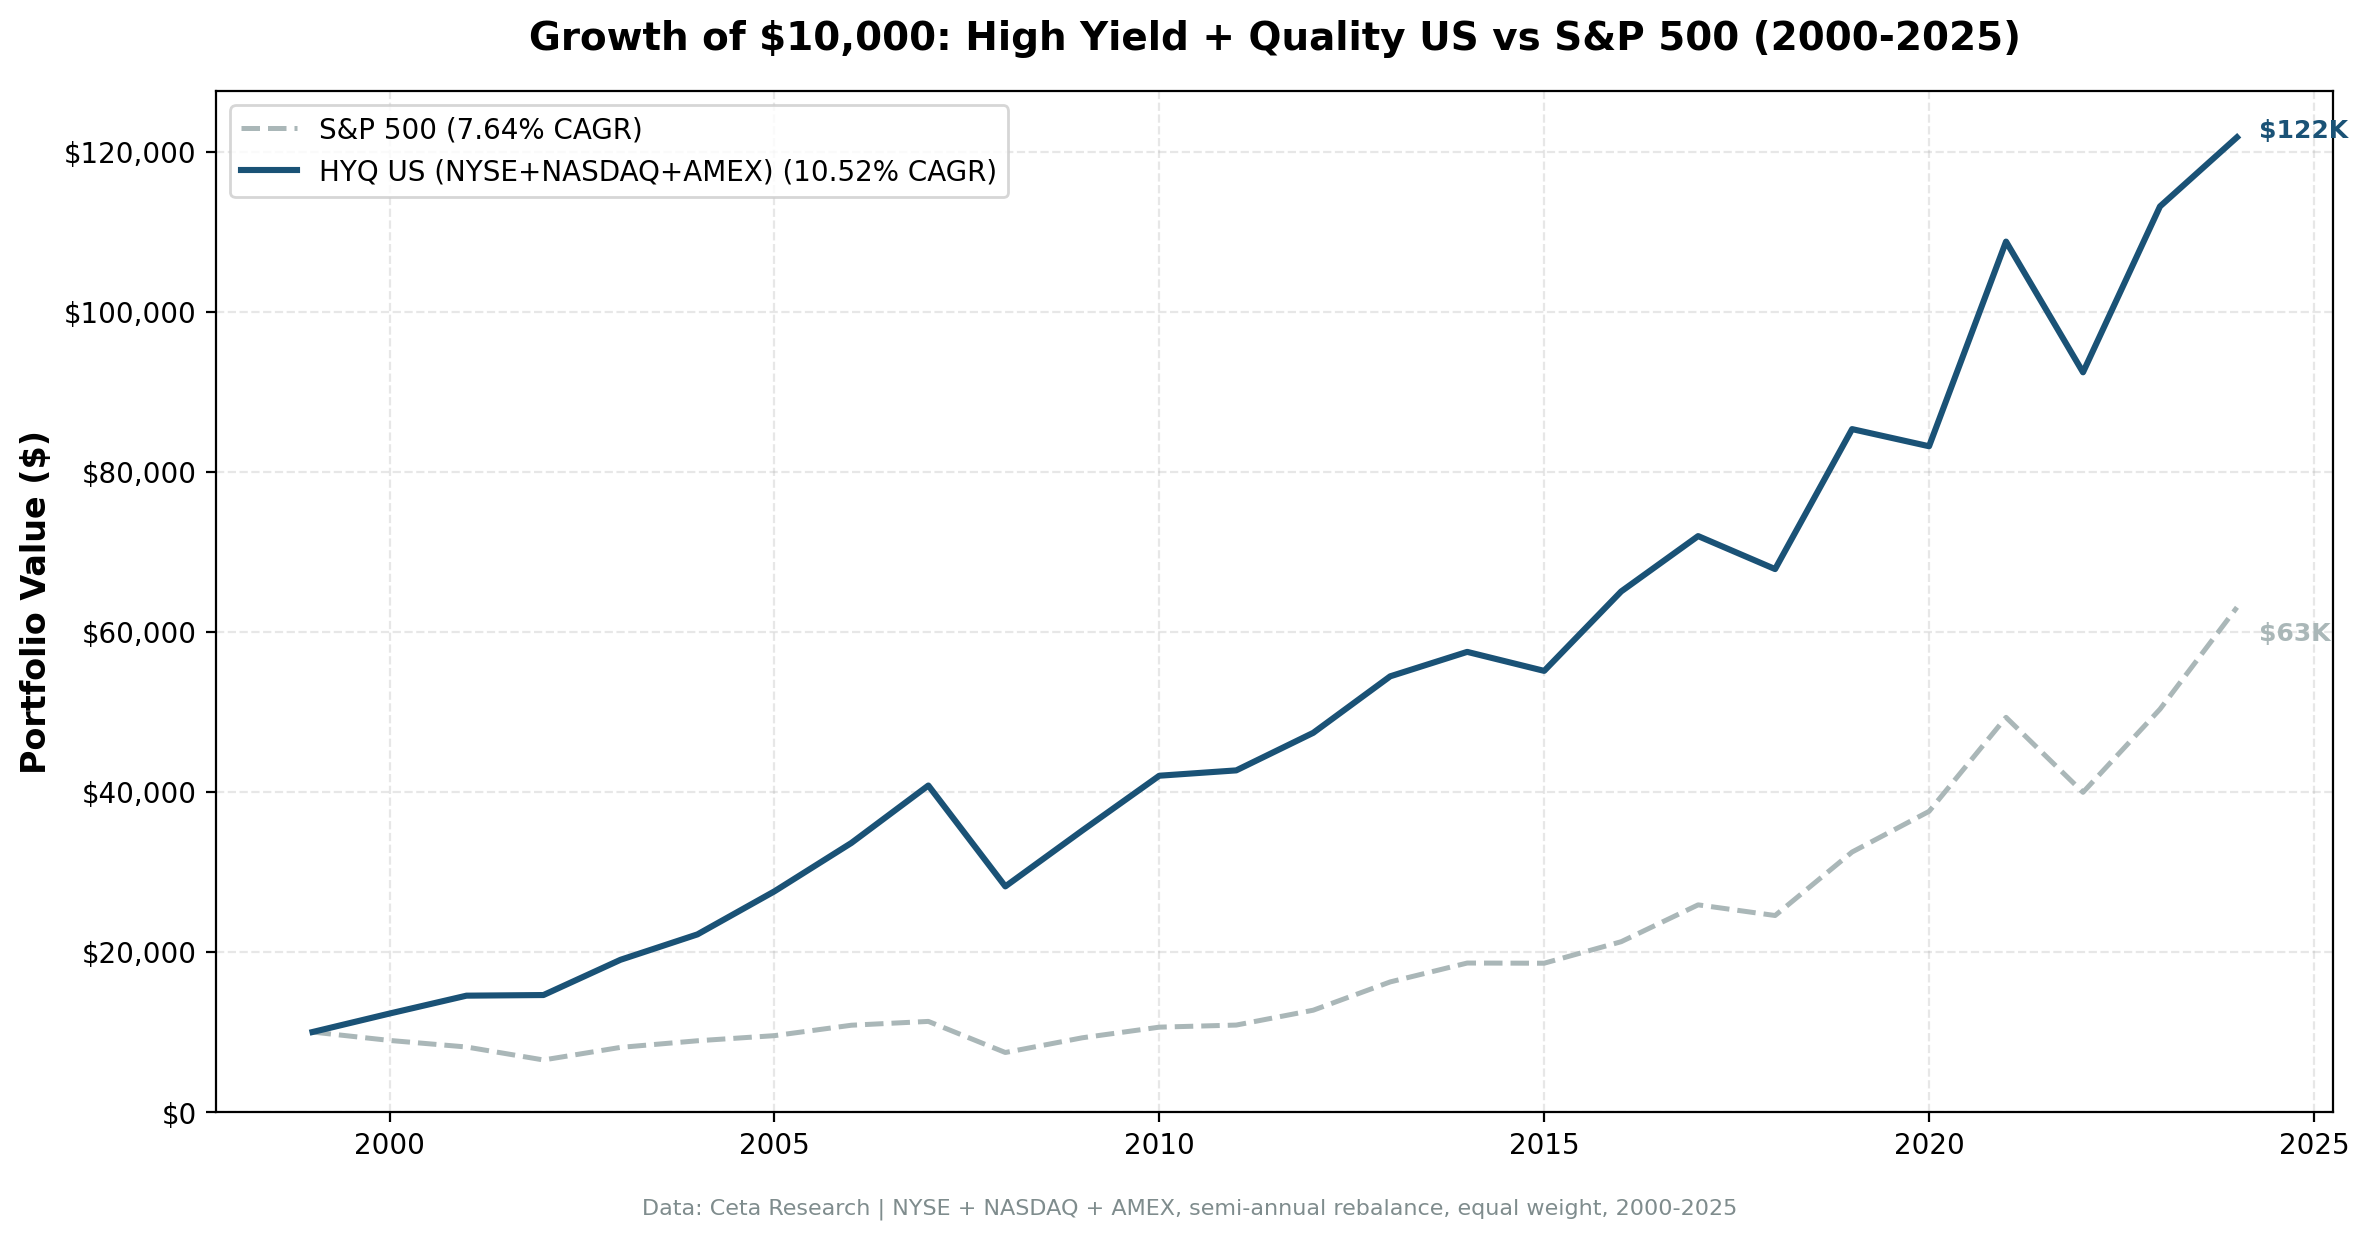
We backtested a high dividend yield screen with quality filters (ROE, FCF, debt) across 25 years of US stock data. 10.52% CAGR vs 7.64% for the S&P 500, with a 0.567 Sharpe ratio and +5.17% Jensen alpha.

High Dividend Yield Screen: 10.52% CAGR With Quality Filters (25-Year US Backtest)
High dividend yield stocks get a bad reputation. And often deservedly so. Chasing yield without checking fundamentals leads to yield traps: companies paying unsustainable dividends right before they cut. Filtering for quality changes the picture. We backtested a high-yield screen with ROE, debt, and cash flow filters across 25 years of US stock data. The result: 10.52% CAGR vs 7.64% for the S&P 500, with a Sharpe ratio of 0.567 (vs 0.322 for SPY) and a Jensen's alpha of +5.17%. The strategy beat SPY in 13 of 25 years, with the largest excess returns clustered in the 2000-2007 value-led decade.
Contents
- Method
- Signal
- Why Quality Filters Matter
- Results
- Annual Returns
- When It Works
- When It Struggles
- The Simple Screen
- Limitations
- Takeaway
- Part of a Series
- Run This Screen Yourself
- References
Data: FMP financial data warehouse, 2000-2025. Updated May 2026.
Method
Data source: Ceta Research (FMP financial data, 70K+ stocks) Universe: All US stocks (NYSE + NASDAQ + AMEX) with market cap > $1B Period: 2000-2025 (25 years) Rebalancing: Annual (July) Execution: Next-day close (MOC). Signal computed on rebalance date, trades execute at the following session's close. Transaction costs: Size-tiered (0.1% large cap, 0.3% mid cap, 0.5% small cap, one-way)
Signal
| Filter | Threshold | Why |
|---|---|---|
| Dividend yield | 4% to 15% | Target high payers, cap at 15% to exclude distressed |
| Payout ratio | 0% to 80% | Sustainable dividends, room to reinvest |
| Free cash flow | > 0 | Cash backing the dividend |
| Return on equity | > 8% | Profitable business, not a dying one |
| Debt to equity | < 2.0 | Not overleveraged |
| Market cap | > $1B | Liquid, reliable data |
Portfolio: Top 30 stocks by highest dividend yield. Equal weight. Hold cash if fewer than 10 qualify (never happened in the US over 25 years).
The yield floor of 4% targets stocks paying meaningfully above market average. The 15% cap filters out distressed situations where the price has collapsed, inflating the yield artificially. Quality filters (ROE, FCF, payout, debt) separate sustainable dividends from yield traps.
Why Quality Filters Matter
A high dividend yield can mean two things: 1. The company is shareholder-friendly and generating excess cash (opportunity) 2. The stock price has crashed and the dividend is about to be cut (trap)
Without filters, you're buying both. Dogs of the Dow works because the Dow 30 are already quality-filtered by index membership. When you screen the full market, you need to do the filtering yourself.
Our quality gates: - ROE > 8% eliminates struggling businesses. If a company can't earn 8% on equity, the high yield probably reflects poor fundamentals. - FCF > 0 ensures the dividend is backed by actual cash generation, not accounting tricks. - Payout < 80% means the company retains enough earnings to reinvest. A 95% payout ratio is a warning sign. - D/E < 2.0 screens out companies leveraging up to fund dividends.
Fama and French (1998) documented that high-yield stocks outperform as a value proxy across 13 international markets. The raw signal is noisy. Quality filters clean it up.
Results
| Metric | Strategy | S&P 500 |
|---|---|---|
| CAGR | 10.52% | 7.64% |
| Total Return | 1,118% | 531% |
| Max Drawdown | -30.90% | -34.90% |
| Volatility (annualized) | 15.02% | 17.51% |
| Sharpe Ratio | 0.567 | 0.322 |
| Sortino Ratio | 1.102 | 0.556 |
| Calmar Ratio | 0.340 | 0.219 |
| Win Rate (vs SPY) | 52% | -- |
| Up Capture | 93.1% | -- |
| Down Capture | 14.3% | -- |
| Beta | 0.593 | -- |
| Alpha (Jensen) | +5.17% | -- |
| Cash Periods | 0/25 | -- |
| Avg Stocks | 23.1 | -- |
The headline is the alpha figure: +5.17% Jensen's alpha after controlling for market beta. That's the share of returns the strategy generated above what its 0.593 beta to SPY would predict. Combined with a Sharpe of 0.567 (vs SPY's 0.322), the strategy delivered meaningfully better risk-adjusted returns over 25 years.
The portfolio captured 93% of SPY's upside and only 14% of its downside, with shallower drawdowns (-30.9% vs SPY's -34.9%). The lower beta and meaningful alpha together mean you got better returns with less volatility, not by taking more risk.
Zero cash periods across 25 years means the US market always had at least 10 qualifying high-yield stocks. The signal is well-calibrated for this market.
Annual Returns
| Year | Strategy | S&P 500 | Excess |
|---|---|---|---|
| 2000 | +23.1% | -10.5% | +33.6% |
| 2001 | +18.2% | -9.2% | +27.3% |
| 2002 | +0.5% | -19.9% | +20.5% |
| 2003 | +30.1% | +24.1% | +6.0% |
| 2004 | +16.7% | +10.2% | +6.5% |
| 2005 | +24.2% | +7.2% | +17.1% |
| 2006 | +21.9% | +13.7% | +8.3% |
| 2007 | +21.4% | +4.4% | +16.9% |
| 2008 | -30.9% | -34.3% | +3.4% |
| 2009 | +24.8% | +24.7% | +0.0% |
| 2010 | +19.5% | +14.3% | +5.2% |
| 2011 | +1.6% | +2.5% | -0.9% |
| 2012 | +11.0% | +17.1% | -6.1% |
| 2013 | +14.9% | +27.8% | -12.9% |
| 2014 | +5.6% | +14.5% | -8.9% |
| 2015 | -4.1% | -0.1% | -4.0% |
| 2016 | +18.0% | +14.4% | +3.5% |
| 2017 | +10.6% | +21.6% | -11.0% |
| 2018 | -5.7% | -5.2% | -0.6% |
| 2019 | +25.8% | +32.3% | -6.5% |
| 2020 | -2.5% | +15.6% | -18.1% |
| 2021 | +30.7% | +31.3% | -0.5% |
| 2022 | -15.0% | -19.0% | +4.0% |
| 2023 | +22.4% | +26.0% | -3.6% |
| 2024 | +7.6% | +25.3% | -17.6% |
When It Works
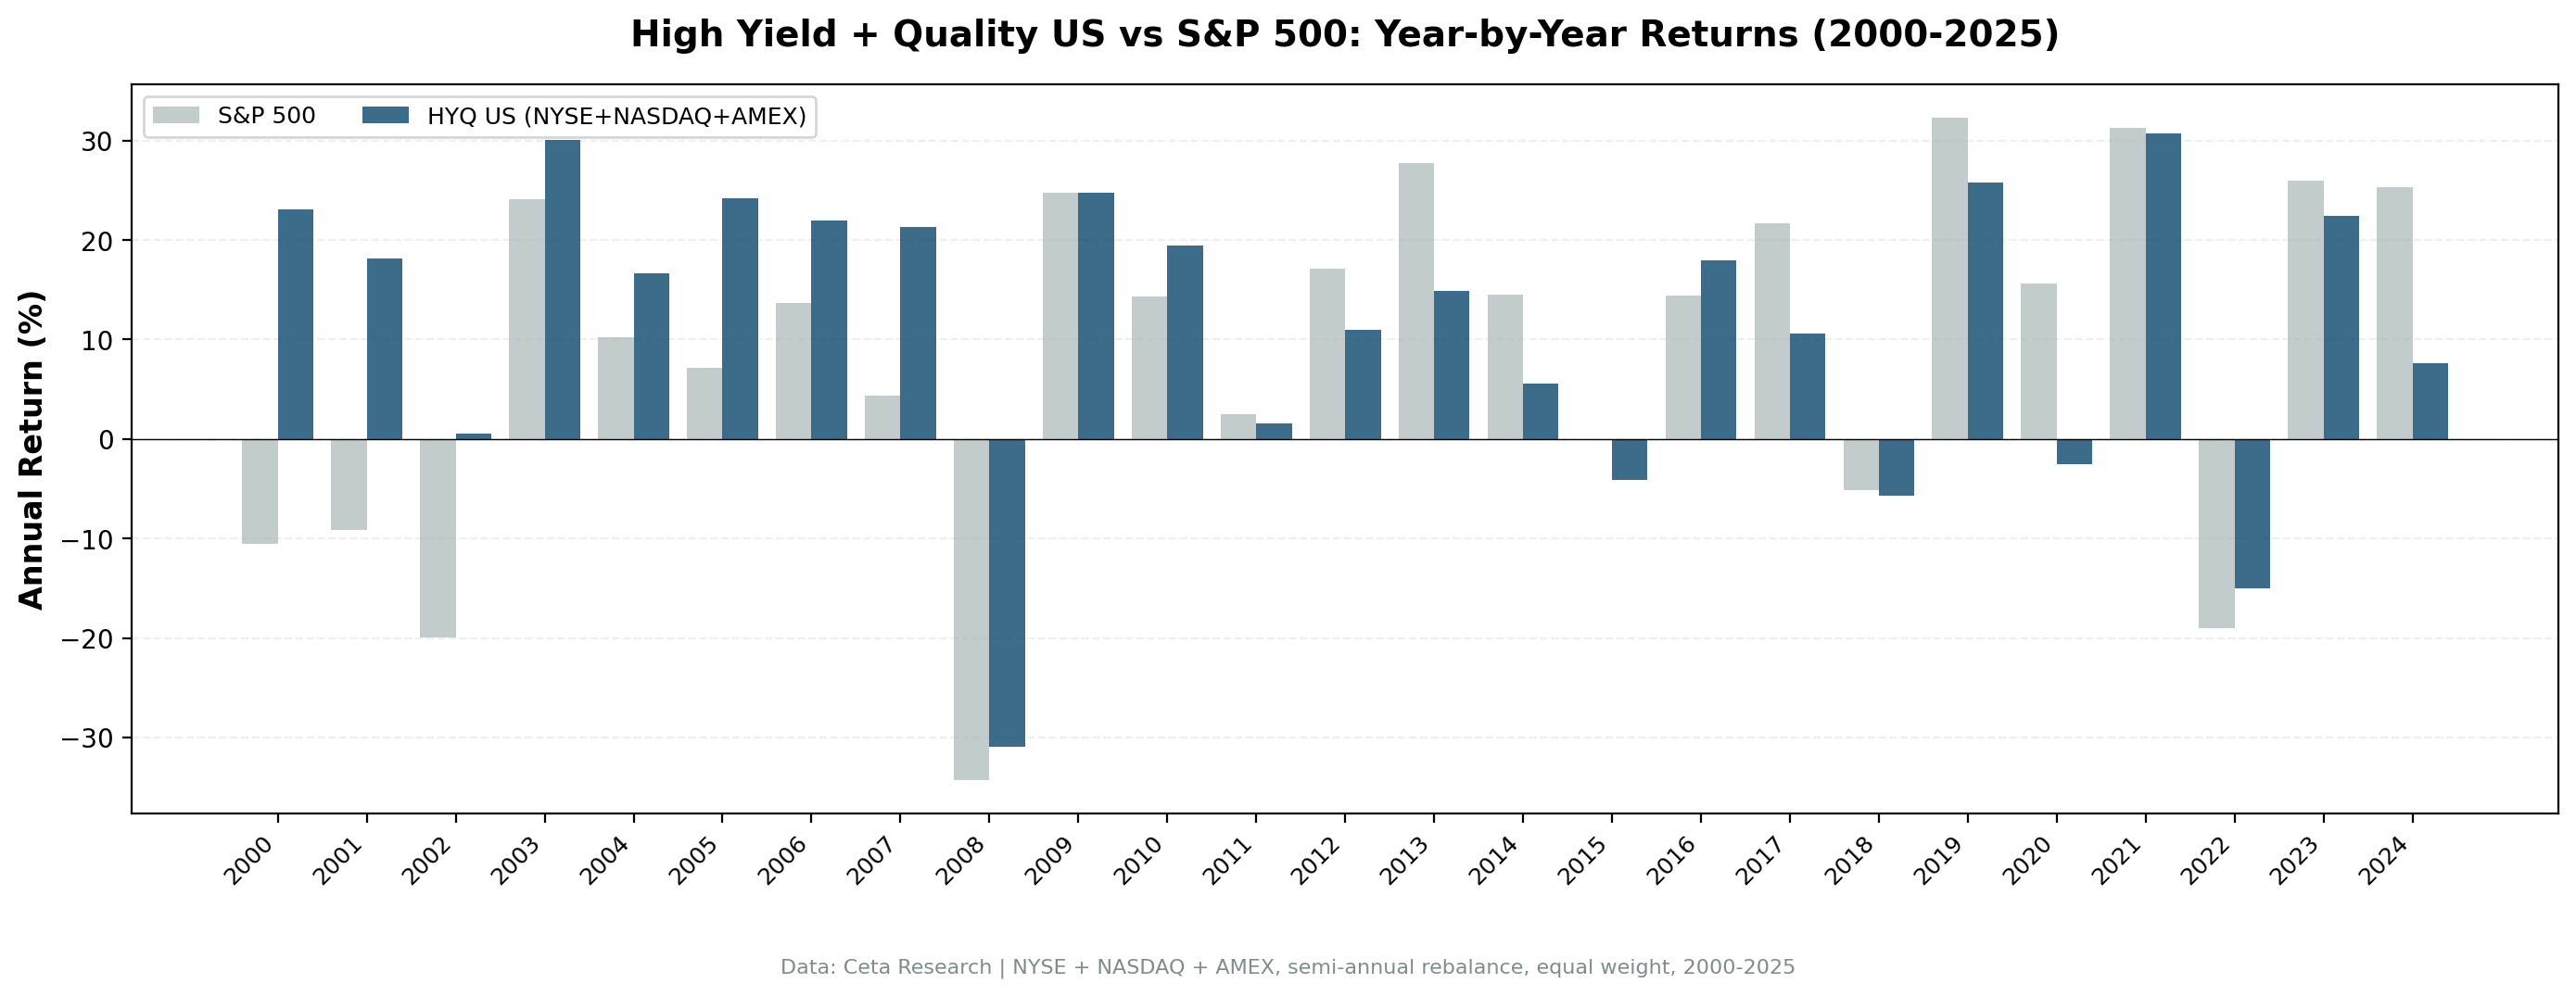
2000-2007 (the golden era): The strategy crushed the S&P 500 for eight straight years. During the dot-com bust, it returned +23.1% while SPY dropped -10.5%. Dividend payers held value while speculative growth imploded. The 2007 result (+21.4% vs SPY +4.4%) was the standout pre-crisis year: high-yield quality names ran while the broader market stalled ahead of the credit crunch. Cumulative excess return from 2000-2007 was over 130 percentage points.
2008 (crisis resilience): The strategy lost -30.9% in the financial crisis vs SPY's -34.3%, a 3.4-point edge. The quality filters kept the worst banks out, but high-yield names still got hit hard. Sharper protection appears in the up-capture and Sharpe numbers, not in individual crisis years.
2022 (inflation shock): -15.0% vs SPY -19.0%. Defensive sectors and steady dividend payers held up while growth and tech repriced.
Pattern: the strategy works best in value-friendly regimes, especially when expensive growth stocks reprice downward.
When It Struggles
2012-2015 (growth dominance): Four years of underperformance. The strategy stayed positive 3 of 4 years, but SPY ran harder. Growth stocks led the post-crisis recovery and momentum-driven markets left dividend payers behind. The 2013 gap (-12.9%) was the worst single year of relative underperformance during this stretch.
2017 (FAANG rally): +10.6% vs SPY's +21.6%. The market was driven by mega-cap tech stocks that don't pay meaningful dividends.
2020 (post-COVID growth surge): -2.5% vs SPY +15.6%. A -18.1 point gap. The strategy missed the tech-and-growth-led rebound. Dividend payers stayed depressed while speculative names rallied hardest.
2024 (AI rally): +7.6% vs SPY +25.3%. The widest single-year gap. AI-driven mega-cap tech dominated returns; high-yield quality names lagged badly.
Pattern: the strategy struggles during extended growth or momentum rallies when investors chase capital appreciation and ignore yield.
The Simple Screen
Find high-yield stocks passing all quality filters.
SELECT r.symbol, p.companyName, p.sector,
    ROUND(r.dividendYieldTTM * 100, 2) AS yield_pct,
    ROUND(r.dividendPayoutRatioTTM * 100, 1) AS payout_pct,
    ROUND(k.returnOnEquityTTM * 100, 1) AS roe_pct,
    ROUND(r.debtToEquityRatioTTM, 2) AS debt_equity,
    ROUND(k.marketCap / 1e9, 1) AS mktcap_bn
FROM financial_ratios_ttm r
JOIN key_metrics_ttm k ON r.symbol = k.symbol
JOIN profile p ON r.symbol = p.symbol
WHERE r.dividendYieldTTM BETWEEN 0.04 AND 0.15
  AND r.dividendPayoutRatioTTM BETWEEN 0 AND 0.80
  AND k.returnOnEquityTTM > 0.08
  AND (r.debtToEquityRatioTTM < 2.0
       OR r.debtToEquityRatioTTM IS NULL)
  AND k.marketCap > 1000000000
  AND p.exchange IN ('NYSE', 'NASDAQ', 'AMEX')
  AND p.isFund = false
  AND p.isEtf = false
  AND p.isActivelyTrading = true
ORDER BY r.dividendYieldTTM DESC
LIMIT 30
What this does: - dividendYieldTTM BETWEEN 0.04 AND 0.15 targets 4-15% yield. Below 4% isn't "high yield." Above 15% is almost certainly distressed. - dividendPayoutRatioTTM BETWEEN 0 AND 0.80 ensures the dividend is sustainable. - returnOnEquityTTM > 0.08 filters out businesses that can't earn a decent return. - debtToEquityRatioTTM < 2.0 keeps leverage manageable.
Limitations
Sector concentration: High-yield portfolios naturally overweight REITs, utilities, energy, and financials. These sectors pay higher dividends structurally. You're partly making a sector bet.
Interest rate sensitivity: High-yield stocks often behave like bond proxies. When rates rise, they can underperform as investors rotate into actual bonds. The 2013 "taper tantrum" and 2017-2019 rate cycle both hurt.
Dividend cuts not modeled: The backtest rebalances annually. If a company cuts its dividend mid-year, we don't exit until the next rebalance. In practice, you might want to monitor for cuts.
Survivorship bias: FMP data includes many delisted companies, but coverage of delistings is less complete than active companies. Some failed high-yield stocks may be missing from the dataset.
Point-in-time data: We use a 45-day filing lag assumption for annual data. The July rebalance date aligns with most companies having filed their annual reports, but exact availability varies.
Takeaway
High dividend yield investing works when you filter for quality. The raw signal (just buy high yield) is dangerous. Yield traps destroy returns. Adding ROE, FCF, payout, and debt filters transforms the strategy.
The US results are solid: +2.87% annual excess CAGR, +5.17% Jensen's alpha, 0.567 Sharpe vs SPY's 0.322. Lower volatility, lower drawdown, lower beta, better risk-adjusted returns over 25 years.
The tradeoff is extended periods of underperformance during growth-driven markets. The 2012-2015 stretch tested patience. The 2017-2024 period had more bad years than good, with 2020 and 2024 each producing 18-point gaps to the index. You need conviction to hold through those stretches.
If you can handle the tracking error, this is one of the simpler factor strategies to implement and maintain.
A note on data sources: The screens above use TTM (trailing twelve months) tables, which reflect current snapshots. The backtest numbers use historical tables (financial_ratios, key_metrics, cash_flow_statement) with point-in-time methodology, only using data available at the time of each simulated trade. These are different data sources: TTM for live screening, historical for backtesting.
Data: Ceta Research (FMP financial data warehouse). Universe: NYSE + NASDAQ + AMEX, market cap > $1B. Backtest: 2000-2025, annual July rebalance, next-day close execution (MOC), equal weight top 30 by yield. Transaction costs: size-tiered (0.1-0.5% one-way). Quality filters: dividend yield 4-15%, payout 0-80%, FCF > 0, ROE > 8%, D/E < 2.0. Past performance does not guarantee future results. This is educational content, not investment advice.
Part of a Series
This is the US analysis. We also ran the same screen on global exchanges: - High Yield Quality on Indian Stocks (NSE) - 6.36% CAGR, NSE-only run (68% cash periods) - High Yield Quality on German Stocks (XETRA) - 7.65% CAGR, +3.20% excess vs DAX - High Yield Quality on Hong Kong Stocks (HKSE) - 8.97% CAGR, +8.48% excess vs Hang Seng - High Yield Quality on Canadian Stocks (TSX) - 6.29% CAGR, +1.86% excess vs TSX Composite - High Yield Quality on UK Stocks (LSE) - 7.63% CAGR, +6.77% excess vs FTSE 100 - High Yield Quality Across Global Exchanges - full comparison
Run This Screen Yourself
Via web UI: Run the High Yield Quality screen on Ceta Research. The query is pre-loaded. Hit "Run" and see what passes today.
Via Python:
import requests, os

API_KEY = os.environ["CR_API_KEY"]
BASE = "https://api.cetaresearch.com/api/v1"

query = """
SELECT r.symbol, p.companyName, p.sector,
    ROUND(r.dividendYieldTTM * 100, 2) AS yield_pct,
    ROUND(r.dividendPayoutRatioTTM * 100, 1) AS payout_pct,
    ROUND(k.returnOnEquityTTM * 100, 1) AS roe_pct,
    ROUND(r.debtToEquityRatioTTM, 2) AS debt_equity,
    ROUND(k.marketCap / 1e9, 1) AS mktcap_bn
FROM financial_ratios_ttm r
JOIN key_metrics_ttm k ON r.symbol = k.symbol
JOIN profile p ON r.symbol = p.symbol
WHERE r.dividendYieldTTM BETWEEN 0.04 AND 0.15
  AND r.dividendPayoutRatioTTM BETWEEN 0 AND 0.80
  AND k.returnOnEquityTTM > 0.08
  AND (r.debtToEquityRatioTTM < 2.0
       OR r.debtToEquityRatioTTM IS NULL)
  AND k.marketCap > 1000000000
  AND p.exchange IN ('NYSE', 'NASDAQ', 'AMEX')
  AND p.isFund = false
  AND p.isEtf = false
  AND p.isActivelyTrading = true
ORDER BY r.dividendYieldTTM DESC
LIMIT 30
"""

resp = requests.post(f"{BASE}/data-explorer/execute",
    headers={"X-API-Key": API_KEY, "Content-Type": "application/json"},
    json={"query": query, "options": {"format": "json", "timeout": 600}})
task_id = resp.json()["taskId"]

import time
while True:
    status = requests.get(f"{BASE}/tasks/data-query/{task_id}",
        headers={"X-API-Key": API_KEY}).json()
    if status["status"] in ("completed", "failed"):
        break
    time.sleep(2)

results = requests.get(f"{BASE}{status['resultUrl']}",
    headers={"X-API-Key": API_KEY}).json()
for r in results[:10]:
    print(f"{r['symbol']:8s} Yield={r['yield_pct']:.1f}% ROE={r['roe_pct']:.1f}% D/E={r['debt_equity']:.2f}")
Get your API key at cetaresearch.com.
The full backtest code (Python + DuckDB) is available in our GitHub repository.
References
- Fama, E. & French, K. (1998). "Value versus Growth: The International Evidence." Journal of Finance, 53(6), 1975-1999.
- Arnott, R. et al. (2005). "Fundamental Indexation." Financial Analysts Journal, 61(2), 83-99.