OCF Momentum: Why It Works in Some Markets and Fails in Others
Same signal, 9 markets, 25 years, each measured against its local benchmark. Switzerland leads at +5.7% alpha vs the SMI, Thailand trails at -3.8% vs the SET, a ~9.5pp spread. The edge is in weak local indices, not strong ones.

OCF Momentum: Local Benchmarks Change Everything
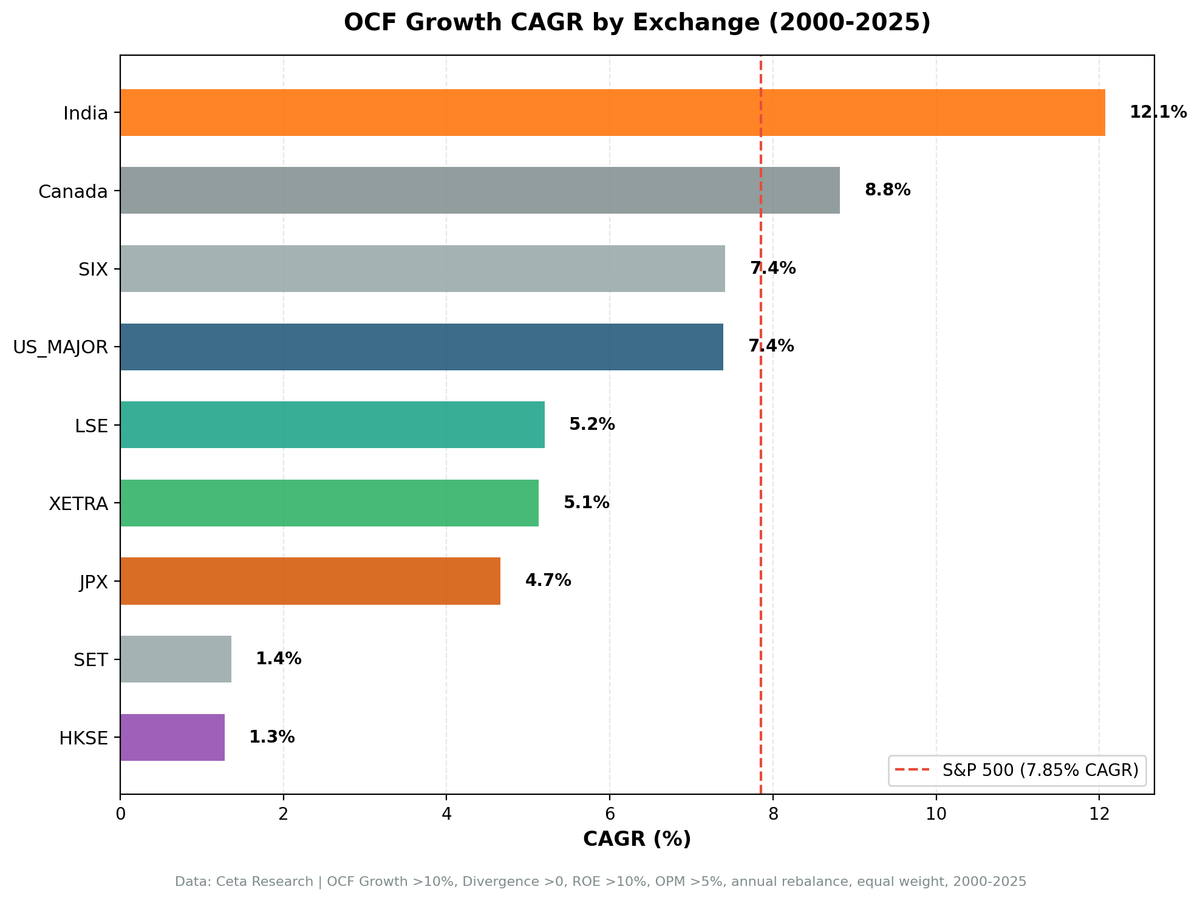
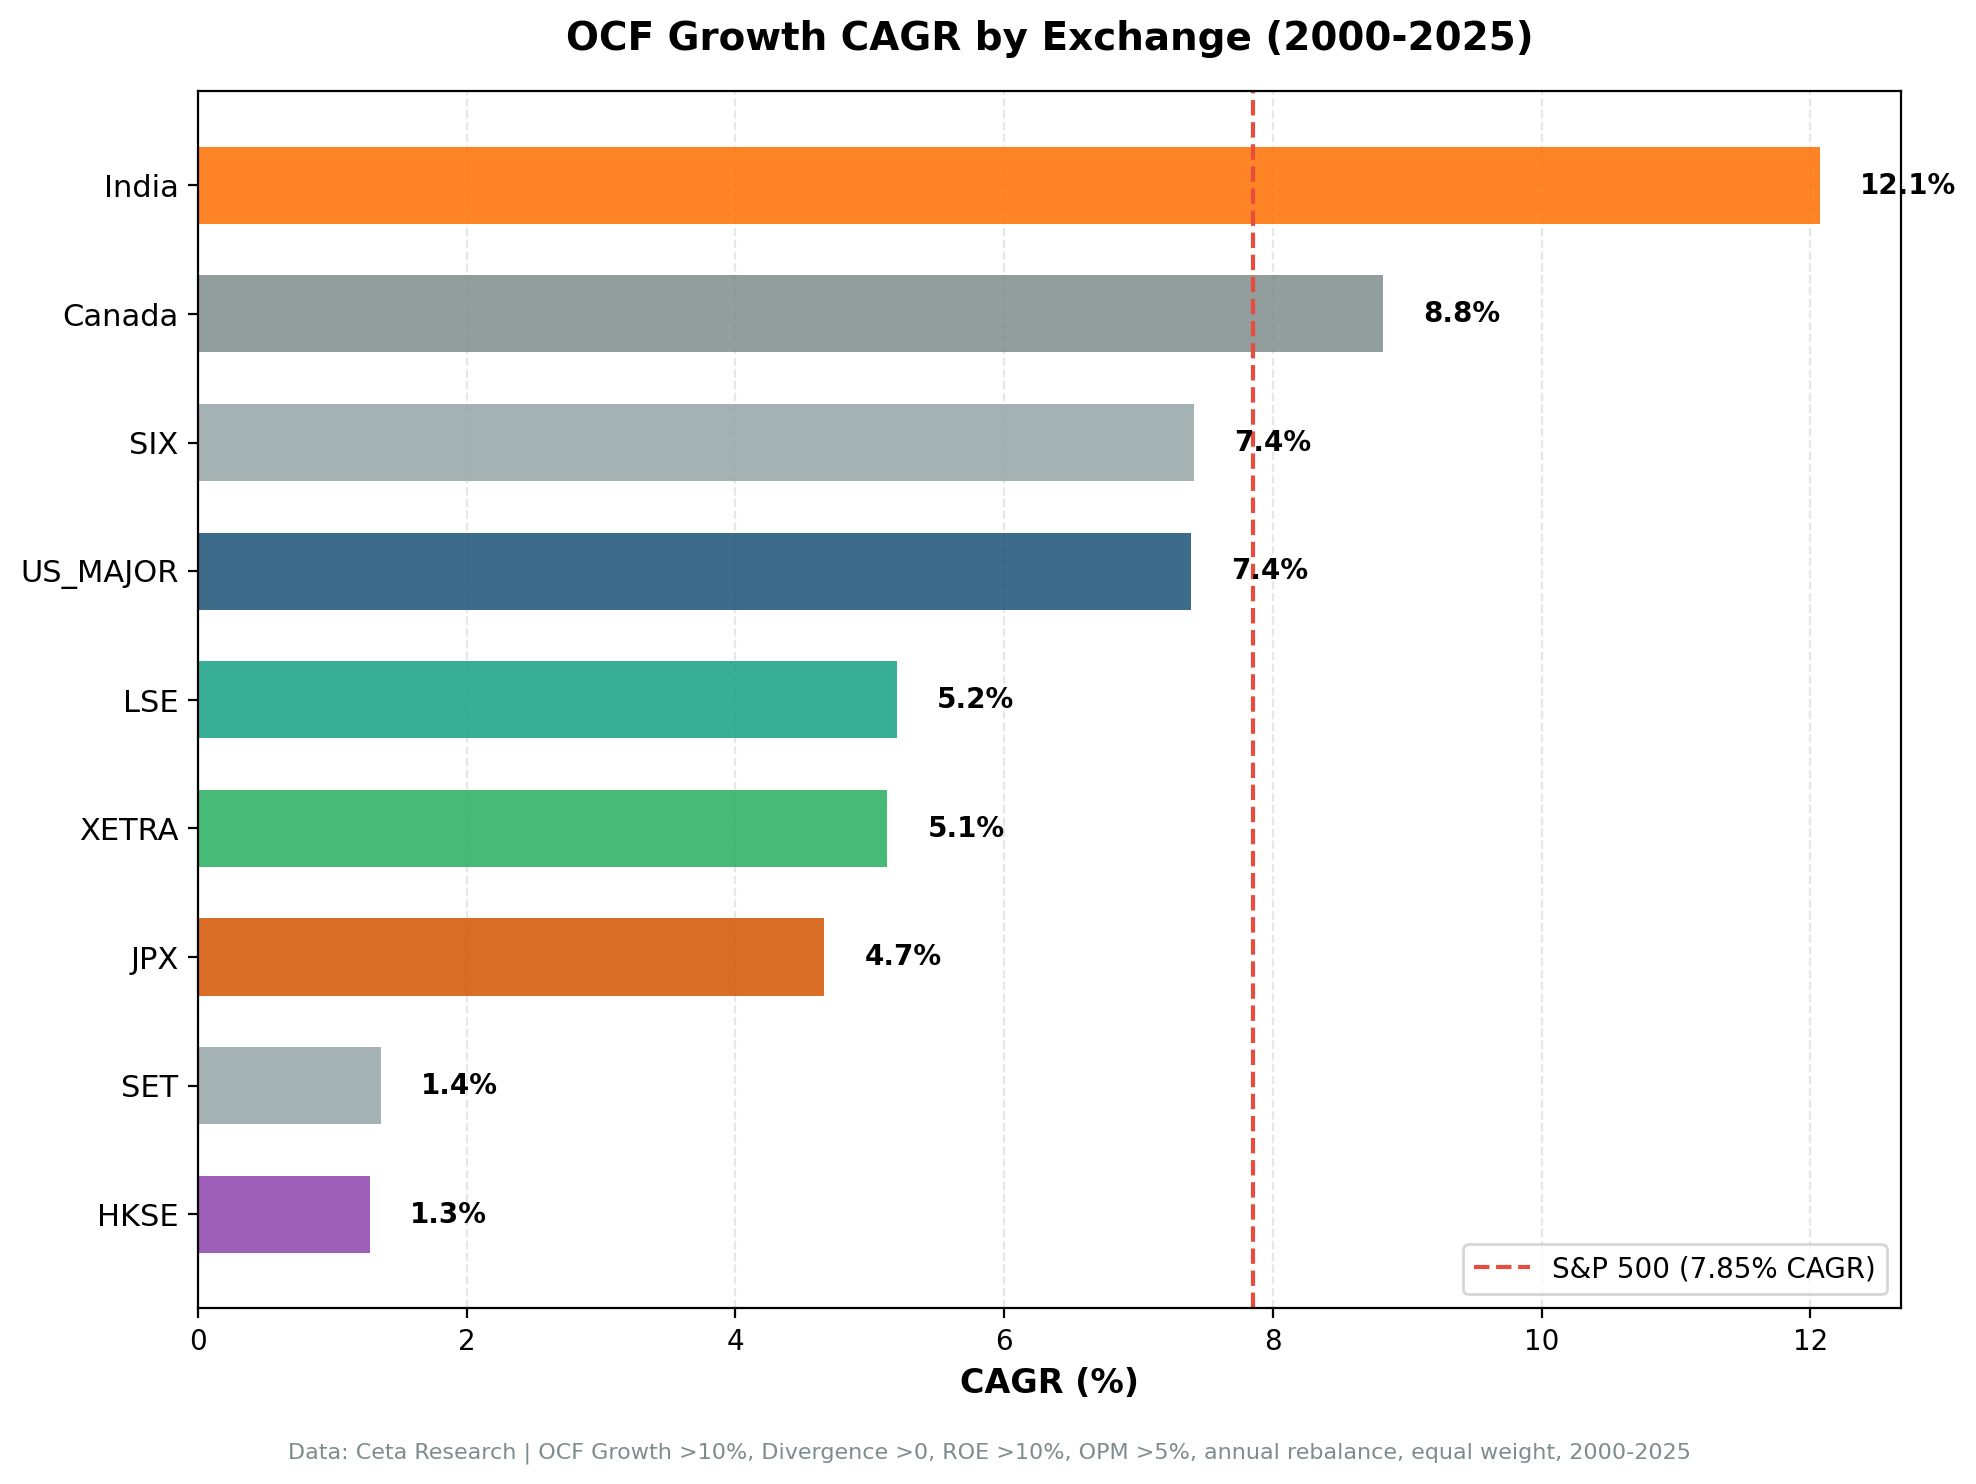
We tested the same cash flow divergence signal on 9 stock markets over 25 years (2000-2025). Strategy returns ranged from +12.1% CAGR in India to +1.3% in Hong Kong. The key finding: comparing every market to the S&P 500 hides the real story. Measured against local benchmarks, the signal generates the most alpha in markets where the local large-cap index was weakest (Switzerland +5.7% vs SMI, Canada +4.9% vs TSX, UK +4.0% vs FTSE), is roughly neutral in Japan, Germany, and India, and lags in Hong Kong, the US, and Thailand. The earlier story ("works in emerging markets, fails in developed markets") was wrong. The honest finding: OCF divergence mostly beats weak local indices.
Contents
- What We Tested
- Cross-Market Results
- Ranked by Alpha vs Local Benchmark
- Three Tiers Emerged (vs Local Benchmarks)
- Max Drawdown Comparison
- Sharpe Ratio Comparison
- Why India Matched, Not Beat, the Sensex
- Why Switzerland Won
- Why Japan Flipped Positive
- Why It's Neutral in the US and Germany
- Where It Fails
- When the Signal Works (Cross-Market Patterns)
- When the Signal Fails (Cross-Market Patterns)
- The Pattern
- Regional Blogs
- Run It Yourself
- Limitations
- Takeaway
Data: FMP financial data warehouse, 2000–2025. Updated June 2026.
What We Tested
Signal: Buy stocks where operating cash flow is growing faster than earnings (positive divergence). Rank by divergence magnitude, hold top 30, equal weight, rebalance annually.
Filters: OCF growth > 10%, ROE > 10%, operating margin > 5%, market cap > local threshold.
Markets: US, India, Canada, UK, Germany, Switzerland, Japan, Hong Kong, Thailand (9 total).
Period: 2000-2025 (25 years, 25 annual rebalances).
Benchmarks: Local index for each market (Sensex for India, TSX for Canada, FTSE 100 for UK, etc.). SPY used only for the cross-market dollar comparison where noted.
Cross-Market Results
Ranked by Alpha vs Local Benchmark
| Market | Strategy CAGR | Local Benchmark | Bench CAGR | Alpha (vs local) | MaxDD | Win % |
|---|---|---|---|---|---|---|
| Switzerland | 7.4% | SMI | 1.7% | +5.7% | -44.2% | 68% |
| Canada | 8.8% | TSX Composite | 4.0% | +4.9% | -20.7% | 52% |
| UK | 5.2% | FTSE 100 | 1.2% | +4.0% | -49.5% | 60% |
| Japan | 4.7% | Nikkei 225 | 3.3% | +1.4% | -52.4% | 52% |
| Germany | 5.1% | DAX | 5.0% | +0.1% | -50.2% | 36% |
| India | 12.1% | Sensex | 12.1% | +0.0% | -21.4% | 56% |
| Hong Kong | 1.3% | Hang Seng | 1.6% | -0.4% | -43.8% | 44% |
| US | 7.4% | S&P 500 | 7.9% | -0.5% | -37.7% | 48% |
| Thailand | 1.4% | SET Index | 5.1% | -3.8% | -55.7% | 40% |
Three Tiers Emerged (vs Local Benchmarks)
Tier 1 - Strong Alpha (>3% excess): Switzerland, Canada, UK - Beat local benchmarks by 4-6% annually. - Switzerland's 68% win rate is the highest of any market. - All three had weak local indices (SMI 1.7%, TSX 4.0%, FTSE 1.2%). - Key insight: the signal shines when the local index is weak.
Tier 2 - Roughly Neutral (0-2% excess): Japan, Germany, India - Japan beat the Nikkei by +1.4%, a result that flipped positive in this re-run. - Germany and India essentially matched their local indices (+0.1% and +0.0%). - For India, the edge is drawdown protection, not alpha.
Tier 3 - Negative: Hong Kong, US, Thailand - Hong Kong: -0.4% (slightly behind a flat Hang Seng). - US: -0.5% (essentially neutral vs the S&P 500). - Thailand: -3.8% (the only market that consistently fails).
Max Drawdown Comparison
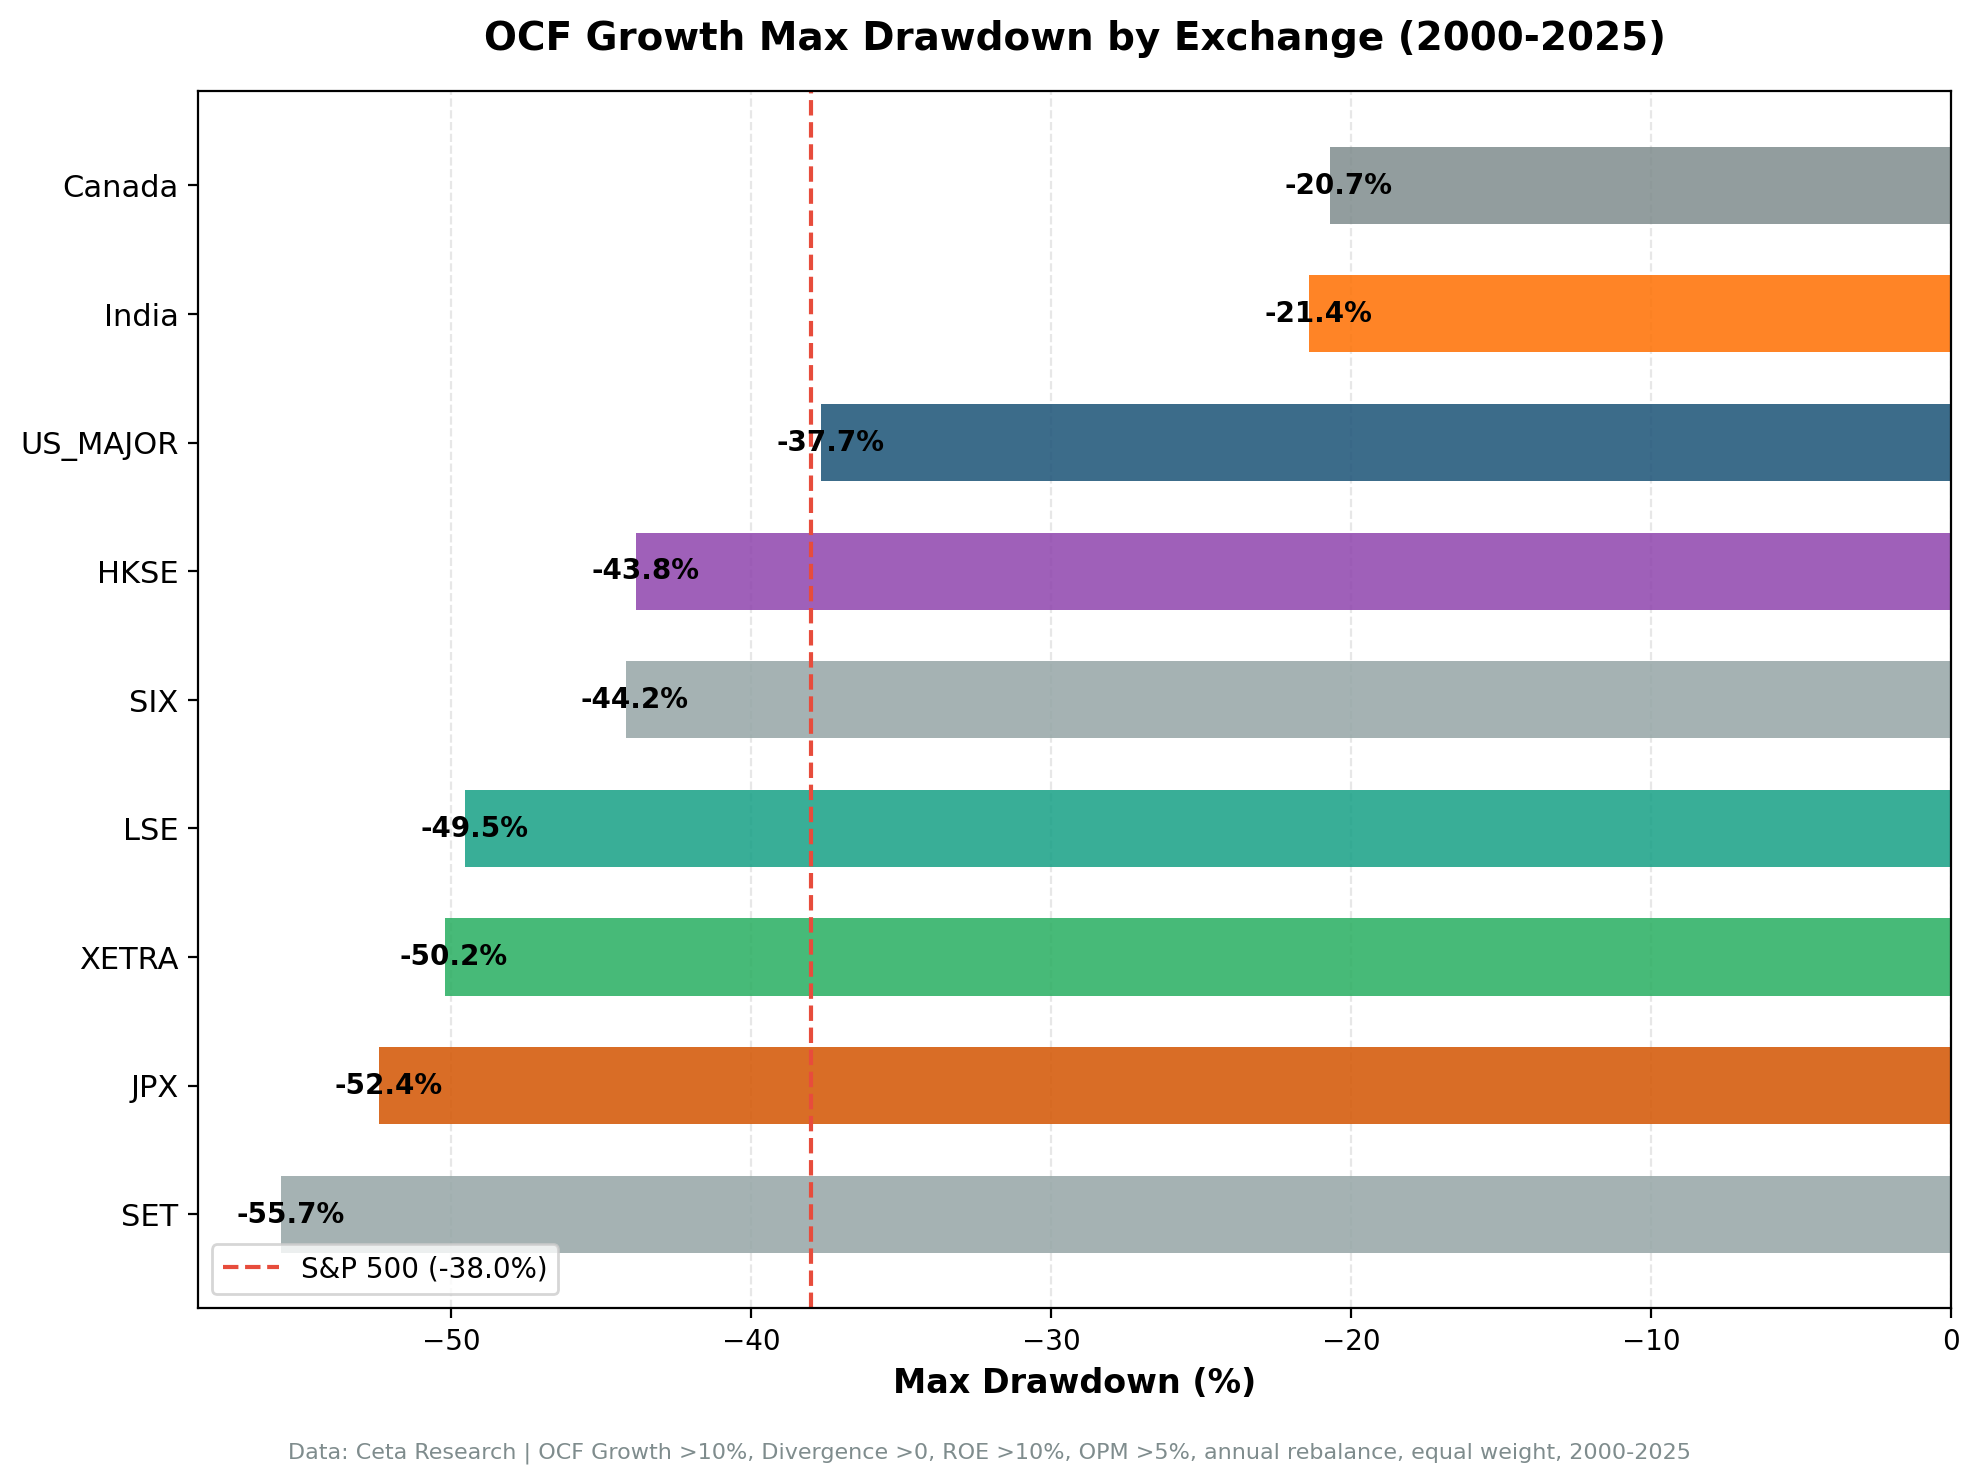
Canada (-20.7%) and India (-21.4%) have the shallowest drawdowns by a wide margin. India's is the standout: an emerging market with high volatility, yet the cash flow quality filter cut its worst drawdown to -21.4% vs the Sensex's -32.2%. Compare the rest: - US: -38% - Hong Kong: -44% - Switzerland: -44% - UK, Germany, Japan: -50% to -52% - Thailand: -56%
Cash flow divergence doesn't prevent crashes, but in Canada and India it helped identify companies that survived them.
Sharpe Ratio Comparison
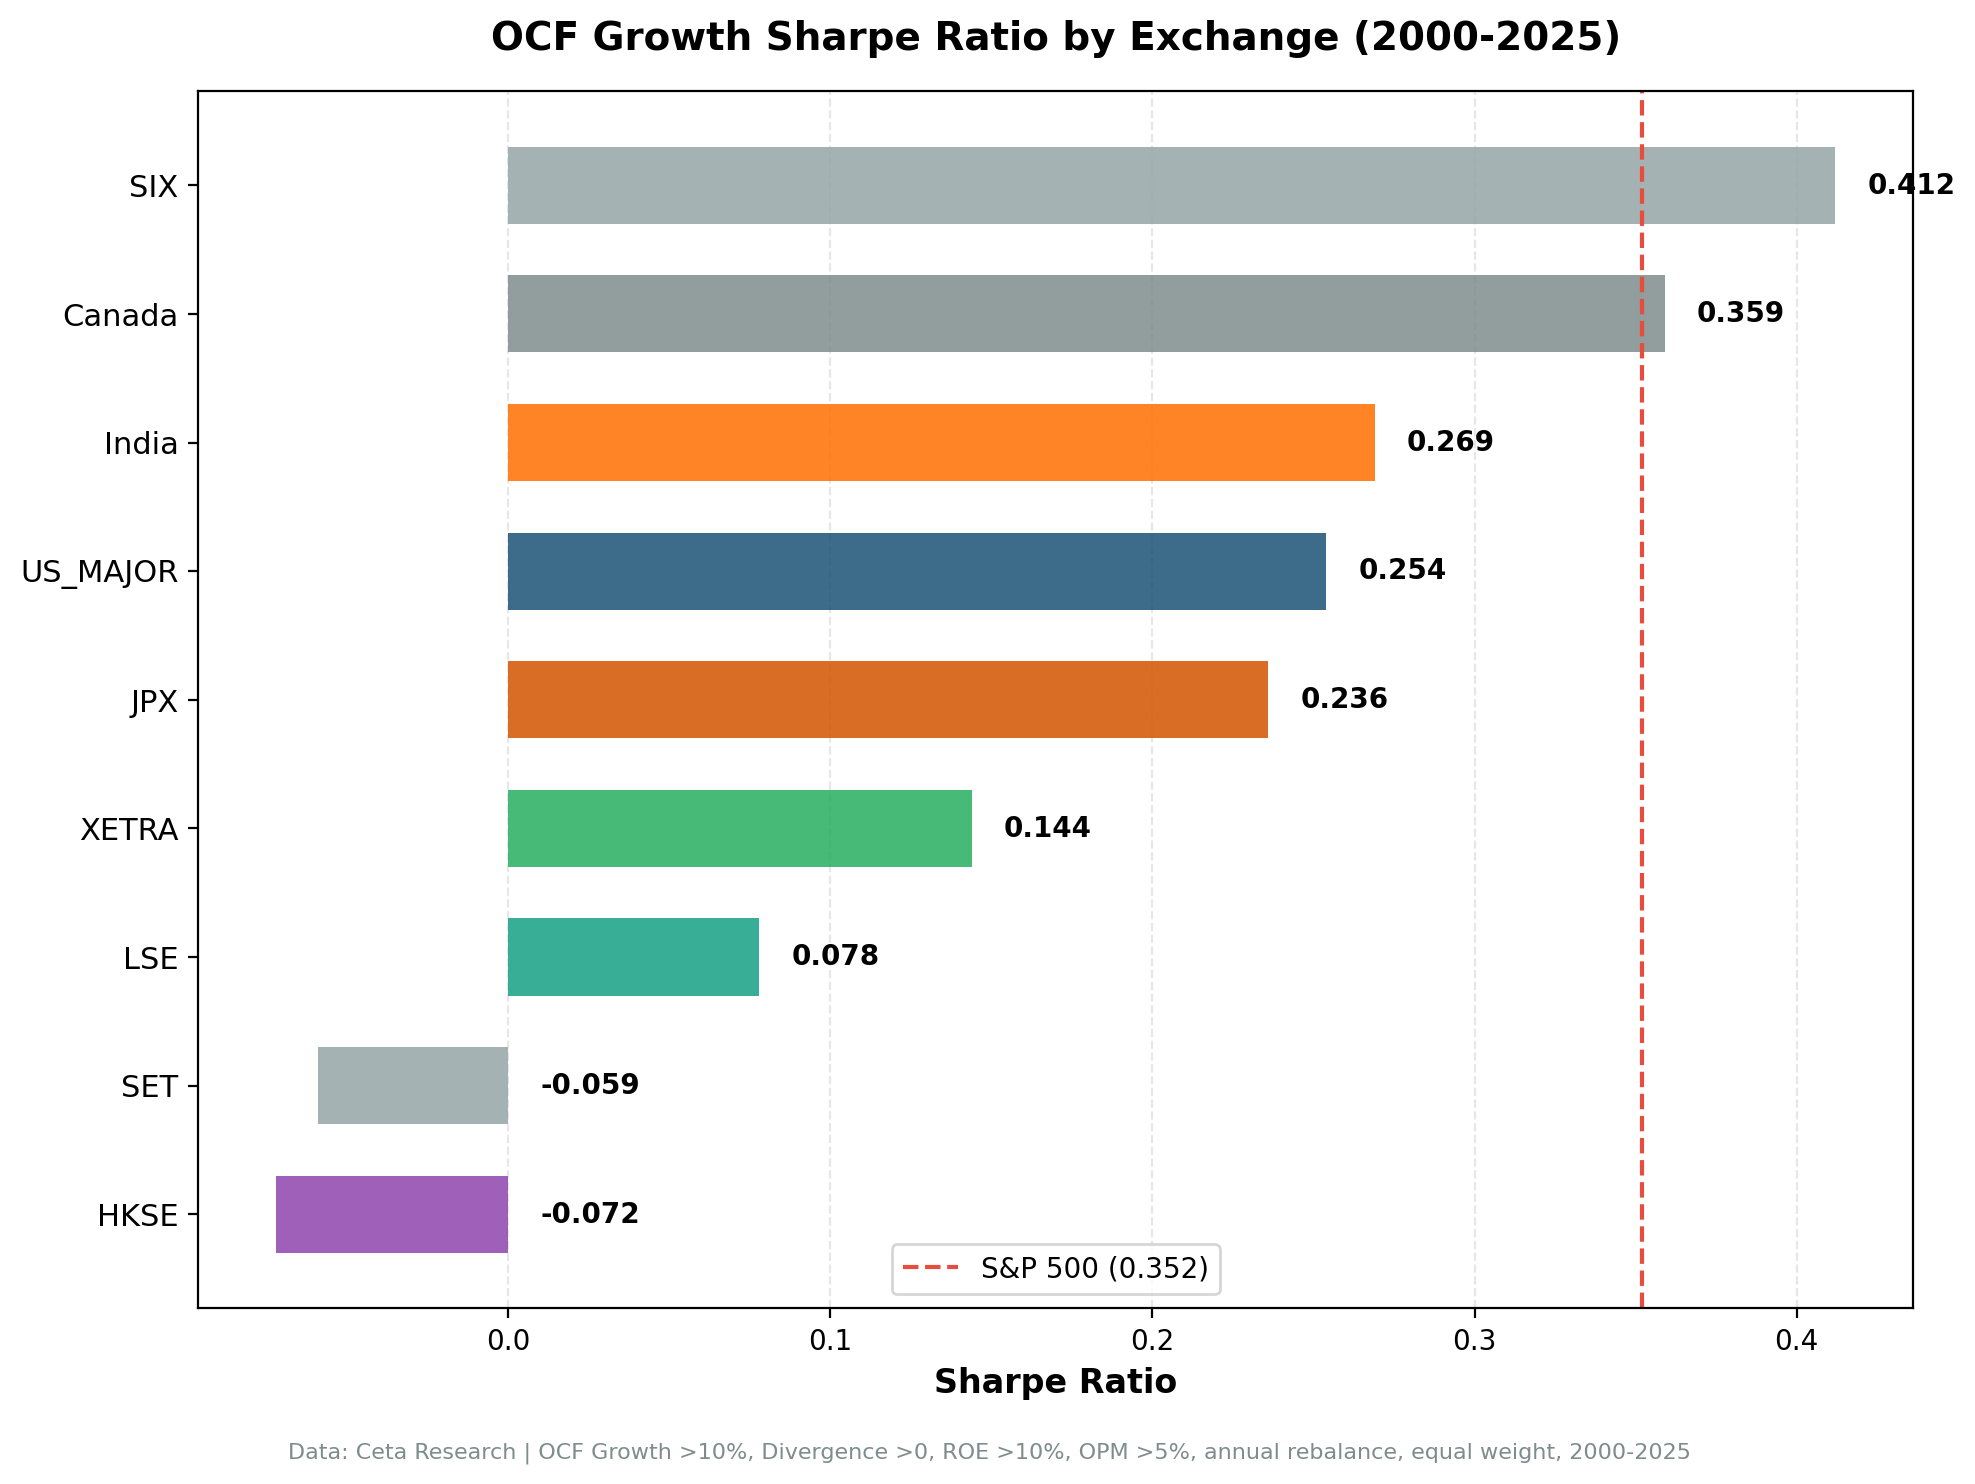
Switzerland delivered the best Sharpe (0.41), combining low volatility (16.8%) with +5.7% alpha over the SMI. Canada was next at 0.36. India had a lower Sharpe (0.27) but the highest absolute returns.
Developed markets with deep drawdowns (UK 0.08, Germany 0.14) posted weak Sharpe ratios despite positive alpha, because their volatility and drawdowns were severe.
Hong Kong (-0.07) and Thailand (-0.06) posted negative Sharpe ratios, meaning the strategies didn't beat cash after adjusting for risk.
Why India Matched, Not Beat, the Sensex
Old claim (vs SPY): +13.3% CAGR, +5.4% alpha. New reality: +12.1% CAGR, +0.0% alpha vs the Sensex.
The old comparison was misleading. It pitted Indian stocks (in INR) against the S&P 500 (in USD). The Sensex itself returned 12.1% annually over 25 years, the same as the strategy. There is no return alpha.
What India actually delivered: 1. Strong absolute returns (12.1% CAGR), matching a strong local index. 2. Much better drawdown protection: -21.4% vs the Sensex's -32.2%. 3. Low beta (0.58): index-level returns with far less market risk. 4. 56% win rate against the local benchmark.
The edge isn't alpha. It's risk: the strategy delivered the Sensex's return while taking much less of its risk.
Why Switzerland Won
+7.4% CAGR, +5.7% alpha vs the SMI. The signal's best market this run.
Switzerland delivered the strongest alpha of any market when measured against its local benchmark. The SMI returned just 1.7% annually over 25 years. The OCF divergence strategy delivered 7.4%, with the highest win rate (68%) and best Sharpe (0.41) of the group.
- Weak local index. The SMI is concentrated in a handful of mega-caps (Nestle, Novartis, Roche) that went sideways for long stretches. A broader quality screen found the actual compounders.
- Stable, high-quality cash flows. Swiss pharma and consumer staples have predictable cash generation. When the divergence signal fired, it tended to pick durable businesses.
- Low volatility. At 16.8%, Switzerland had the lowest volatility of any market, which is why its Sharpe leads despite a -44% drawdown in 2008.
Why Japan Flipped Positive
+4.7% CAGR, +1.4% alpha vs the Nikkei 225. It used to look like a failure.
In earlier runs Japan looked like a clear miss. With next-day execution and a repaired data source, it beat the Nikkei by +1.4% annually. The ROE > 10% filter screens out most Japanese companies (the average is near 8%), so the strategy held cash in 4 of 25 years. But the minority of Japanese firms that pair improving cash flow with genuine profitability outperformed the cash-hoarding index. The edge is small and the drawdown is deep (-52%), but it's positive.
Why It's Neutral in the US and Germany
US (-0.5%), Germany (+0.1%).
- Strong, efficient markets. US GAAP and German enforcement are strict, and FTSE/DAX/S&P stocks are heavily covered. Cash flow information is incorporated into prices quickly, so the divergence signal adds little.
- Already-strong benchmarks. The S&P 500 (7.9%) is hard to beat. Unlike the SMI or FTSE, there's no weak index to exploit.
- Cyclical mismatch (Germany). Export-heavy industrials show volatile cash flows that can be noisier than earnings, which misfires the signal.
Where It Fails
Hong Kong (-0.4%), Thailand (-3.8%).
- Holding company structures (Hong Kong). Listed companies are often shells for Chinese assets. OCF at the HoldCo level is meaningless.
- Political/currency risk (Thailand). When stock prices are driven by coups, currency crises, and conglomerate politics, financial signals don't matter. Thailand held cash 24% of the time and still trailed the SET by 3.8%.
When the Signal Works (Cross-Market Patterns)
Weak local indices. Switzerland, Canada, and the UK all had local benchmarks returning under 4% annually. A quality screen that finds the real compounders beats a stagnant index handily.
Crisis periods. India 2009 (+16% excess), Canada 2009 (+23% excess), US 2000 (+20% excess). When markets crash, cash-generative companies with genuine quality outperform.
Commodity recoveries. Canada 2020 (+15% excess), India 2016 (+35% excess). When resources rebound from troughs, companies with real OCF growth capture the upside.
When the Signal Fails (Cross-Market Patterns)
Strong, efficient benchmarks. The US S&P 500 is hard to beat. There's no weak index to exploit, and the signal nets out neutral to slightly negative.
Growth-dominated stretches. US 2017-2019. When sentiment and growth narratives dominate, cash flow quality is ignored.
Weak governance and opaque structures. Hong Kong and Thailand. When reported cash flow doesn't reflect operating reality, the signal misfires.
The Pattern
Cash flow divergence beats weak indices, not strong ones.
The earlier story claimed the signal works where accounting is weak (India) and fails where it's strong (US, Europe). The corrected data tells a simpler story: the largest alpha shows up where the local large-cap index was weakest. Switzerland (SMI 1.7%), the UK (FTSE 1.2%), and Canada (TSX 4.0%) all had stagnant headline indices, and a broad quality screen beat them. The US (S&P 500 7.9%) and a strong Sensex (12.1%) left little room to add value.
That reframes the edge. It's less about exploiting accounting manipulation and more about avoiding stagnant, concentrated mega-cap indices with a screen that finds the genuine compounders underneath.
Regional Blogs
For detailed analysis of each market: - Switzerland: +5.7% alpha over the SMI, 68% win rate - Canada: +4.9% alpha over the TSX - UK: +4.0% alpha over the FTSE 100 - Japan: +1.4% alpha over the Nikkei - Germany: roughly matches the DAX - India: matches the Sensex with lower drawdown - US: matched the S&P 500, regime-dependent - Hong Kong: slightly lags the Hang Seng - Thailand: worst performer, -3.8% vs the SET
Run It Yourself
Run the global OCF momentum comparison on Ceta Research
Screen stocks across all 9 markets with the same criteria: OCF growth > 10%, positive divergence (OCF growth > NI growth), ROE > 10%, operating margin > 5%, market cap thresholds adjusted per exchange (see individual regional blogs for local currency thresholds).
Limitations
Currency risk not modeled. Returns are in local currency and don't account for hedging costs. Real-world multi-market portfolios would need currency management.
Survivorship bias. FMP data includes some delisted stocks but may not capture all failures across all exchanges. Returns could be overstated.
Data quality varies by market. Indian and Thai financial data has more gaps and corrections than US data. Some results may reflect data artifacts.
No transaction costs in the cross-market table. Costs vary widely (US ~0.05%, India ~0.5-1.0% with STT/stamp duty). Real-world returns would be lower.
Single-country risk. Each market represents a bet on that country's equity market. Macro risk (currency devaluation, regulatory changes, geopolitical shocks) can overwhelm the signal.
Point-in-time methodology. We used 45-day filing lags to avoid look-ahead bias, but real-world implementation may face data delays, especially in emerging markets.
Takeaway
The same signal, applied consistently, generated +5.7% alpha in Switzerland and -3.8% in Thailand. That's a 9.5 percentage point spread. Market structure, and the strength of the local index, matter more than signal design.
If you're screening global stocks for cash flow quality: - Overweight: Markets with weak, concentrated local indices (Switzerland, Canada, UK work consistently). - Neutral: Strong or efficient markets (US, India, Germany match the benchmark, don't beat it). - Use for risk, not return (India): index-level returns with much lower drawdown and beta. - Avoid: Opaque or politically-driven markets (Hong Kong, Thailand).
Cash is harder to fake than earnings. But the alpha shows up mostly where the local index was easy to beat.
Data: Ceta Research (FMP financial data warehouse), 9 markets, 2000-2025. Full methodology: backtests/METHODOLOGY.md
Past performance does not guarantee future results. This is educational content, not investment advice.