
Oversold Quality Global: 3 of 18 Markets Beat Their Local Benchmark (2000-2025)
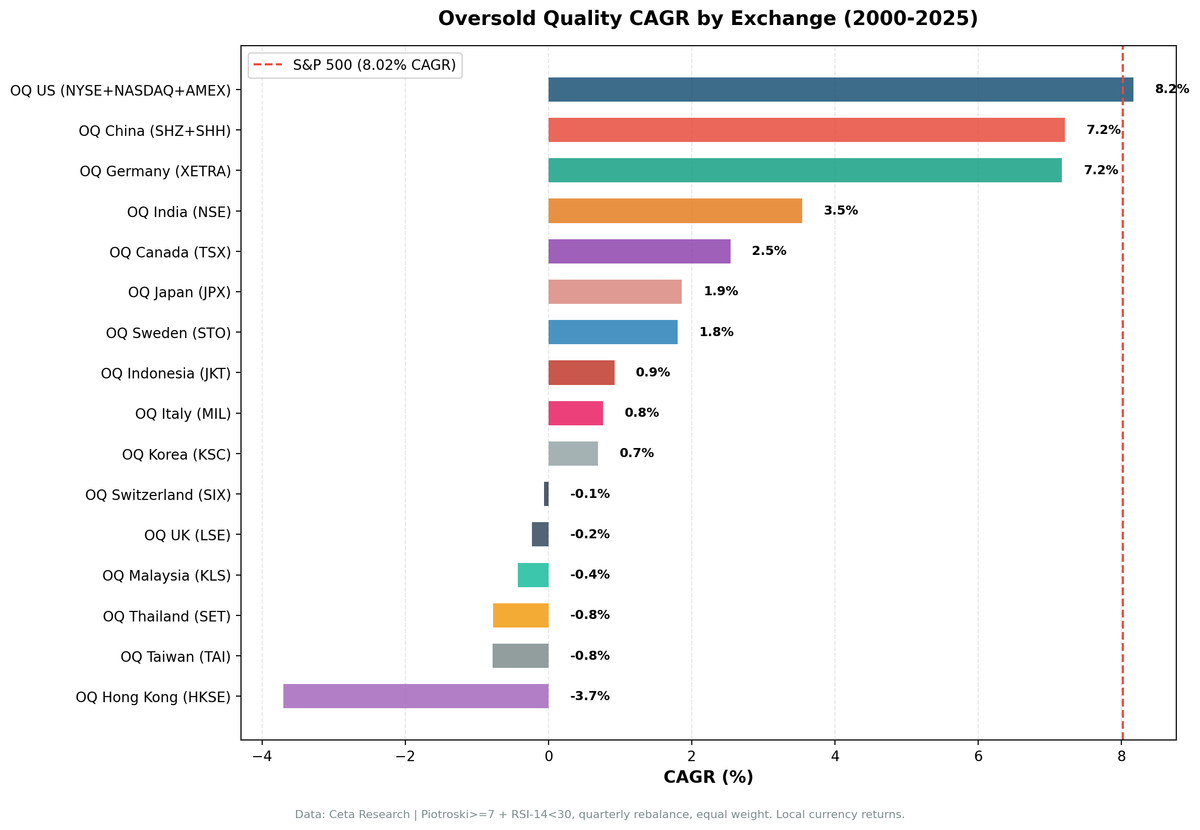
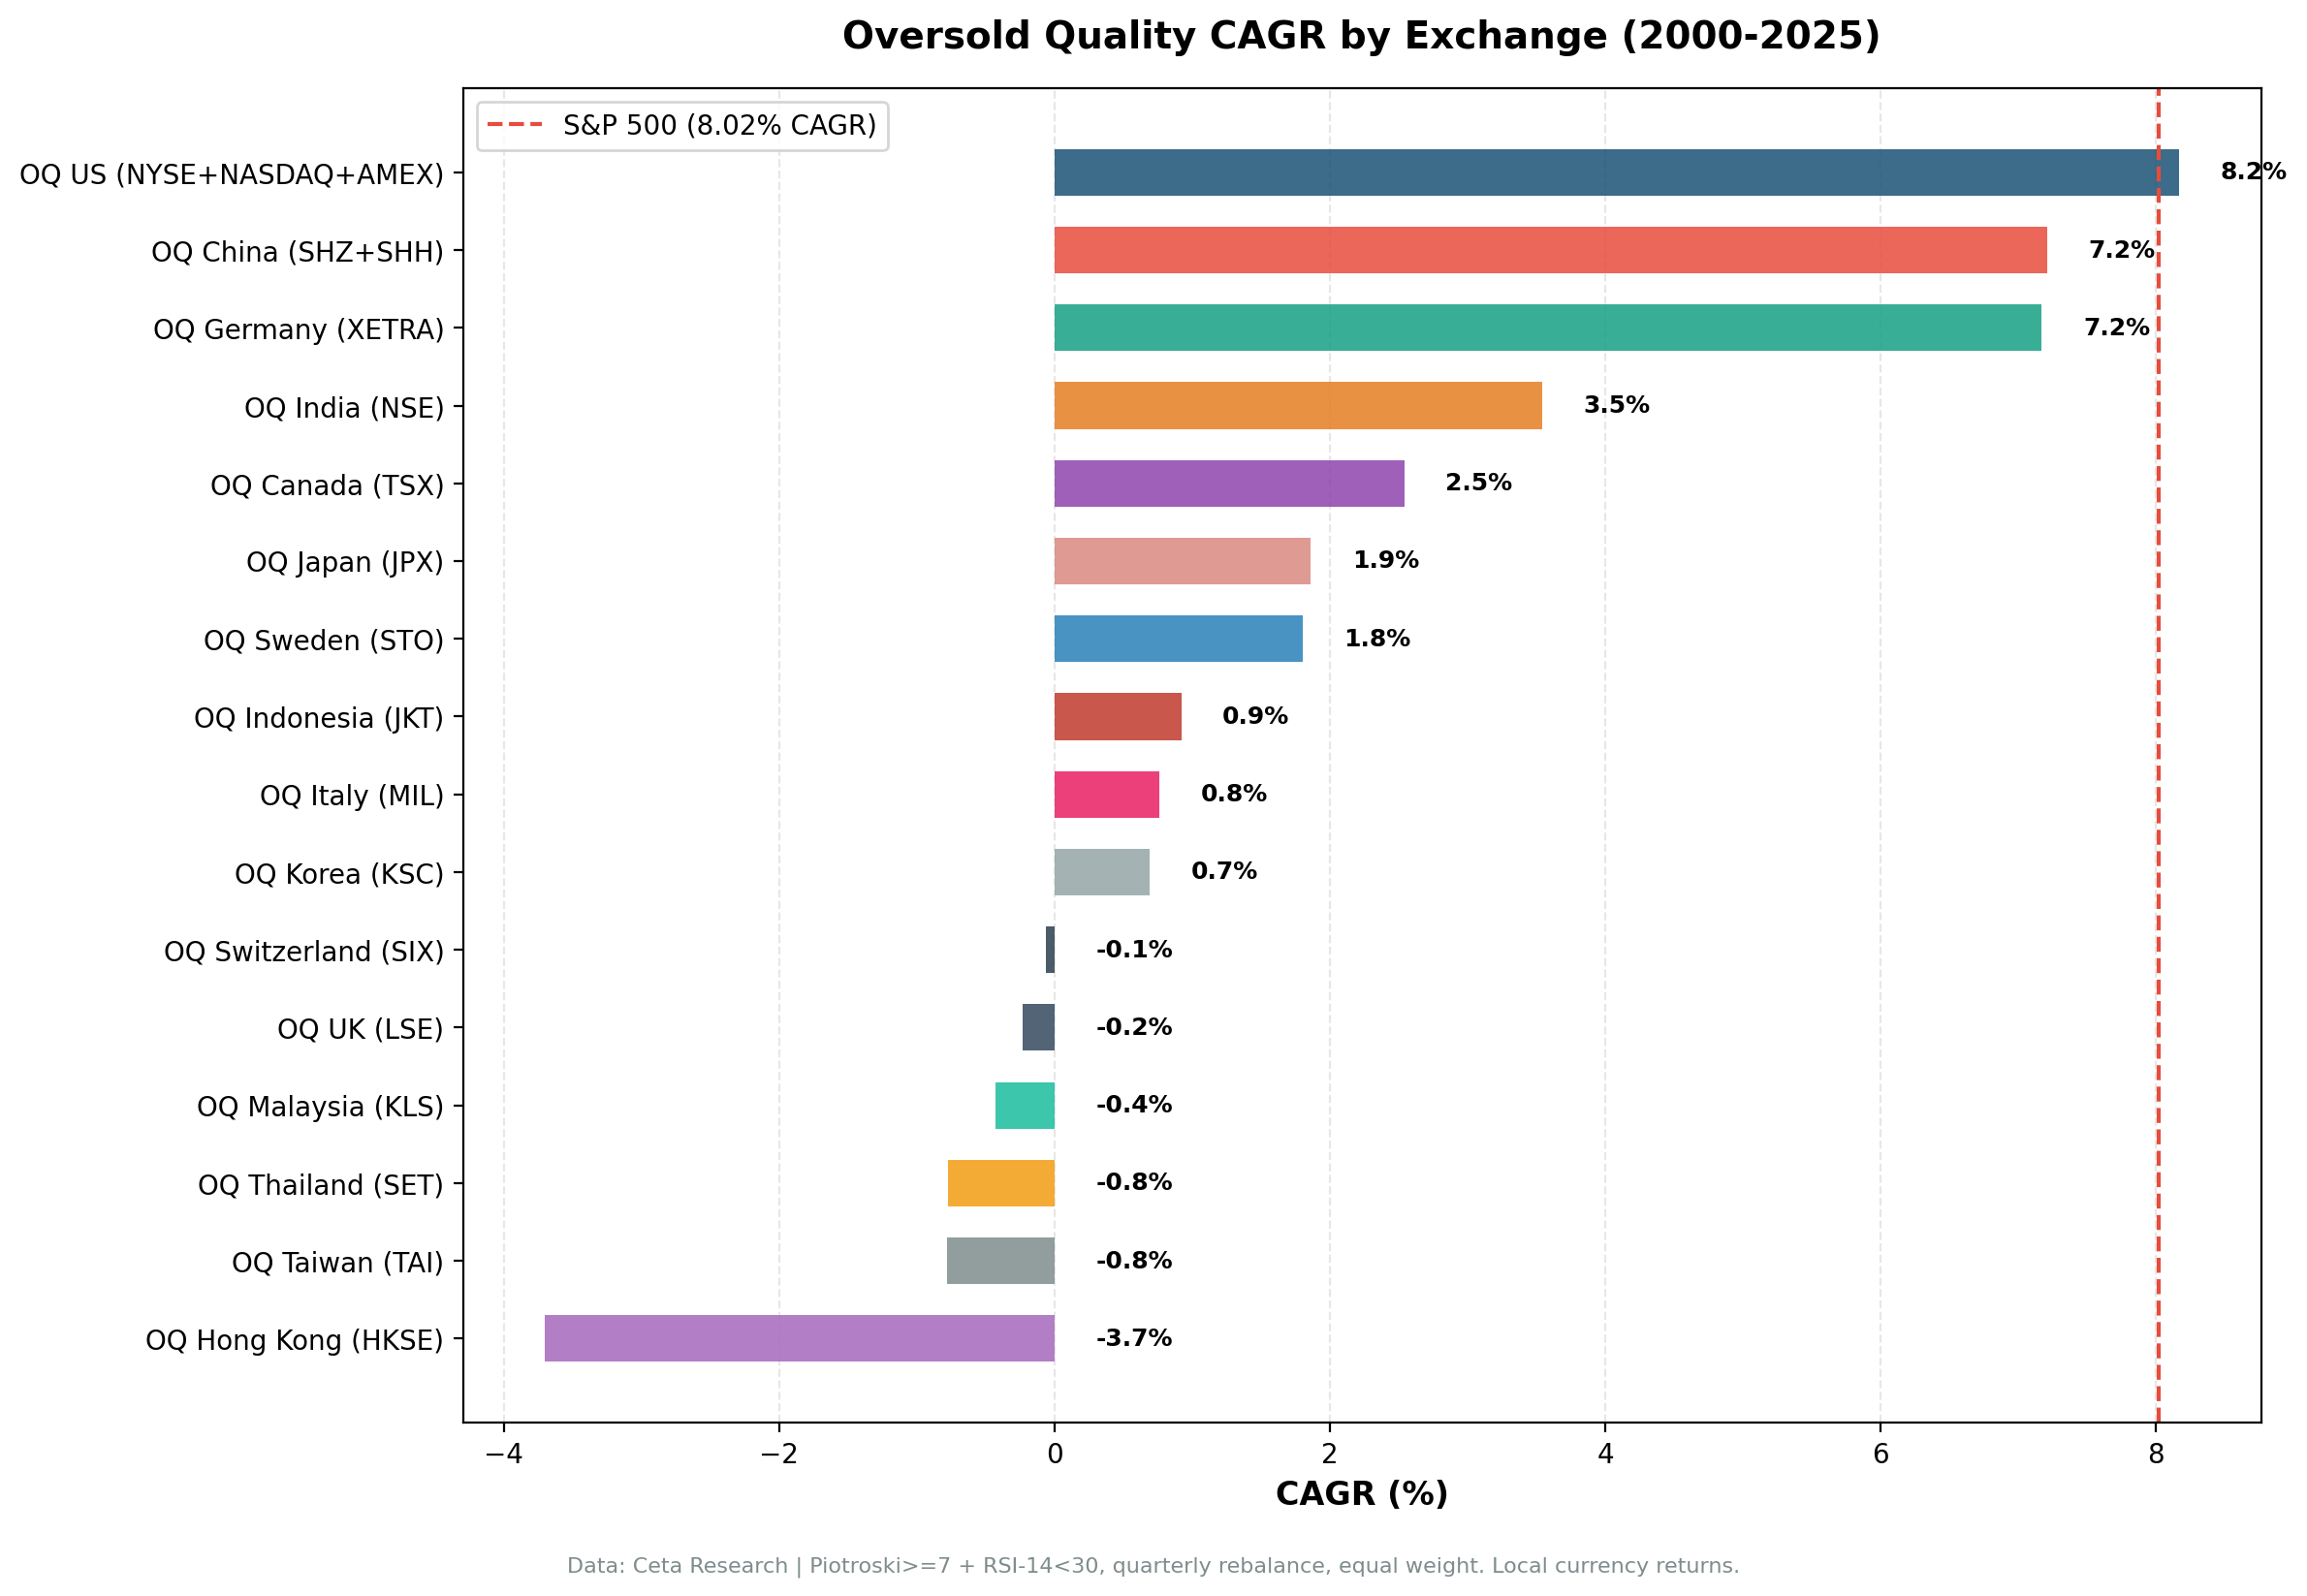
Oversold Quality (Piotroski >= 7 + RSI < 30) on 18 exchanges. China beats the SSE Composite by +3.02%, Germany beats the DAX by +2.05%, and the US draws even with the S&P 500. The other 15 trail their local benchmarks.

title: "Oversold Quality Global: 3 of 18 Markets Beat Their Local Benchmark (2000-2025)" slug: oversold-quality-global-comparison publish_date: 2026-01-24 tags: [backtests, global-markets, quality-investing, RSI, cross-market-comparison] post_access: public excerpt: "Oversold Quality (Piotroski >= 7 + RSI < 30) on 18 exchanges. China beats the SSE Composite by +3.02%, Germany beats the DAX by +2.05%, and the US draws even with the S&P 500. The other 15 trail their local benchmarks." authors: [Swas] feature_image: 1_comparison_cagr.png feature_image_alt: "CAGR by Exchange: Oversold Quality Global Comparison (2000-2025)" meta_title: "Oversold Quality Global Backtest: 18 Exchanges (2000-2025)" meta_description: "Oversold Quality across 18 exchanges. China beats SSE by +3.02%, Germany beats DAX by +2.05%, the US draws with SPY. Local benchmark comparison reveals where quality filtering adds value." canonical_url: https://blog.tradingstudio.finance/oversold-quality-global-comparison og_title: "Oversold Quality Tested on 18 Exchanges: What Actually Works" og_description: "18 exchanges, 25 years, one strategy: Piotroski >= 7 + RSI < 30. China beats SSE +3.02%, Germany beats DAX +2.05%, the US draws. Cash rate explains the rest." twitter_title: "Oversold Quality Global: 3 of 18 Beat Their Local Benchmark" twitter_description: "China beats SSE +3.02%. Germany beats DAX +2.05%. The US draws with the S&P 500. The other 15 underperform. Pattern: value in volatile, episodic markets."
Contents
- A Note on the Numbers
- Summary Table
- The Strategy
- Tier Analysis
- Tier 1: Beats the local benchmark
- Tier 2: Functional, draws or trails the benchmark
- Tier 3: Too selective to matter (cash rate > 60%)
- Why Cash Periods Drive Performance
- The Standout Exchanges
- When the Strategy Works Globally
- Limitations
- Part of a Series
Data: FMP financial data warehouse, 2000–2025. Updated March 2026.
We ran the Oversold Quality strategy on 18 stock exchanges, 25 years of data, 103 quarterly periods per exchange. Two exchanges beat their local benchmarks: China (+3.02% annually vs the SSE Composite) and Germany (+2.05% vs the DAX). The US drew even with the S&P 500 (+0.15%). The other 15 underperformed.
Measuring against local benchmarks instead of SPY is what makes the pattern legible. Many emerging and European markets have structurally different return profiles than US equities. China's +3.02% over the SSE and Germany's +2.05% over the DAX are real local alpha. The same strategy compared only against SPY would bury both inside a "everything trails the S&P" story that misses where the signal actually adds value.
A Note on the Numbers
This is a corrected run. Raw end-of-day price data contains occasional bad rows, single-day adjusted-close values that spike several-fold and revert a day later (phantom holiday rows and broken split adjustments). A handful of those on quarterly entry or exit dates can swing a result by tens of percent. We filter them before computing returns, and fill positions at next-day closes.
The correction matters most where it changed the conclusion. The US moved from an apparent -2.81% underperformance to a +0.15% draw. Germany moved from a razor-thin +0.33% to a clear +2.05%. A few noisy emerging markets moved the other way: India dropped from -6.46% to -7.58% as inflated artifact returns came out. The benchmarks themselves barely moved, because index data doesn't carry these artifacts. The numbers below are the corrected ones.
Summary Table
| Exchange | CAGR | Local Benchmark | Excess vs Local | Sharpe | Max DD | Cash% |
|---|---|---|---|---|---|---|
| US (NYSE+NASDAQ+AMEX) | 8.17% | S&P 500 (8.02%) | +0.15% | 0.279 | -42.1% | 5% |
| China (SHZ+SHH) | 7.21% | SSE Composite (4.19%) | +3.02% | 0.155 | -47.5% | 21% |
| Germany (XETRA) | 7.17% | DAX (5.12%) | +2.05% | 0.308 | -28.0% | 39% |
| India (NSE) | 3.54% | Sensex (11.12%) | -7.58% | -0.145 | -55.0% | 53% |
| Canada (TSX) | 2.54% | TSX Composite (5.08%) | -2.54% | 0.002 | -36.4% | 45% |
| Japan (JPX) | 1.86% | Nikkei 225 (3.40%) | -1.54% | 0.101 | -61.3% | 39% |
| Sweden (STO) | 1.80% | OMX Stockholm 30 (3.17%) | -1.37% | -0.019 | -32.2% | 78% |
| Norway (OSL) | 1.49% | Oslo All Share (10.91%) | -9.42% | -0.367 | 0.0%* | 98% |
| Indonesia (JKT) | 0.92% | S&P 500 (8.02%) | -7.10% | -0.116 | -30.7% | 78% |
| Italy (MIL) | 0.76% | S&P 500 (8.02%) | -7.25% | -0.198 | -49.4% | 82% |
| Korea (KSC) | 0.69% | KOSPI (4.81%) | -4.12% | -0.171 | -41.8% | 68% |
| South Africa (JNB) | 0.21% | S&P 500 (8.02%) | -7.80% | -7.863 | 0.0%* | 99% |
| Switzerland (SIX) | -0.06% | SMI (2.10%) | -2.17% | -0.044 | -49.5% | 70% |
| UK (LSE) | -0.23% | FTSE 100 (1.36%) | -1.59% | -0.201 | -57.2% | 38% |
| Malaysia (KLS) | -0.43% | S&P 500 (8.02%) | -8.45% | -0.262 | -42.0% | 83% |
| Thailand (SET) | -0.77% | SET Index (3.76%) | -4.53% | -0.204 | -53.6% | 69% |
| Taiwan (TAI) | -0.78% | TAIEX (4.38%) | -5.16% | -0.126 | -64.8% | 64% |
| Hong Kong (HKSE) | -3.70% | Hang Seng (1.77%) | -5.47% | -0.323 | -84.0% | 32% |
*Norway and South Africa show 0.0% max drawdown because their benchmark data is incomplete (the Oslo All Share series starts in 2013) and cash rates near 99% leave too few invested quarters to measure drawdown. Their excess and Sharpe figures aren't meaningful and they're excluded from the CAGR and drawdown charts. Indonesia, Italy, South Africa, and Malaysia fall back to SPY because no local index with full history was available.
Bolded exchanges beat their local benchmark. Only China and Germany clear that bar. The US is a genuine draw: +0.15% on CAGR, but a Sharpe of 0.279 against the S&P's 0.361, so on a risk-adjusted basis the index still edges it.
The Strategy
Oversold Quality screens for stocks that are financially healthy but have been beaten down in price. The Piotroski F-Score (nine-point accounting quality test) must be 7 or higher, requiring the company to pass at least 7 of 9 criteria across profitability, leverage, and operating efficiency. The RSI-14 (Relative Strength Index over 14 periods) must be below 30, indicating the stock has sold off sharply into technically oversold territory.
Each quarter, exchanges are screened for stocks meeting both criteria. If 5 or more qualify, they're held in equal weight for the quarter. If fewer than 5 qualify, the portfolio holds cash.
For full strategy mechanics, see the US flagship post.
Tier Analysis
Tier 1: Beats the local benchmark
China and Germany. These are the only two exchanges where the strategy beat its home index. China leads on raw excess (+3.02% vs the SSE Composite) and Germany leads on risk-adjusted quality (Sharpe 0.308, the best in the series, with a -28.0% max drawdown against the DAX's -65.2%). Both markets share a structural feature: episodic, locally-driven stress that pushes quality companies to RSI < 30 independent of the global cycle. China's policy crackdowns and Germany's European-crisis exposure create exactly the dislocations the strategy is built to buy.
Tier 2: Functional, draws or trails the benchmark
US, India, Canada, Japan, UK. Cash rates between 5% and 53% mean the signal fires often enough to build real, diversified portfolios and draw statistically meaningful conclusions. The US is the standout here: a 5% cash rate (the strategy almost always finds oversold quality names) and a dead heat with the S&P 500 after the data correction. India, Canada, Japan, and the UK trail their local benchmarks by 1.5 to 7.6 points, with the gap tracking how strong the underlying index was (the Sensex returned 11.12% a year, a high bar).
Tier 3: Too selective to matter (cash rate > 60%)
Sweden, Switzerland, Korea, Taiwan, Thailand, Italy, Indonesia, Malaysia, Norway, South Africa. Cash rates from 64% to 99% mean these portfolios spent most of the period doing nothing. Most carry negative Sharpe ratios. Norway and South Africa are the extreme: at 98-99% cash, the strategy invested in only a handful of quarters across 25 years, and their results are statistically meaningless. Hong Kong is the one low-cash member of the failures: a 32% cash rate but -84.0% max drawdown, because the quality oversold names it bought during the 2019 protests and COVID didn't recover on a quarterly timeline.
Why Cash Periods Drive Performance
The RSI < 30 filter is the binding constraint. Quality companies (Piotroski >= 7) are reasonably common on any large exchange. Companies that are simultaneously high-quality and trading at RSI < 30 are not.
RSI drops below 30 only during sustained sell-offs, not minor pullbacks. Quality companies typically don't get to RSI < 30 in healthy markets because steady earnings, low debt, and improving fundamentals attract buyers on dips. They reach RSI < 30 when macro fear overrides fundamentals: market-wide crashes, sector rotations, currency crises, geopolitical shock.
This makes the strategy fundamentally regime-dependent. On exchanges with frequent stress episodes and active local investor bases that sell quality stocks during those episodes, the signal fires often. On exchanges where bull markets run long and corrections are shallow, quality stocks rarely get to RSI < 30, and the portfolio stays in cash.
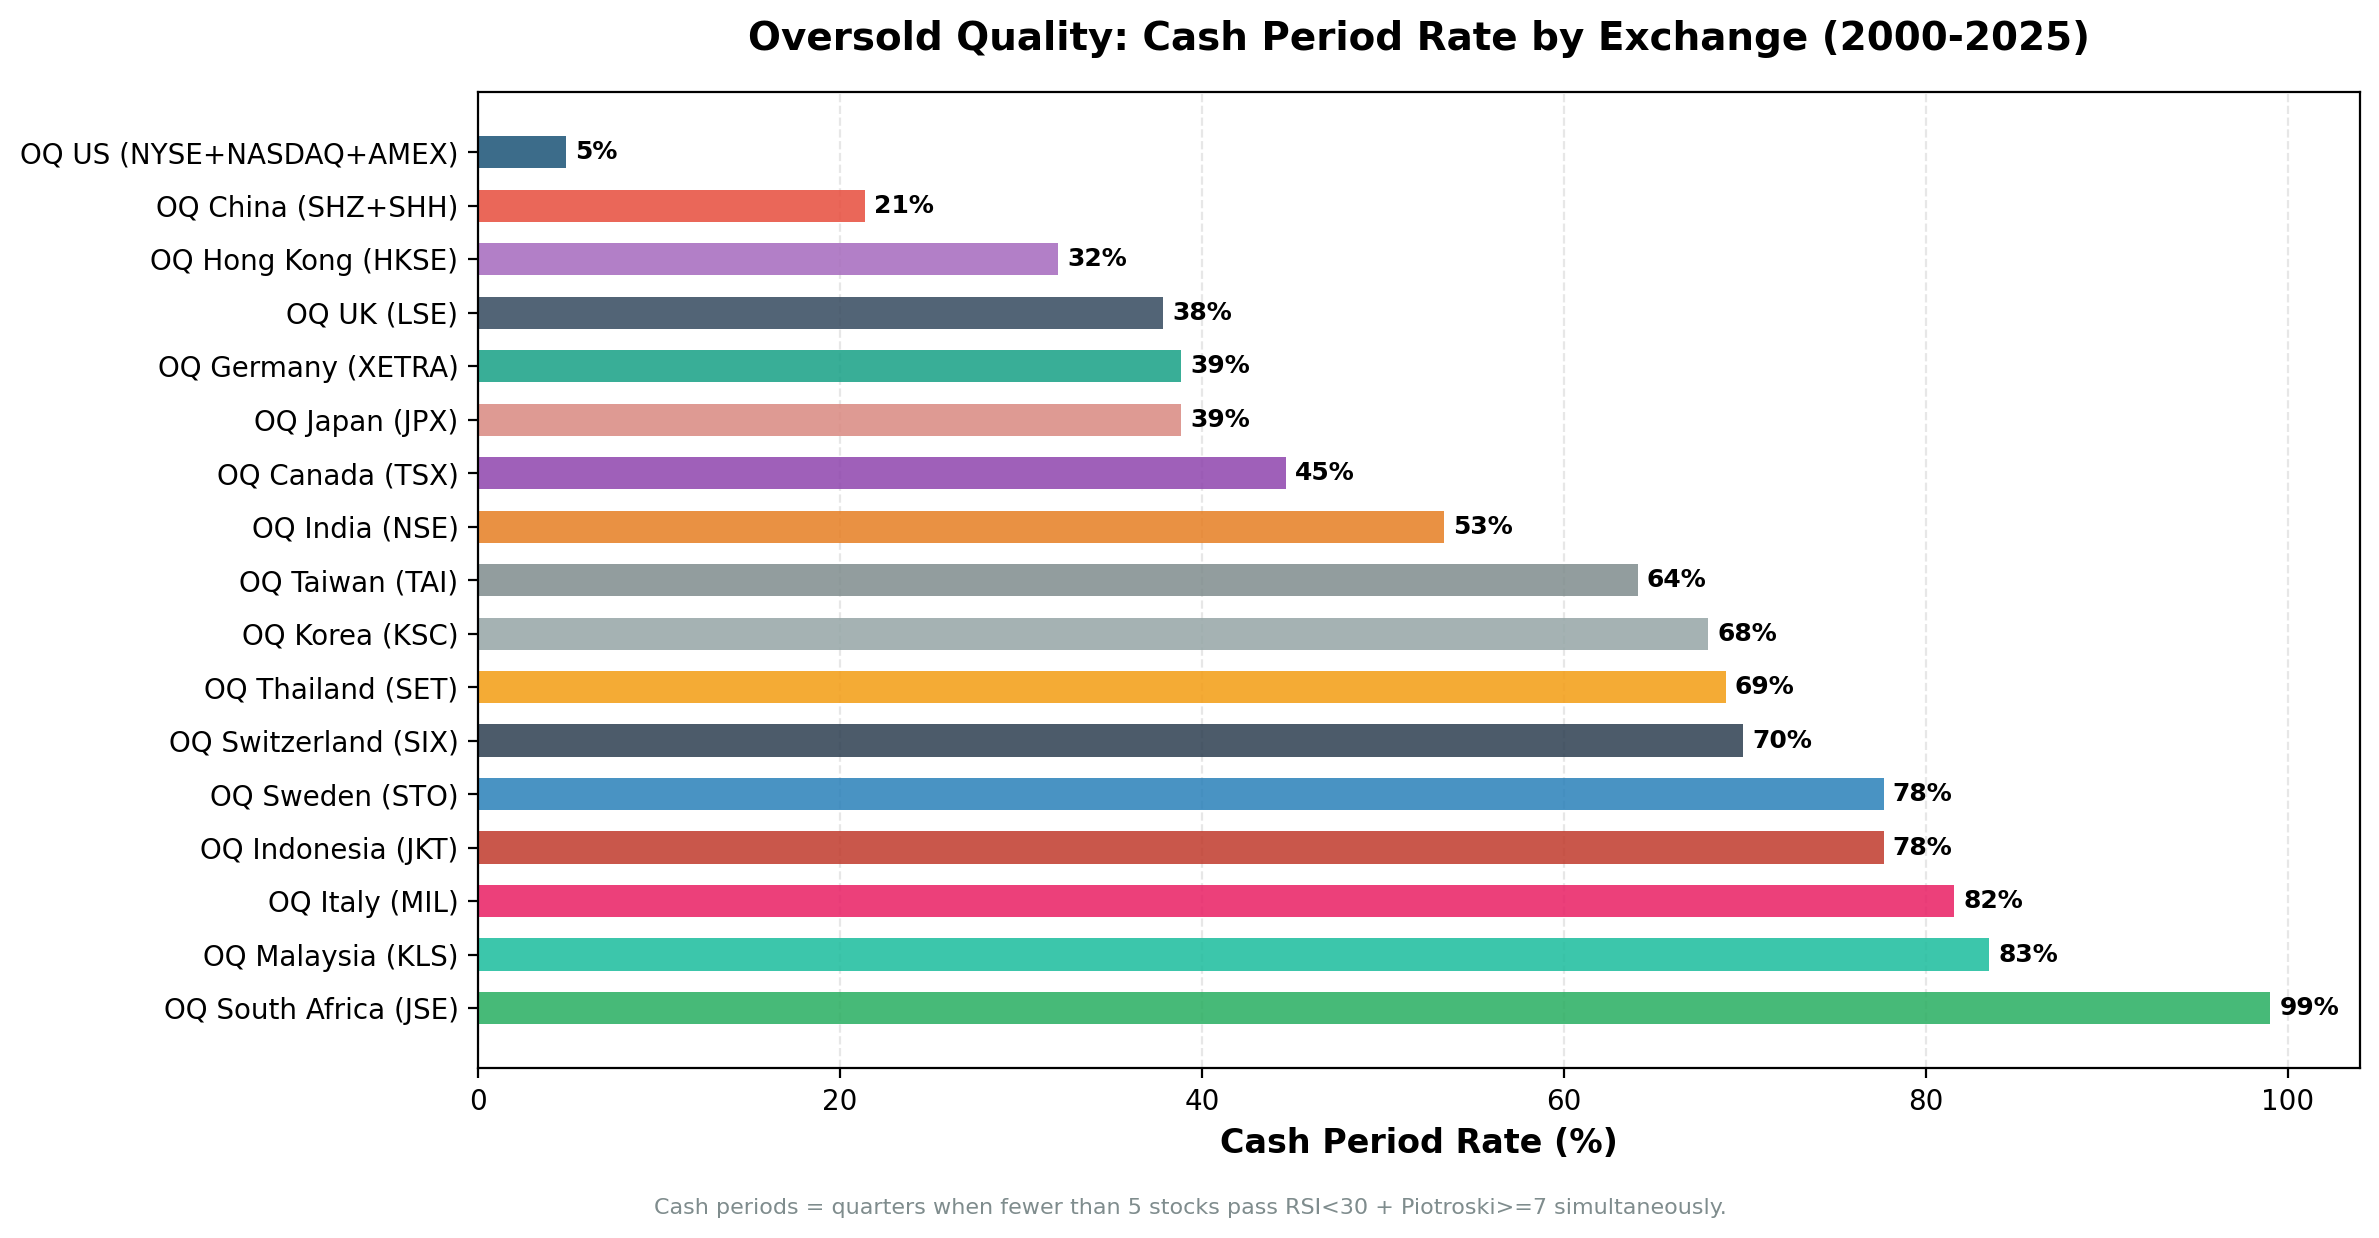
The cash rate pattern maps cleanly onto market structure:
- US (5% cash): The deepest and most volatile equity market. Quality US stocks routinely get beaten down during sector rotations, earnings-driven selloffs, and macro fear events, even in otherwise healthy markets. The signal fires almost every quarter.
- China (21% cash): A-shares have regular domestic policy-driven volatility cycles that push quality stocks into RSI < 30 independent of the US market cycle. Tightening campaigns, sector crackdowns, and exchange circuit breakers create conditions where quality companies sell off hard.
- Germany (39% cash): XETRA quality stocks went oversold during the European sovereign debt crisis, the 2018 global selloff, and COVID. Enough genuine stress events to generate signals, with long stretches of selectivity in between.
- Nordic and frontier markets (64-99% cash): Sweden, Norway, Malaysia, Indonesia experienced long domestic bull markets with few deep corrections. Quality companies there tend to attract steady institutional buying on any dip, keeping RSIs elevated and the portfolio in cash.
The Standout Exchanges
China has the highest raw excess. A 7.21% CAGR beats the SSE Composite's 4.19% by +3.02% annually over 25 years, with a 75.7% down-capture. A-share markets have genuine episodic volatility driven by policy cycles that the strategy exploits well. Quality A-share companies selected during China's own bear cycles (2008, 2011, 2015) recovered strongly against the broader Chinese market. Full China analysis here.
Germany is the best risk-adjusted result anywhere in the series. Sharpe of 0.308, volatility of 16.79% (the lowest of any functional exchange), and a 29.1% down-capture against the DAX. The maximum drawdown was -28.0% while the DAX itself fell -65.2% at its worst. That asymmetry, capturing 58% of the upside and 29% of the downside, is why a +2.05% CAGR edge produces a Sharpe more than double the index's. Full Germany analysis here.
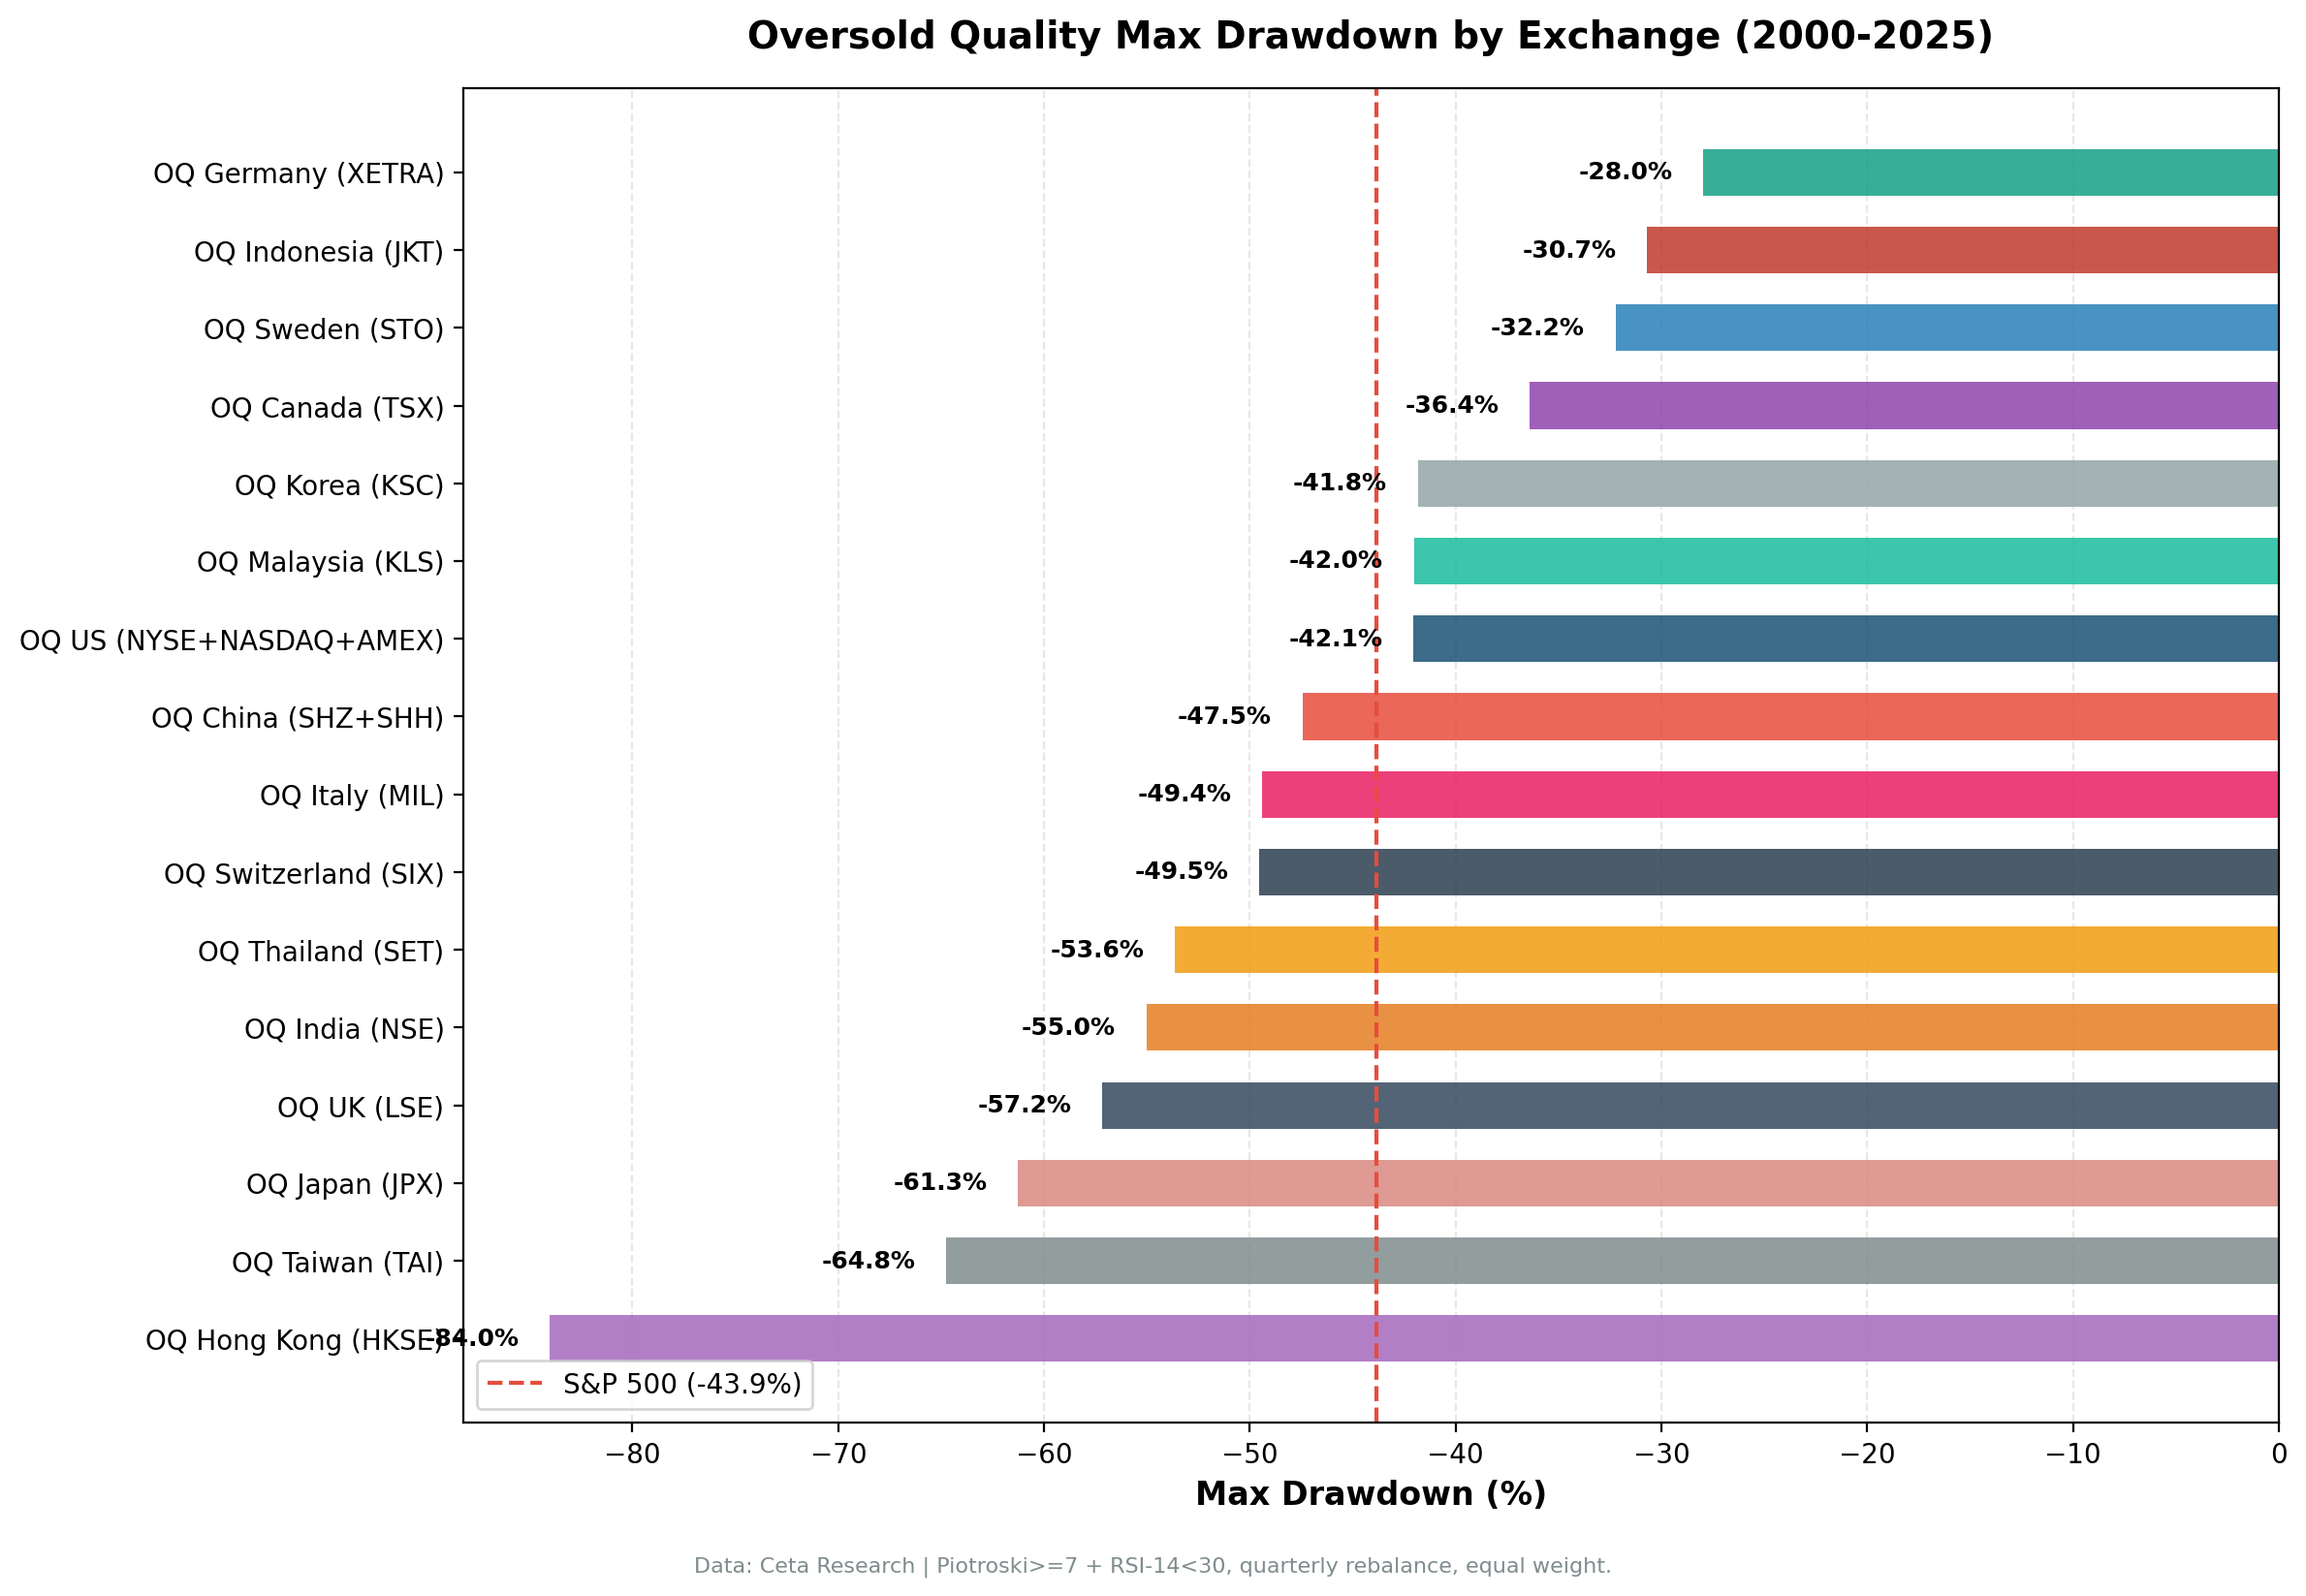
Hong Kong is the cautionary example. A 32% cash rate is comparable to Germany, but -84.0% max drawdown and -3.70% CAGR. The difference: HKSE quality stocks that got oversold during the protest era (2019) and COVID didn't recover within the quarterly rebalance window. Some didn't recover at all. The combination of political risk, regulatory uncertainty, and the structural shift of Hong Kong's equity market in this period meant the Piotroski filter couldn't protect against permanent capital loss in several positions.
When the Strategy Works Globally
The common thread across China and Germany is market structure that produces genuine, isolated stress events on quality companies. Both exchanges have large domestic institutional investor bases, significant foreign participation, and episodic crises that are local or regional rather than global in origin.
When global crises hit (2008, COVID), every exchange saw RSI < 30 on quality stocks simultaneously. The strategy fired on most exchanges at once and generally recovered with the market. The exchanges that outperform are those with additional local stress episodes: China's policy cycles, Germany's European crisis exposure. The US fires constantly but competes against an unusually strong index, so it lands at a draw rather than a win.
The strategy's core logic is sound. Quality companies that are genuinely oversold do tend to recover. The problem is that "genuinely oversold" (RSI < 30) is rare for quality companies in normal conditions, and when it does happen, the recovery timeline varies. 15 of 18 exchanges showed the recovery timing was insufficient to compensate for the cash drag and selection risk over a full 25-year cycle.
Limitations
Statistical significance: The bottom tier (Norway, South Africa, and most of Tier 3) have so few invested periods that results are noise. We include them in the table for completeness but draw no directional conclusions from 1 to 25 invested quarters over 25 years.
Look-ahead bias: Piotroski scoring uses the most recent annual filings available at each rebalance date, with a 45-day filing lag. In earlier periods (2000-2005), data completeness varies by exchange, with non-US markets having larger gaps. Results from those years carry more uncertainty.
Data quality: As noted above, we filter phantom price-data artifacts before computing returns. Different filtering choices would shift individual exchange numbers, though the top-three ranking is robust to reasonable variations.
RSI threshold sensitivity: This backtest uses RSI < 30. Relaxing to RSI < 35 or 40 would increase invested periods and likely improve absolute CAGR at the cost of selection quality. We haven't run those variants globally.
Currency effects: All returns are computed in local currency. A USD-denominated investor would have different returns depending on exchange-rate moves over the period.
Transaction costs: Estimated at 0.1% per trade each way. Actual costs on markets like Indonesia, Malaysia, or Thailand may be higher, particularly for mid-cap names.
These benchmarks leave dividends out. Portfolio returns here use dividend-adjusted prices, so they include dividends. Most of the indices we measure against do not. The FTSE 100, Hang Seng, KOSPI, Nikkei 225, OMX Stockholm 30, Oslo All Share, SET Index, SMI, SSE Composite, Sensex, TAIEX and TSX Composite are price indices, so excess return against them is overstated by roughly the local dividend yield, which has run between about 1.3% and 3.5% in these markets. Those comparisons are like for like: the S&P 500 figure runs through SPY, which is dividend-adjusted; the DAX is a performance index. Treat any edge thinner than the local yield as a tie rather than a win.
Part of a Series
This is the global comparison post in the Oversold Quality series:
- Oversold Quality US: Full Strategy Explanation and Results (flagship, full methodology)
- Oversold Quality China: Beats SSE Composite by +3.02%
- Oversold Quality Germany: Best Risk-Adjusted Returns in the Series
Data: FMP warehouse, 2000-2025. Backtest framework: ceta-research/backtests. TTM metrics as of backtest run date.
Past performance does not guarantee future results. This is educational content, not investment advice.

