
P/E Compression in China A-Shares: The Signal That Fires Constantly

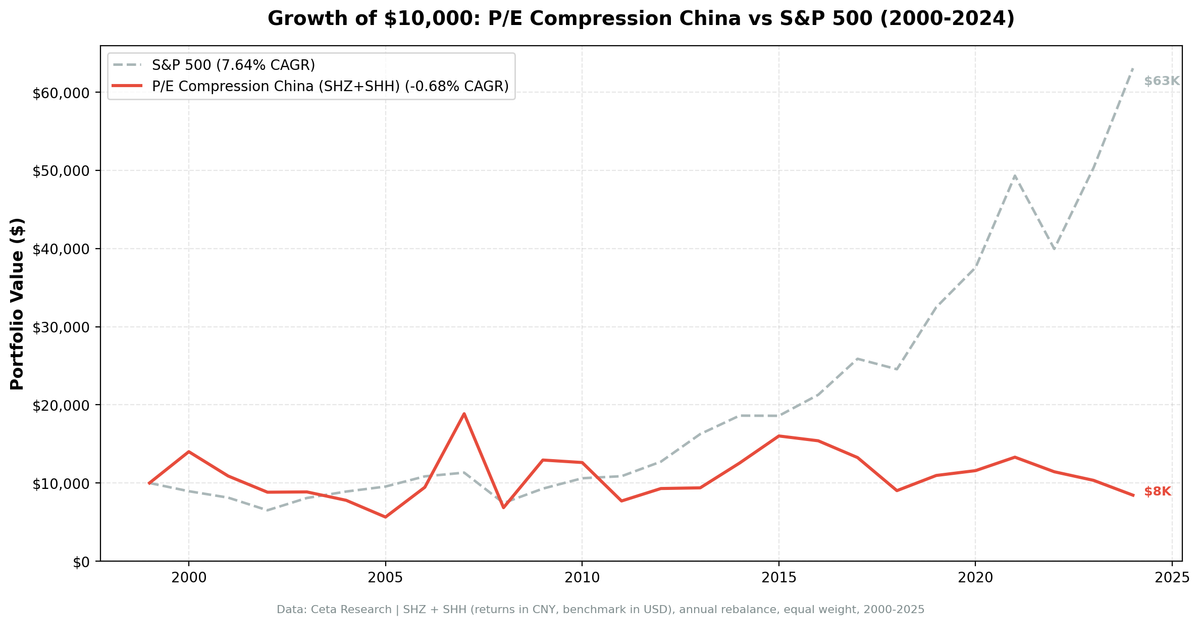
We ran the P/E compression screen on Shenzhen (SHZ) and Shanghai (SHH) A-shares from 2000 to 2025. The strategy found qualifying stocks every single year, zero cash periods across 25 years, averaging 23.9 stocks annually. -0.68% CAGR. A $10,000 investment lost $1,560 in nominal terms over 25 years, while SPY returned 530.7%. The signal fires on China A-shares with mechanical reliability. It just doesn't predict returns.
Contents
- Method
- The Strategy
- Screen
- Results
- When It Worked (Briefly)
- Why It Fails
- Full Annual Returns
- Limitations
- Run It Yourself
- Part of a Series
Method
- Data source: Ceta Research (FMP financial data warehouse)
- Universe: SHZ (Shenzhen) + SHH (Shanghai) A-shares, market cap > exchange-specific threshold
- Period: 2000-2025 (25 annual rebalance periods)
- Rebalancing: Annual (January), equal weight top 30 by compression score
- Benchmark: S&P 500 Total Return (SPY)
- Currency note: Returns in CNY. Benchmark is USD. Currency effects apply.
- Cash rule: Hold cash if fewer than 10 stocks qualify (never triggered)
Historical financial data with 45-day lag to prevent look-ahead bias. Full methodology: backtests/METHODOLOGY.md
The Strategy
P/E compression is the inverse of multiple expansion. A stock whose P/E has contracted 15%+ below its own historical average looks cheap relative to itself, not cheap in absolute terms, but cheap relative to what the market was willing to pay for this company's earnings across multiple business cycles.
The filters:
| Criterion | Metric | Threshold | Why |
|---|---|---|---|
| Valuation compression | Current P/E / 5yr avg P/E | < 0.85 | 15%+ below own history |
| Real earnings | P/E | > 5 | Positive earnings, not distressed |
| Not speculative | P/E | < 40 | Excludes story stocks |
| Profitability | Return on equity | > 10% | Business still earns decent returns |
| Leverage | Debt-to-equity | < 2.0 | Not over-leveraged |
| Liquidity | Market cap | > exchange threshold | Investable |
| History | Prior P/E data | 3+ years | Enough to compute meaningful average |
Ranking: Top 30 by most compressed (lowest current/average ratio), equal weight.
The ROE and D/E filters are designed to separate value from value traps. In China's A-share market, this separation is harder than it looks. The accounting environment means ROE figures can be less reliable than in other markets. The quality filters help at the margins, but they can't address the structural characteristics that make the signal unreliable here.
Screen
WITH fy_pe AS (
 SELECT r.symbol, r.priceToEarningsRatio AS pe, r.dateEpoch,
 ROW_NUMBER() OVER (PARTITION BY r.symbol ORDER BY r.dateEpoch DESC) AS rn,
 AVG(r.priceToEarningsRatio) OVER (
 PARTITION BY r.symbol ORDER BY r.dateEpoch
 ROWS BETWEEN 5 PRECEDING AND 1 PRECEDING
 ) AS avg_pe_5yr,
 COUNT(r.priceToEarningsRatio) OVER (
 PARTITION BY r.symbol ORDER BY r.dateEpoch
 ROWS BETWEEN 5 PRECEDING AND 1 PRECEDING
 ) AS n_prior
 FROM financial_ratios r
 JOIN profile p ON r.symbol = p.symbol
 WHERE r.period = 'FY' AND r.priceToEarningsRatio > 0 AND r.priceToEarningsRatio < 100
 AND p.exchange IN ('SHZ', 'SHH')
)
SELECT f.symbol, p.companyName, p.sector,
 ROUND(f.pe, 2) AS current_fy_pe,
 ROUND(f.avg_pe_5yr, 2) AS pe_5yr_avg,
 ROUND(f.pe / f.avg_pe_5yr, 3) AS pe_ratio_to_avg,
 ROUND((1 - f.pe / f.avg_pe_5yr) * 100, 1) AS compression_pct,
 ROUND(k.returnOnEquityTTM * 100, 1) AS roe_pct,
 ROUND(f2.debtToEquityRatioTTM, 2) AS debt_to_equity,
 ROUND(k.marketCap / 1e9, 2) AS mktcap_b
FROM fy_pe f
JOIN key_metrics_ttm k ON f.symbol = k.symbol
JOIN financial_ratios_ttm f2 ON f.symbol = f2.symbol
JOIN profile p ON f.symbol = p.symbol
WHERE f.rn = 1
 AND f.avg_pe_5yr IS NOT NULL
 AND f.n_prior >= 3
 AND f.pe > 5
 AND f.pe < 40
 AND f.pe / f.avg_pe_5yr < 0.85
 AND k.returnOnEquityTTM > 0.10
 AND (f2.debtToEquityRatioTTM IS NULL OR (f2.debtToEquityRatioTTM >= 0 AND f2.debtToEquityRatioTTM < 2.0))
ORDER BY f.pe / f.avg_pe_5yr ASC
LIMIT 30
Results
| Metric | Portfolio | S&P 500 |
|---|---|---|
| CAGR | -0.68% | 7.64% |
| Total Return | -15.6% | 530.7% |
| Max Drawdown | -63.70% | -34.90% |
| Volatility (ann.) | 38.41% | 17.51% |
| Sharpe Ratio | -0.083 | 0.322 |
| Sortino Ratio | -0.154 | — |
| Beta | 0.764 | 1.00 |
| Alpha | -7.11% | — |
| Up Capture | 69.42% | — |
| Down Capture | 84.76% | — |
| Win Rate (vs SPY) | 36.0% | — |
| Cash Periods | 0/25 | — |
| Avg Stocks | 23.9 | — |
The lowest CAGR of the 19 exchanges in this series. Negative total return over 25 years. The volatility of 38.41% is the highest we measured (nearly double SPY's 17.51%) meaning the portfolio took on far more risk while delivering negative returns.
Zero cash periods is notable. The A-share universe always contained enough stocks meeting the full quality screen. The signal never ran out of candidates. It just couldn't translate those candidates into positive excess returns.
When It Worked (Briefly)
China had extreme outlier years, almost all connected to policy-driven market events.
| Year | Portfolio | S&P 500 | Excess |
|---|---|---|---|
| 2000 | +40.1% | -10.5% | +50.6% |
| 2006 | +67.6% | +13.7% | +54.0% |
| 2007 | +99.4% | +4.4% | +95.0% |
| 2009 | +89.0% | +24.7% | +64.3% |
| 2014 | +33.8% | +14.5% | +19.3% |
| 2015 | +27.6% | -0.1% | +27.7% |
The 2007 number deserves direct acknowledgment: +99.4%. The portfolio nearly doubled. This was the peak of the pre-crisis A-share bubble, when the Shanghai Composite rose from under 2,000 to over 6,000 in roughly 18 months. Retail frenzy, policy encouragement, and speculative excess drove P/E multiples to extremes across the market. Compressed-multiple stocks caught the tide along with everything else.
Then 2008: -63.7%. The bubble unwound completely. The max drawdown of -63.70% is the worst in this series and reflects the full reversal of that speculative peak.
2014-2015 shows a similar pattern at smaller scale: policy-driven liquidity, margin lending expansion, then a sharp correction in 2016-2018.
These aren't returns generated by mean reversion in multiples. They're returns generated by riding bubbles. The years that worked weren't the years the signal was "right."
Why It Fails
The A-share market's structure makes P/E compression signals unreliable in ways that are specific to this market.
Retail investor dominance. Approximately 80% of A-share daily trading volume comes from retail investors. This isn't a marginal statistic. It means prices are driven by momentum, sentiment, and news cycles rather than earnings revisions or fundamental valuation. A compressed P/E relative to a company's 5-year history doesn't trigger institutional re-rating the way it might in the US or UK. It sits compressed until some external catalyst (policy announcement, inclusion in an index, sector narrative) moves it.
Policy as the primary catalyst. The outsized positive and negative years in the data are almost entirely policy-driven. 2007's bubble grew with government encouragement and closed with government intervention. 2009's recovery was fiscal stimulus-driven. 2014-2015 ran on margin lending policy changes and then reversed on their restriction. 2022 showed relative strength (-14.0% vs SPY's -19.0%) as the market priced in policy support that underwhelmed. The signal can't anticipate which direction policy moves or when.
The inflated reference P/E problem. P/E compression measures current P/E against a 5-year historical average. In China, that historical average often includes bubble-period valuations. A company that traded at 35x earnings in 2007 and now trades at 22x looks "compressed" by this screen, even if 22x is historically elevated. The 5-year average is contaminated by speculative peaks, making the compression signal an artifact of market normalization rather than genuine temporary undervaluation.
Poor capital allocation. Many A-share listed companies are state-owned enterprises or family-controlled businesses with weak minority shareholder protections. Capital allocation often prioritizes growth over returns. A compressed P/E in this context may reflect the market accurately pricing poor capital efficiency, not a temporary repricing that will correct. The ROE filter (>10%) catches some of this, but it doesn't screen out the broader governance environment.
2024 summary. The last two years (-9.6% in 2023, -18.4% in 2024) show the signal continuing to fail as A-share markets have struggled with property sector deleveraging, deflationary pressure, and diminishing policy effectiveness. These are structural headwinds that historical P/E averages can't model.
Full Annual Returns
| Year | Portfolio | S&P 500 | Excess |
|---|---|---|---|
| 2000 | +40.1% | -10.5% | +50.6% |
| 2001 | -22.2% | -9.2% | -13.1% |
| 2002 | -19.0% | -19.9% | +0.9% |
| 2003 | +0.4% | +24.1% | -23.7% |
| 2004 | -12.1% | +10.2% | -22.4% |
| 2005 | -27.5% | +7.2% | -34.7% |
| 2006 | +67.6% | +13.7% | +54.0% |
| 2007 | +99.4% | +4.4% | +95.0% |
| 2008 | -63.7% | -34.3% | -29.4% |
| 2009 | +89.0% | +24.7% | +64.3% |
| 2010 | -2.5% | +14.3% | -16.8% |
| 2011 | -39.0% | +2.5% | -41.5% |
| 2012 | +20.7% | +17.1% | +3.6% |
| 2013 | +0.9% | +27.8% | -26.8% |
| 2014 | +33.8% | +14.5% | +19.3% |
| 2015 | +27.6% | -0.1% | +27.7% |
| 2016 | -3.9% | +14.4% | -18.3% |
| 2017 | -13.9% | +21.6% | -35.6% |
| 2018 | -31.9% | -5.2% | -26.8% |
| 2019 | +21.5% | +32.3% | -10.8% |
| 2020 | +5.7% | +15.6% | -10.0% |
| 2021 | +14.8% | +31.3% | -16.4% |
| 2022 | -14.0% | -19.0% | +5.0% |
| 2023 | -9.6% | +26.0% | -35.6% |
| 2024 | -18.4% | +25.3% | -43.6% |
Win rate: 9 of 25 years with positive excess return.
Limitations
Currency effects. Portfolio returns are in CNY. The CNY/USD rate has moved from roughly 8.3 in 2000 to around 7.1 by 2025, meaning CNY appreciated modestly. A USD-denominated investor saw slightly better returns than the raw CNY numbers suggest, but not enough to change the conclusion.
Accounting reliability. Chinese company financial statements, particularly for smaller firms, have a less reliable audit trail than US or European markets. ROE and debt figures may be less accurate than in other markets tested in this series.
The bubble contamination problem. Five-year average P/E includes any bubble periods within the lookback window. For A-shares with the 2007 bubble in the data, this creates persistent signal distortion. A cleaner signal might require longer lookback windows or bubble-adjusted baselines.
State enterprise inclusion. The screen includes state-owned enterprises. Their capital allocation behavior differs from private firms. Separating these would likely produce a different result, though FMP data doesn't cleanly flag ownership structure.
Run It Yourself
git clone https://github.com/ceta-research/backtests.git
cd backtests

# China backtest
python3 pe-compression/backtest.py --preset china --output results.json --verbose

# Current screen
python3 pe-compression/screen.py --preset china
Part of a Series
This is the China A-shares analysis. We tested the same screen across 19 exchanges globally:
- Global comparison →. The East-West divide across 19 markets
- US analysis →, 9.97% CAGR, +2.32% excess, where it works best
- UK analysis →, 9.02% CAGR, +1.38% excess
- Hong Kong analysis →, -0.26% CAGR, 132.6% down capture
Run It Yourself
Explore the data behind this analysis on Ceta Research. Query our financial data warehouse with SQL, build custom screens, and run your own backtests across 70,000+ stocks on 20 exchanges.
Data: Ceta Research (FMP financial data warehouse), 2000-2025. Returns in CNY. Benchmark: SPY (USD). Full methodology: METHODOLOGY.md. Past performance doesn't guarantee future results.


