
P/E Compression on the London Stock Exchange: 9.02% CAGR with 60%

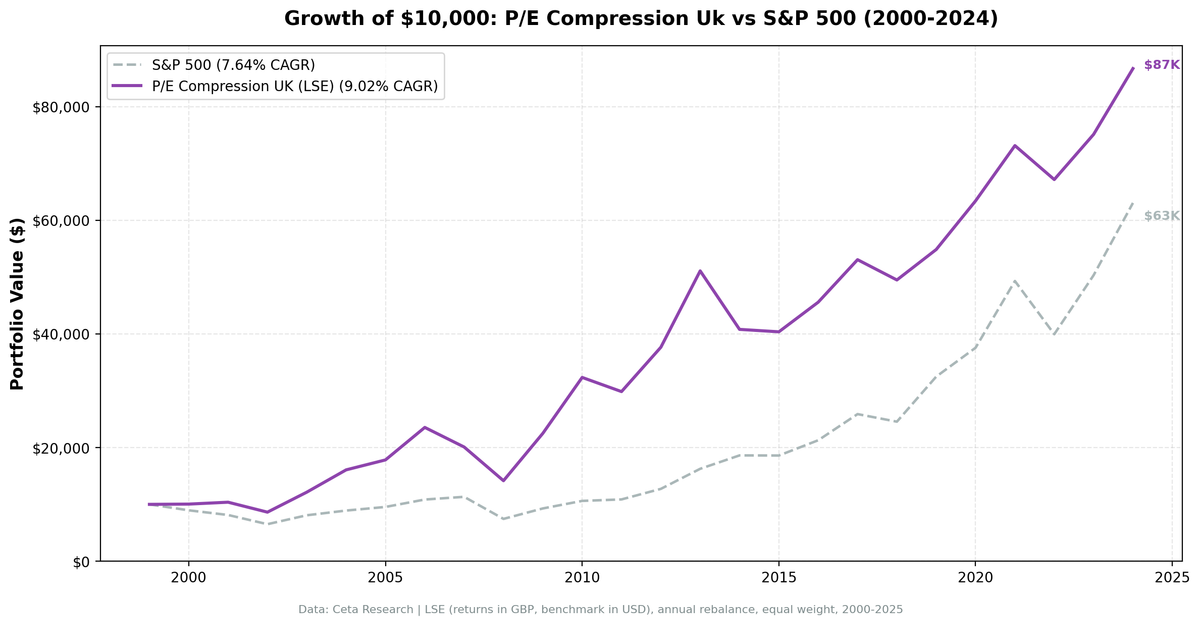
We ran our P/E compression screen on the London Stock Exchange for the first time: 25 years of data, 2000-2025, annual rebalancing. The strategy returned 9.02% annually vs 7.64% for the S&P 500. The outperformance is +1.38% per year. The more interesting number: during down markets, this strategy captured only 59.7% of the S&P 500's losses.
Contents
- Method
- The Strategy
- Screen
- Results
- When It Works
- When It Fails
- Why the UK Works (When It Does)
- Full Annual Returns
- Limitations
- Run It Yourself
- Part of a Series
This is the first time we have LSE data in our backtest library. The FMP data pipeline previously didn't include annual (FY) data for UK companies. That's now been corrected.
Method
- Data source: Ceta Research (FMP financial data warehouse)
- Universe: London Stock Exchange (LSE), market cap > £500M (~$635M USD)
- Period: 2000-2025 (25 annual rebalance periods)
- Rebalancing: Annual (January), equal weight top 30 by compression score
- Benchmark: S&P 500 Total Return (SPY)
- Cash rule: Hold cash if fewer than 10 stocks qualify
- Transaction costs: Size-tiered model
- Currency note: Returns are in GBP (local currency). Benchmark is SPY in USD.
Historical financial data with 45-day lag. Full methodology: backtests/METHODOLOGY.md
The Strategy
Identical signal to the US screen: find LSE-listed stocks where the current annual P/E has compressed 15%+ below the company's own 5-year historical average, with ROE > 10% and D/E < 2.0 confirming fundamentals remain intact.
| Criterion | Threshold |
|---|---|
| P/E compression | Current P/E < 85% of 5-year average |
| P/E range | 5 – 40 |
| Return on equity | > 10% |
| Debt-to-equity | < 2.0 |
| Market cap | > £500M (~$635M USD) |
| PE history | 3+ prior annual data points |
Screen
WITH fy_pe AS (
 SELECT r.symbol, r.priceToEarningsRatio AS pe, r.dateEpoch,
 ROW_NUMBER() OVER (PARTITION BY r.symbol ORDER BY r.dateEpoch DESC) AS rn,
 AVG(r.priceToEarningsRatio) OVER (
 PARTITION BY r.symbol ORDER BY r.dateEpoch
 ROWS BETWEEN 5 PRECEDING AND 1 PRECEDING
 ) AS avg_pe_5yr,
 COUNT(r.priceToEarningsRatio) OVER (
 PARTITION BY r.symbol ORDER BY r.dateEpoch
 ROWS BETWEEN 5 PRECEDING AND 1 PRECEDING
 ) AS n_prior
 FROM financial_ratios r
 JOIN profile p ON r.symbol = p.symbol
 WHERE r.period = 'FY' AND r.priceToEarningsRatio > 0 AND r.priceToEarningsRatio < 100
 AND p.exchange = 'LSE'
)
SELECT f.symbol, p.companyName, p.sector,
 ROUND(f.pe, 2) AS current_fy_pe,
 ROUND(f.avg_pe_5yr, 2) AS pe_5yr_avg,
 ROUND(f.pe / f.avg_pe_5yr, 3) AS pe_ratio_to_avg,
 ROUND((1 - f.pe / f.avg_pe_5yr) * 100, 1) AS compression_pct,
 ROUND(k.returnOnEquityTTM * 100, 1) AS roe_pct,
 ROUND(k.marketCap / 1e9, 2) AS mktcap_b
FROM fy_pe f
JOIN key_metrics_ttm k ON f.symbol = k.symbol
JOIN profile p ON f.symbol = p.symbol
WHERE f.rn = 1
 AND f.avg_pe_5yr IS NOT NULL
 AND f.n_prior >= 3
 AND f.pe > 5
 AND f.pe < 40
 AND f.pe / f.avg_pe_5yr < 0.85
 AND k.returnOnEquityTTM > 0.10
 AND k.marketCap > 500000000
ORDER BY f.pe / f.avg_pe_5yr ASC
LIMIT 30
Results
| Metric | Portfolio | S&P 500 |
|---|---|---|
| CAGR | 9.02% | 7.64% |
| Total Return | 812.6% | 530.7% |
| Max Drawdown | -39.85% | -34.90% |
| Volatility (ann.) | 21.87% | 17.51% |
| Sharpe Ratio | 0.253 | 0.322 |
| Sortino Ratio | 0.523 | — |
| Beta | 0.849 | 1.00 |
| Alpha | 2.0% | — |
| Up Capture | 102.9% | — |
| Down Capture | 59.7% | — |
| Win Rate (vs SPY) | 52.0% | — |
| Cash Periods | 0/25 | — |
| Avg Stocks | 14.0 | — |
Note: The Sharpe ratio (0.253) looks lower than the US version (0.382) despite similar excess returns because the UK risk-free rate (3.5%) is higher than the US rate (2.0%). On a raw return basis, the strategies perform similarly. The UK version just clears a higher hurdle before earning risk-adjusted alpha.
The down capture of 59.7% stands out. During years when SPY fell, this portfolio fell 59.7% as much. That's more defensive than the US version (68.6%). The average UK portfolio held 14 stocks, half the number of the US portfolio. With fewer positions and a more value-tilted market, the compression signal may work more cleanly.
When It Works
2003-2004 (Post-Dotcom Recovery): +40.8% and +32.3%, 16.6% and 22.1% ahead of SPY. Companies whose UK-listed P/Es compressed during the 2001-2002 drawdown recovered sharply.
2009-2010 (Post-Crisis): The strongest two-year run.
| Year | Portfolio | S&P 500 | Excess |
|---|---|---|---|
| 2009 | +58.9% | +24.7% | +34.1% |
| 2010 | +43.8% | +14.3% | +29.4% |
83% in two years. UK financials and industrials, whose P/Es compressed deeply in 2008, bounced violently when stabilization became clear. The quality filters kept the worst cases out, the ones that genuinely deteriorated rather than just got scared.
2012-2013: +26.1% and +35.7%, beating SPY by 9.1% and 7.9%. The Eurozone crisis compressed UK multiples beyond fundamentals' reality. The reversion was clean.
When It Fails
2007: -14.7% vs SPY +4.4% (-19.1% excess). UK financials had begun their pre-crisis deterioration before the US market priced it. A compressed P/E in a company that was actually about to see earnings collapse is a value trap. 2007 is the clearest example of the signal firing on the wrong companies.
2014: -20.1% vs SPY +14.5% (-34.6% excess). The worst single year. The UK market was going through sector-level repricing in energy and materials, and positions that looked compressed turned out to be correct re-ratings. This is the key limitation: the screen can't distinguish between "temporarily cheap" and "appropriately repriced."
2019-2021: Consistently lagged as growth leadership dominated global markets.
| Year | Portfolio | S&P 500 | Excess |
|---|---|---|---|
| 2019 | +10.8% | +32.3% | -21.5% |
| 2021 | +15.3% | +31.3% | -15.9% |
Why the UK Works (When It Does)
The LSE has a different composition than the S&P 500. It's heavily weighted toward financials, energy, mining, and consumer staples. These are cyclical sectors with natural PE cycles, they get cheap in downturns and re-rate when cycles turn. The compression signal captures this pattern well.
It's also a market with less mega-cap technology concentration. FTSE 100 leadership doesn't rotate to a handful of 50x earnings companies the way S&P 500 leadership has since 2015. That means compressed-P/E portfolios don't face the same structural headwind they encounter in the US.
Full Annual Returns
| Year | Portfolio | S&P 500 | Excess |
|---|---|---|---|
| 2000 | +0.5% | -10.5% | +11.0% |
| 2001 | +3.3% | -9.2% | +12.5% |
| 2002 | -16.9% | -19.9% | +3.0% |
| 2003 | +40.8% | +24.1% | +16.6% |
| 2004 | +32.3% | +10.2% | +22.1% |
| 2005 | +10.9% | +7.2% | +3.7% |
| 2006 | +32.1% | +13.7% | +18.4% |
| 2007 | -14.7% | +4.4% | -19.1% |
| 2008 | -29.5% | -34.3% | +4.8% |
| 2009 | +58.9% | +24.7% | +34.1% |
| 2010 | +43.8% | +14.3% | +29.4% |
| 2011 | -7.7% | +2.5% | -10.2% |
| 2012 | +26.1% | +17.1% | +9.1% |
| 2013 | +35.7% | +27.8% | +7.9% |
| 2014 | -20.1% | +14.5% | -34.6% |
| 2015 | -1.1% | -0.1% | -0.9% |
| 2016 | +12.9% | +14.4% | -1.5% |
| 2017 | +16.4% | +21.6% | -5.2% |
| 2018 | -6.7% | -5.2% | -1.6% |
| 2019 | +10.8% | +32.3% | -21.5% |
| 2020 | +15.6% | +15.6% | 0.0% |
| 2021 | +15.3% | +31.3% | -15.9% |
| 2022 | -8.2% | -19.0% | +10.8% |
| 2023 | +11.8% | +26.0% | -14.2% |
| 2024 | +15.4% | +25.3% | -9.9% |
Limitations
14 average stocks. The portfolio held an average of 14 stocks, not the full 30 the screen targets. Fewer qualifying stocks means more concentration risk. In a year like 2014, a handful of bad positions caused the full year loss.
Currency risk. Returns are in GBP. The S&P 500 benchmark is in USD. The comparison mixes currencies, which is a methodological impurity. GBP/USD movements affect relative performance in ways unrelated to the strategy.
New data. This is the first time we've run a full 25-year backtest on LSE data. These results haven't been checked across different parameter choices or compared against other UK strategies. Treat them as a first look, not a confirmed signal.
The 2007-2008 sequence. The strategy lost -14.7% in 2007 (when SPY gained) then -29.5% in 2008 (less than SPY's -34.3%, but still a large absolute loss). Two consecutive bad years in a row is a meaningful drawdown profile.
Run It Yourself
git clone https://github.com/ceta-research/backtests.git
cd backtests

python3 pe-compression/backtest.py --preset uk --output results.json --verbose
python3 pe-compression/screen.py --preset uk
Part of a Series
- US analysis →. The flagship: 9.97% CAGR, +2.32% excess, 113% up capture
- Canada analysis →. The defensiveness story: 23.7% down capture
- Global comparison →, 19 markets, the East-West split
Run It Yourself
Explore the data behind this analysis on Ceta Research. Query our financial data warehouse with SQL, build custom screens, and run your own backtests across 70,000+ stocks on 20 exchanges.
Data: Ceta Research (FMP financial data warehouse), 2000-2025. Universe: LSE. Returns in GBP. Benchmark: SPY (USD). Full methodology: METHODOLOGY.md. Past performance doesn't guarantee future results.


