
Hong Kong P/E Compression: -0.32% CAGR, -0.81% vs Hang Seng
P/E compression on Hong Kong stocks returns -0.32% CAGR vs 0.49% for the Hang Seng. Both the strategy and the local market failed to deliver real returns over 25 years. Down-capture is 95% vs the local benchmark.

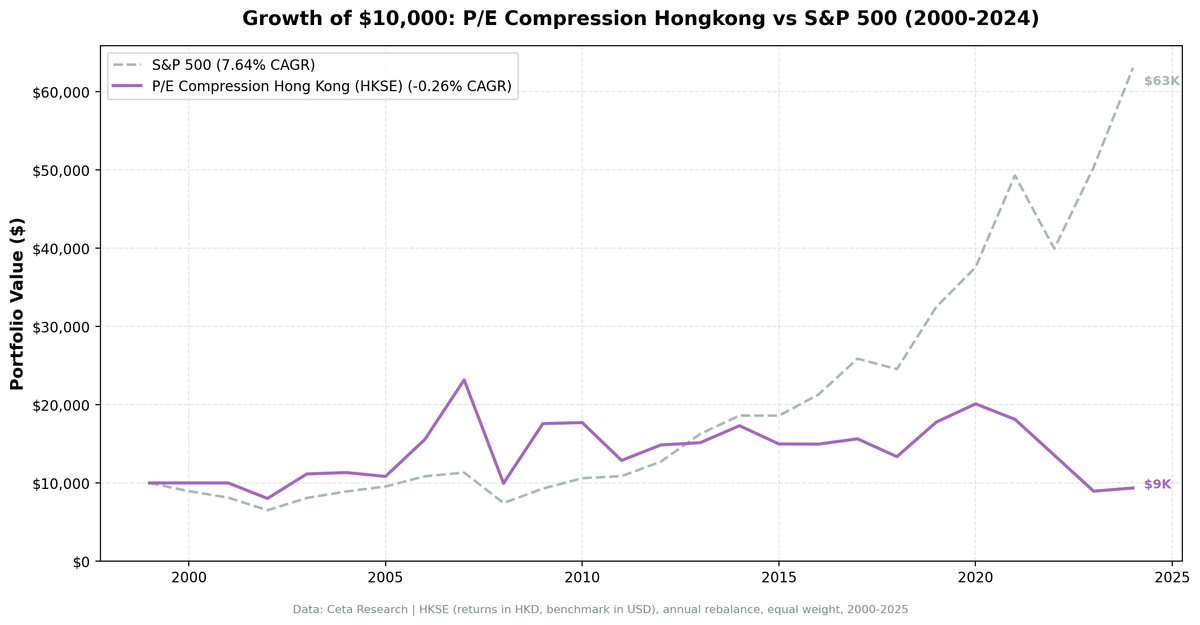
P/E compression on Hong Kong stocks returns -0.32% CAGR vs 0.49% for the Hang Seng, underperforming by 0.81% annually. The Hang Seng itself barely moved over 25 years. Both the strategy and the local market failed to generate meaningful returns. Against the local benchmark, the strategy is essentially flat. In absolute terms, it loses money.
Contents
Data: FMP financial data warehouse, 2000–2025. Updated March 2026.
Method
Universe: HKSE, market cap > HK$5B Period: 2000-2025 (25 years) Benchmark: Hang Seng Index (HKD)
Returns in HKD. Benchmark in HKD.
What We Found

| Metric | Hong Kong | Hang Seng |
|---|---|---|
| CAGR | -0.32% | 0.49% |
| Excess | -0.81% | - |
| Sharpe | -0.115 | - |
| MaxDD | -61.30% | - |
| Down-Cap | 95.29% | 100% |
| Up-Cap | 101.62% | 100% |
| Avg Stocks | 20.3 | - |
| Cash | 2/25 (8%) | - |
Negative absolute CAGR. Negative Sharpe. Max drawdown of -61.30%. The down-capture of 95.29% means the strategy nearly matches the Hang Seng in down years (slightly better than the old 133% vs SPY, but still not protecting on the downside). The up-capture of 101.62% shows the strategy tracks the local market closely in both directions.
When compared against the Hang Seng rather than SPY, the underperformance shrinks to -0.81% annually. That's because the Hang Seng itself delivered almost nothing over 25 years. This isn't a story of the strategy failing while the local market thrived. Both failed.
Why Hong Kong Is a Difficult Market
China exposure. Hong Kong stocks are heavily exposed to China's economy and policy. Political and regulatory risks create massive volatility that P/E compression can't navigate.
Structural headwinds. Hong Kong experienced property market bubbles, political instability, and capital outflows. Compressed P/E ratios often reflected permanent valuation resets, not temporary dislocations.
Value traps. Many Hong Kong financials and property developers traded at compressed multiples for years because their business models deteriorated. These weren't mean reversion opportunities.
Conclusion
The HK P/E compression strategy barely underperforms the Hang Seng (-0.81% annually), but that's cold comfort when both deliver negative or near-zero absolute returns. The Hang Seng returned just 0.49% annually over 25 years. The strategy returned -0.32%. Neither worked. If you're looking for a reason to avoid HK P/E compression, it's not that the strategy trails the local market badly. It's that the absolute return is negative and the max drawdown is -61%.
Data: Ceta Research. Returns in HKD. github.com/ceta-research/backtests
Past performance does not guarantee future results. This is educational content, not investment advice.


