Pre-Earnings Runup: 14 Markets, Local Benchmarks, Honest Results

We ran the pre-earnings event study on 14 exchanges using local currency index benchmarks. The results changed significantly from our original analysis, which used US-listed ETFs. Several findings that looked real turned out to be benchmark artifacts.
Contents
- Method
- Global Results
- What Changed From the Original Analysis
- Where the Effect Is Strongest
- Markets With No Effect
- Markets With Negative Effects
- Data Quality Notes
- What Drives Cross-Country Variation
- Limitations
- Takeaway
- References
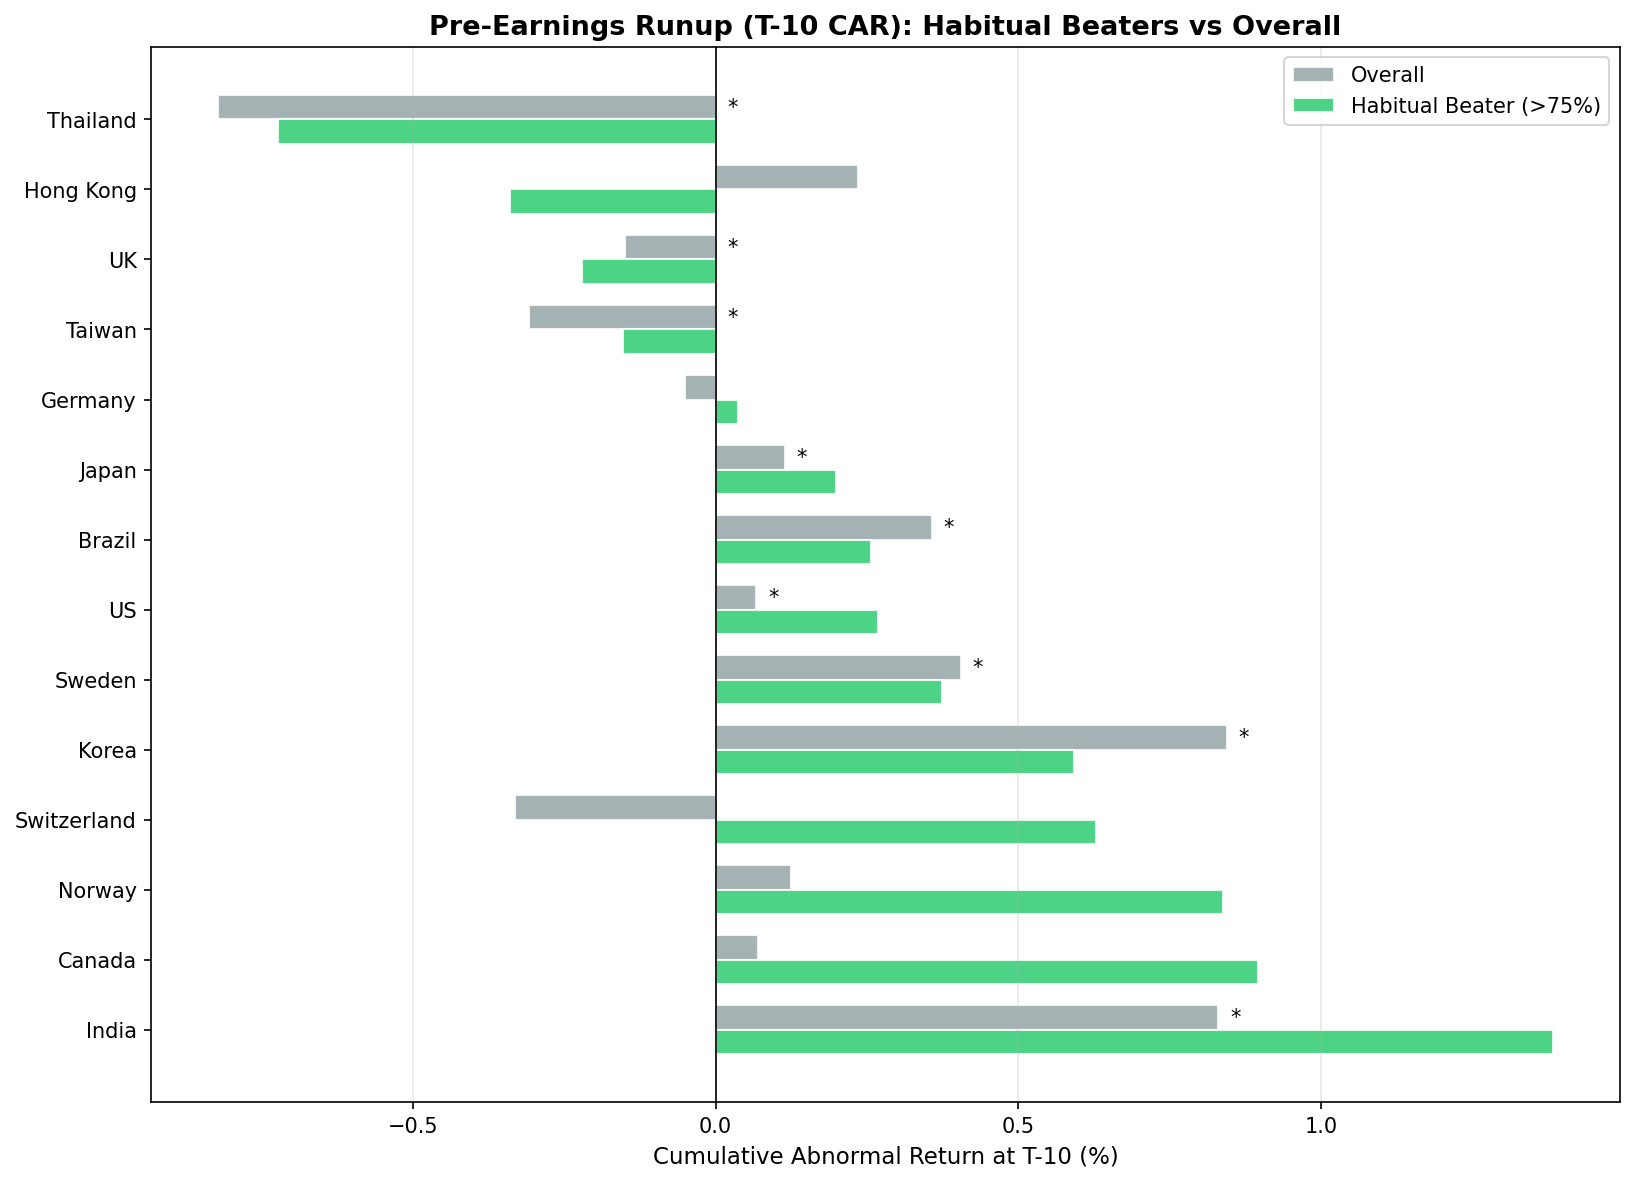
Korea and India still lead at +0.709% and +0.587% T-10 CAR respectively. The US shows a modest but robust +0.067%. Japan's effect disappeared entirely. Taiwan flipped from negative to marginally positive. Thailand's extreme negative result compressed to near zero.
The lesson: benchmark choice matters more than most event studies acknowledge.
Method
Same event study design applied to each exchange independently:
- Signal: Cumulative abnormal return (CAR) in the 10, 5, and 1 trading days before a scheduled earnings announcement
- Universe: Exchange-specific market cap thresholds (adjusted per market)
- Benchmark: Local currency index per exchange (Nikkei 225 for Japan, KOSPI for Korea, Sensex for India, etc.)
- Abnormal return: Stock return minus local benchmark return over the same window
- Windows: T-10, T-5, T-1 trading days before announcement date
- Winsorization: 1st/99th percentile
- Significance: Two-sided t-test; ** = p<0.01, * = p<0.05
Key change from original analysis: All non-US exchanges now use local currency indices instead of US-listed ETFs. This ensures the trading calendar, currency, and market exposure match the stocks being studied. See the "What Changed" section for details.
Global Results
| Exchange | Benchmark | Events | T-10 CAR | t-stat | Data History |
|---|---|---|---|---|---|
| Korea (KSC) | KOSPI | 6,626 | +0.709% | 9.02** | 2016-2025 |
| India (BSE/NSE) | Sensex | 10,750 | +0.587% | 10.46** | 2023-2025* |
| Sweden (STO) | OMX Stockholm 30 | 5,059 | +0.315% | 2.77** | 2010-2025 |
| Brazil (SAO) | Bovespa | 4,639 | +0.315% | 3.23** | 2015-2025 |
| Norway (OSL) | Oslo All Share | 1,638 | +0.221% | 1.27 | 2013-2025 |
| Hong Kong (HKSE) | Hang Seng | 3,229 | +0.106% | 0.89 | 2021-2025* |
| Taiwan (TAI/TWO) | TAIEX | 14,585 | +0.100% | 1.97* | 2015-2025 |
| US (NYSE/NASDAQ/AMEX) | S&P 500 | 163,661 | +0.067% | 3.73** | 2000-2025 |
| Canada (TSX) | TSX Composite | 20,253 | +0.007% | 0.15 | 2000-2025 |
| Japan (JPX) | Nikkei 225 | 15,216 | -0.014% | -0.36 | 2017-2025 |
| Thailand (SET) | SET Index | 3,782 | -0.080% | -0.95 | 2015-2025 |
| Switzerland (SIX) | SMI | 1,498 | -0.121% | -0.71 | 2010-2025 |
| Germany (XETRA) | DAX | 4,508 | -0.168% | -1.68 | 2022-2025* |
| UK (LSE) | FTSE 100 | 9,924 | -0.192% | -2.60** | 2021-2025* |
*Sparse early data coverage.
8 of 14 exchanges show positive T-10 CAR. Only 3 are statistically significant at p<0.01: Korea, India, and the US. Sweden is significant at p<0.01, Brazil at p<0.01.
What Changed From the Original Analysis
The biggest methodological improvement: switching every non-US exchange from US-listed ETFs to local currency index benchmarks.
| Exchange | Old Benchmark | Old T-10 | New Benchmark | New T-10 | Change |
|---|---|---|---|---|---|
| Korea | EWY | +0.844% | KOSPI | +0.709% | -0.14pp |
| India | INDA | +0.829% | Sensex | +0.587% | -0.24pp |
| Japan | EWJ | +0.114%** | Nikkei 225 | -0.014% | Lost significance |
| Taiwan | SPY | -0.309%** | TAIEX | +0.100%* | Sign flipped |
| Thailand | SPY | -0.821%** | SET Index | -0.080% | Lost significance |
| UK | EWU | -0.149%* | FTSE 100 | -0.192%** | Slightly worse |
Japan is the most important change. What looked like a modest but real pre-earnings drift (+0.114%, t=2.77) was largely an artifact of benchmarking against EWJ. Against the Nikkei 225, the effect is zero.
Taiwan and Thailand are equally revealing. Both showed strongly negative drift against SPY. Against their local indices, Taiwan is marginally positive and Thailand is near zero. The "negative pre-earnings effect" in these markets was mostly a reflection of their currencies and markets underperforming the US dollar and S&P 500 during the study period.
Where the Effect Is Strongest
Korea (+0.709%, t=9.02) and India (+0.587%, t=10.46) both show large, significant pre-earnings drift even against local benchmarks. These are real effects, not benchmark artifacts.
Korea's result rests on 6,626 events over 9 years. The effect is structurally different from the US: in Korea, beat rate doesn't predict the drift. Missers, mixed stocks, and beaters all drift by similar amounts. See the Korea analysis for details.
India's t-statistic is very high, but the data history is short, roughly 2-3 years of dense coverage. Treat India's number as a strong preliminary finding.
Sweden (+0.315%, t=2.77) and Brazil (+0.315%, t=3.23) both show meaningful, significant effects across 10-15 years of data.
Markets With No Effect
Japan (-0.014%, t=-0.36) and Canada (+0.007%, t=0.15) show no pre-earnings drift against their local benchmarks. These are efficiently priced markets where the pre-earnings premium either doesn't exist or has been arbitraged away.
Japan is notable because the original analysis showed a statistically significant result. The benchmark change exposed this as an artifact. Conservative Japanese guidance culture and cross-shareholding structures may suppress the pre-earnings positioning that drives the effect in other markets.
Markets With Negative Effects
UK (-0.192%, t=-2.60) is the only market with a statistically significant negative pre-earnings drift against its local benchmark. The data coverage is sparse before 2021, so this is roughly 4 years of effective history.
Germany (-0.168%, t=-1.68) and Switzerland (-0.121%, t=-0.71) also show negative results, though neither reaches significance.
Thailand (-0.080%, t=-0.95) went from the most dramatically negative result in our original analysis (-0.821% vs SPY) to near zero against the SET Index. The extreme negative finding was almost entirely a SPY benchmark artifact.
Data Quality Notes
The exchanges fall into three reliability tiers:
Full history (20+ years): US, Canada. These results span multiple full market cycles. Most reliable.
Solid history (8-15 years): Korea, Japan, Norway, Switzerland, Sweden, Taiwan, Thailand, Brazil. Reasonably reliable.
Sparse early data (3-4 effective years): India (BSE/NSE), UK (LSE), Germany (XETRA), Hong Kong (HKSE). Results from these four should be treated as preliminary.
What Drives Cross-Country Variation
Korea and India at +0.7% and +0.6%, while Japan and Canada sit at zero. Several structural factors likely explain the difference:
Analyst coverage density. Fewer analysts per listed company means less pre-announcement information diffusion. Markets with thinner coverage tend to show stronger drift.
Options market development. Where single-stock options markets are deep and active, delta-hedging creates mechanical buying pressure that either amplifies or efficiently prices in the effect. Less developed options markets may leave more room for the drift.
Institutional trading behavior. Systematic earnings-season positioning is more developed in the US, Canada, and Japan. More capital targeting the pattern compresses the available premium.
Retail participation. Korea and India have high retail trading volumes relative to institutional flow. Calendar-driven retail positioning may create the broad, undifferentiated drift observed in those markets.
Limitations
Variable data windows. Comparing Korea (2016-2025) to the US (2000-2025) conflates market-structure effects with sample-period effects.
No portfolio-level costs. CAR numbers don't include transaction costs, spreads, or market impact.
Index benchmark limitations. Local indices are market-cap-weighted and may not perfectly represent the stock universe being studied. A broader benchmark (TOPIX for Japan, S&P/TSX Composite for Canada) or equal-weighted index could produce slightly different results.
Takeaway
Pre-earnings drift is not universal. With local benchmarks, the effect is clearly significant in 4 markets (Korea, India, US, Sweden/Brazil), absent in 4 (Japan, Canada, Hong Kong, Norway), and negative in 3 (UK, Germany, Switzerland). Thailand and Taiwan are near zero.
The cleanest finding from the benchmark correction: always use local currency indices for cross-market event studies. US-listed ETFs introduced systematic biases that inflated results in some markets (Japan, India) and distorted them in others (Taiwan, Thailand). The corrected rankings better reflect where the pre-earnings premium actually exists.

Data: Ceta Research (FMP financial data). Event study: earnings_surprises + stock_eod + key_metrics tables. Exchange-specific market cap thresholds and local currency index benchmarks. Winsorized at 1%/99%. India, UK, Germany, Hong Kong data coverage sparse before 2021-2023. This is educational content, not investment advice.
References
- Barber, B., De George, E., Lehavy, R. & Trueman, B. (2013). "The Earnings Announcement Premium and Trading Volume." Review of Accounting Studies, 18(1), 66-114.
- So, E. & Wang, S. (2014). "News-Driven Return Reversals: Liquidity Provision Ahead of Earnings Announcements." Journal of Financial Economics, 114(1), 20-35.