Pre-Earnings Runup in Korea: +0.71% Drift, But Beat Rate Doesn't Explain It

Korea's pre-earnings pattern looks nothing like the US.
Contents
- Method
- Results
- Overall
- By Beat-Rate Category
- The Unusual Pattern
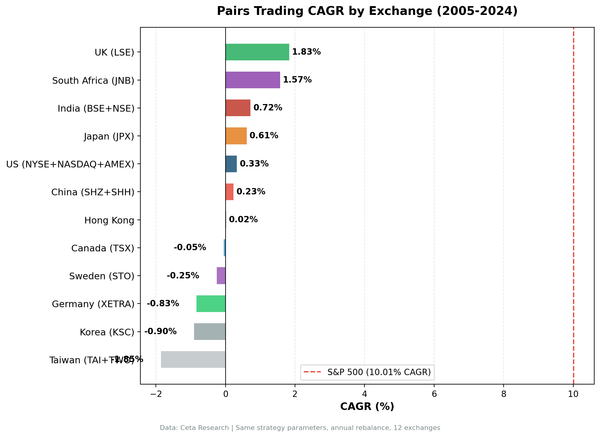
- Benchmark Update: EWY to KOSPI
- Why Korea May Be Different
- Data Coverage
- Limitations
- Takeaway
In the US, the pre-earnings runup is selective. Habitual beaters, stocks that consistently beat analyst estimates, drift upward before announcements. Habitual missers go nowhere or drift negative. Beat history is the key variable.
Korea breaks that model. We ran the same event study on KSC-listed stocks from 2016 to 2025 and found a +0.709% abnormal return vs KOSPI in the 10 trading days before earnings. That's roughly 10x the US average over the same window. The unusual part: it doesn't matter whether the stock has a good or bad track record. Missers drift just as much as the mixed group.
Method
Universe: KSC stocks (KOSPI) with exchange-specific market cap filter and at least 4 prior earnings reports with analyst estimates. Period: Effective coverage 2016-2025. Benchmark: KOSPI (local currency index, same calendar and currency as portfolio stocks). Events: 6,626 earnings announcements. Beat-rate categories: Habitual beater (>75% beat rate, 8+ quarters), mixed (25-75%), habitual misser (<25%). Abnormal return: Stock return minus KOSPI return over the same pre-announcement window. Winsorization: 1%/99% to reduce outlier influence.
Same methodology as the US study. The differences are the exchange, benchmark, and market cap threshold.
Results
Overall
| Window | Mean CAR | t-stat | Hit Rate |
|---|---|---|---|
| T-10 | +0.709% | 9.02** | 51.0% |
| T-5 | +0.608% | 10.41** | 52.8% |
| T-1 | +0.257% | 7.66** | 51.4% |
| T+1 | -0.055% | -1.22 | 47.2% |
All pre-announcement windows are statistically significant. T+1 (announcement day itself) is not. The drift is pre-earnings, not post.
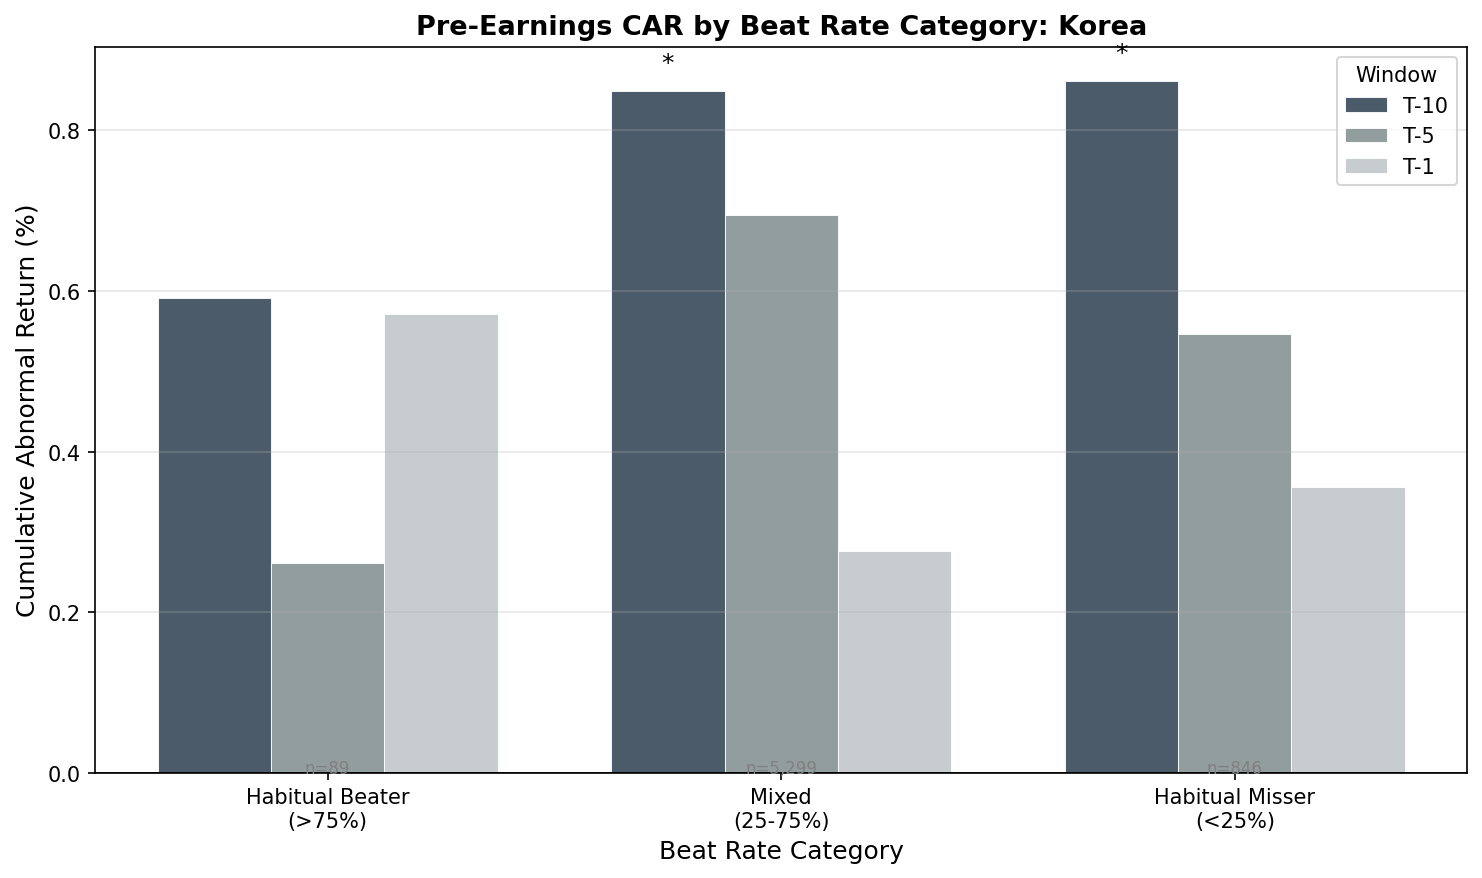
By Beat-Rate Category
| Category | T-10 CAR | t-stat | T-5 CAR | T-1 CAR | T+1 CAR | N |
|---|---|---|---|---|---|---|
| Overall | +0.709% | 9.02** | +0.608% | +0.257% | -0.055% | 6,626 |
| Mixed | +0.728% | 8.64** | +0.651% | +0.259% | -0.067% | 5,650 |
| Habitual Misser | +0.610% | 2.60** | +0.392% | +0.225% | +0.068% | 885 |
| Habitual Beater | +0.636% | 1.04 | +0.425% | +0.593% | -0.414% | 91 |
The habitual beater row (n=91) is too small for reliable inference. The t-stat of 1.04 is not significant, and 91 events across 10 years means the estimate is noisy.
What remains is striking. Mixed stocks (+0.728%, t=8.64) and habitual missers (+0.610%, t=2.60) both show pre-earnings drift of similar magnitude. In the US, missers showed -0.479% at T-10. Here, they're at +0.61%.
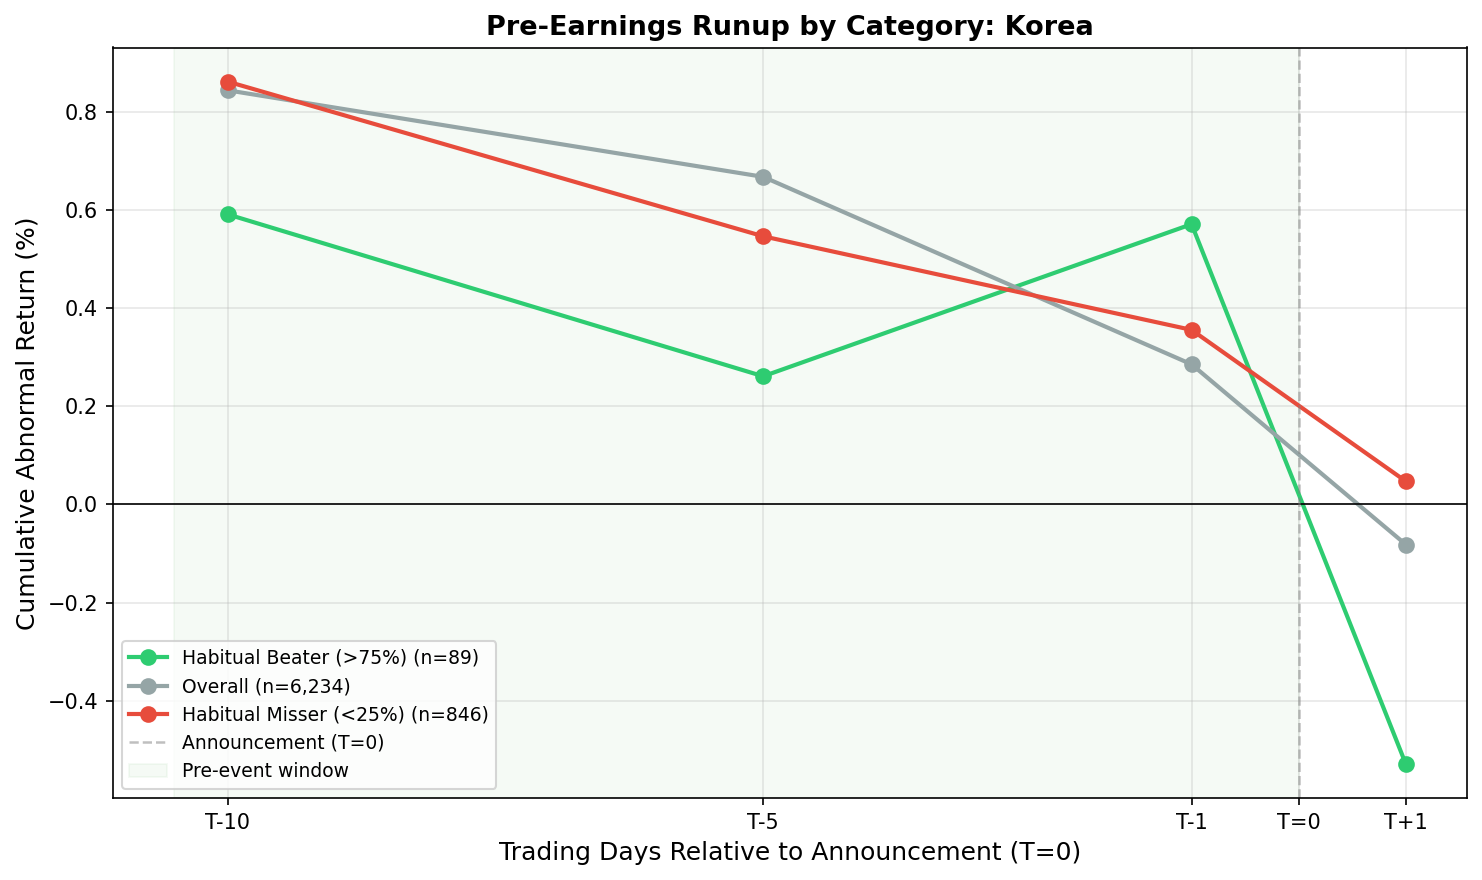
The Unusual Pattern
In the US data, beat history predicts pre-earnings drift cleanly. The market prices in an expected outcome based on track record. Habitual beaters get bought up. Habitual missers get avoided or shorted.
Korea doesn't do that.
The quintile breakdown reinforces this. When we sort all 6,626 events into five buckets by beat rate, from lowest (Q1: 0-25%) to highest (Q5: 56-100%), the T-10 CAR doesn't climb monotonically with beat rate. Q1 misser stocks show +0.593%, Q2 shows +1.013%, Q3 shows +0.755%, Q4 shows +0.591%, Q5 shows +0.577%. There's no gradient. Beat rate doesn't explain the return pattern.
This means the pre-earnings drift in Korea isn't about informed positioning based on historical beat rates. Something else is driving it.

Benchmark Update: EWY to KOSPI
Our original analysis benchmarked against EWY (iShares MSCI South Korea ETF), a US-listed fund. The updated results use KOSPI, the local Korean index that trades on the same calendar and in the same currency as the stocks being studied.
The effect is still large and significant. The T-10 CAR dropped from +0.844% (vs EWY) to +0.709% (vs KOSPI), a reduction of about 14bp. The t-stat remains very strong at 9.02. The structural finding holds: Korean stocks drift up before earnings regardless of beat history.
The difference between the two benchmarks reflects the same issue we found across all non-US markets: US-listed ETFs trade on a different calendar, settle in USD, and carry tracking error. These artifacts inflated or deflated CARs depending on the market.
Why Korea May Be Different
Retail-dominated participation. Korean retail investors make up a large share of KOSPI trading volume, historically higher than most developed markets. Retail tends to buy into earnings anticipation broadly, not selectively by beat history. If enough retail capital flows in before any earnings announcement regardless of track record, you get a market-wide effect.
Disclosure calendar dynamics. Korean disclosure regulations require quarterly reporting with defined windows. When the market knows earnings are coming for a broad swath of KOSPI names in the same period, anticipatory buying may be distributed across the index rather than concentrated in specific beat-history profiles.
Less developed single-stock options market. In the US, options market makers delta-hedge their pre-earnings exposure by buying underlying shares. This creates mechanical buying pressure concentrated in stocks where options volume is highest, typically habitual beaters. Korea's options market, while active for index products, has less single-stock options activity. This channel may produce a flatter, broader drift in Korea.
None of these explanations are definitive. They're hypotheses consistent with the data pattern. The key point is that the US mechanism, informed positioning based on historical beat rate, doesn't appear to be the main driver here.
Data Coverage
The event study covers 2016-2025 in practice. Here's how events are distributed by year:
| Year | Events |
|---|---|
| 2016 | 309 |
| 2017 | 556 |
| 2018 | 684 |
| 2019 | 703 |
| 2020 | 649 |
| 2021 | 701 |
| 2022 | 725 |
| 2023 | 728 |
| 2024 | 838 |
| 2025 | 601 |
2025 is partial. The effective history is roughly 9-10 years, concentrated in 2017-2024 where annual event counts exceed 600.
Limitations
Small habitual beater sample. With n=91, the beater category estimates are unreliable. Any conclusion about habitual beaters in Korea should be treated as directional at best.
Short history. Ten years of effective coverage means the results span one full market cycle. Whether this pattern was present or stronger in earlier years is unknown.
Benchmark. KOSPI is a market-cap-weighted index concentrated in Samsung, SK Hynix, and a handful of large-cap names. Abnormal returns computed against KOSPI may reflect sector tilts in our universe rather than pure pre-earnings drift.
Earnings calendar accuracy. Some historical announcement dates in the FMP data may be approximate. Misaligned event windows reduce precision.
Transaction costs. Korean equities have brokerage fees, securities transaction tax (0.18% as of 2024, being phased down), and bid-ask spreads. A strategy trading in 10 days before earnings and exiting at T+1 would face four transaction legs. The net capture from a 0.71% pre-announcement drift would be reduced.
Takeaway
Korea shows pre-earnings drift that's larger than the US (+0.709% vs +0.067%) and structurally different. In the US, beat rate is the filter. In Korea, beat rate barely matters. Both missers and mixed stocks drift +0.61-0.73% before announcements.
This points to a structural liquidity or positioning dynamic rather than earnings-quality-based selection. Korean markets appear to have a broad calendar-driven pre-announcement bid that doesn't discriminate by historical beat rate.
For practical use, this means the US playbook of filtering for habitual beaters doesn't apply in Korea. The Korean signal is about timing around the disclosure calendar, not about identifying which companies to bet on. Whether that's tradeable after costs is a separate question.
Data: Ceta Research (FMP financial data). Event study: earnings_surprises + stock_eod + key_metrics tables. Market cap filter: exchange-specific threshold. Benchmark: KOSPI (local currency index). Winsorized at 1%/99%. 2016-2025 effective coverage. This is educational content, not investment advice.